
 ?Mathematical formulae have been encoded as MathML and are displayed in this HTML version using MathJax in order to improve their display. Uncheck the box to turn MathJax off. This feature requires Javascript. Click on a formula to zoom.
Abstract
Diversification of livelihoods is crucial to address poverty and food insecurity and improve the welfare of peri-urban people. However, there has been insufficient research exploring livelihood diversification strategies and their determinants in peri-urban areas. This study investigates livelihood diversification strategies and their determinants among peri-urban households in Injibara, Burie, and Gish Abay towns in the Amhara region, Ethiopia. The study used both primary and secondary data, with 393 households included through a multi-stage sampling procedure. Data were collected through interviews, focus group discussions, and field observations. Descriptive and inferential statistics along with a multinomial logit model were employed. The results showed that on-farm alone (36.1%), on-farm plus non-farm (17.5%), on-farm plus off-farm (24.5%), and a combination of on-farm plus non-farm plus off-farm (21.9%) activities were the most pertinent livelihood strategies in the study area. The multinomial logit model results revealed that dependency ratio, land size, distance from the marketplace, access to extension services, exposure to shock, access to training, and cooperative membership were the major determinants of livelihood diversification strategies. Moreover, poor infrastructural development, absence of technical support, inadequate skill training, and lack of awareness are constraints to livelihood diversification in the area. Thus, a comprehensive development plan that enhances successful livelihood diversification is found to be imperative. Therefore, policies and actions aimed at strengthening the livelihoods of peri-urban communities should focus on expanding peri-urban infrastructure, enhancing capacity-building efforts, and stakeholder cooperation.
Public Interest Statement
The study’s focus on ways to diversify one’s income is of the utmost importance since it illuminates how peri-urban residents may do so in order to improve their income, food security, and overall well-being. It is crucial for the design and execution of policies and programmes aiming at promoting sustainable livelihoods in peri-urban areas to identify the factors that influence the decision to choose a variety of livelihood diversification options. The results of the study may help in developing evidence-based policies and interventions that can raise the standard of living in peri-urban interface.
1. Introduction
The majority of the peri-urban population in developing countries rely on agriculture as a source of income, employment, and sustenance (Larsen & Lilleør, Citation2014; Tassie Wegedie & Duan, Citation2018). It has been the principal activity for most peri-urban households in sub-Saharan African countries (SSA), offering strong options for stimulating growth, overcoming poverty, and improving food security (World Bank, Citation2014). However, farming as a primary source of income has failed to guarantee sufficient livelihood for farming households in peri-urban areas (Babalola & Aduba, Citation2014; Mezgebo & Shaughnessy, Citation2014). This is because the agricultural sector in the region is characterized by drought, irregular rainfall, low productivity levels, a high degree of subsistence farming, declining farm sizes due to eviction by various development-induced projects, and urban expansion. Although enhanced agricultural production is conceived to improve and sustain the lives of peri-urban people, agriculture on its own is unable to provide sufficient means to escape poverty for the majority of poor peri-urban households (Asmah, Citation2011). In view of this, studies conducted by Winters et al. (Citation2010) indicate that diversifying the peripheral economy is one of the pathways to escape from poverty and to ensure food security for peri-urban inhabitants.
It is important to note that peri-urban development generates opportunities for non-agricultural employment such as small business, service-oriented jobs, commercial, and manufacturing, which residents including indigenous communities can earn income from. However, indigenous households' involvement, especially peri-urban farmers, depends on their linkage to agriculture and the perceived social outcome since such families may not have the requisite skills or qualifications to participate in urban-sector jobs (Danyi & Angnayeli, Citation2015). Accordingly, social actors make choices based on the constraints, importance, and value and then select the best alternative to yield maximum outcome (Burns & Roszkowska, Citation2016). Therefore, the choice of livelihoods of indigenous peri urban households depends on their access to resources such as land, skills, and their ability to resolve the constraints therein in their quest to make a living in the face of urban encroachment on peri-urban agricultural lands.
Agricultural activities in peri-urban Ethiopia are highly characterized by rainfed, traditional, low productive, fragmented land size, subsistence oriented, and dominated by smallholders where the majority are cultivating less than 0.5 ha (Bazezew et al., Citation2013). In addition, peri-urban households are vulnerable to institutional interventions, such as the expropriation of their farmland for development-induced projects and horizontal urban expansion. Hence, most peri-urban households in the country are exposed to food insecurity and chronic poverty (Mota et al., Citation2019). Therefore, peri-urban people participate in a number of strategies, including agricultural intensification and livelihood diversification, which enable them to fulfill livelihood requirements and attain food self-sufficiency.
The extensive literature on livelihood adaptation and diversification, generally, focus on rural households (Ambaye et al., Citation2021; Ayana et al., Citation2022; Kassie, Citation2018; Washo et al., Citation2021). However, peri-urban areas are different from the rural hinterland because dynamic rural and urban living styles coexist where the rural system fades with the passage of time (Mezgebo & Shaughnessy, Citation2014). Additionally, diversification to the nonfarm sector could be crucial for the peri urban farm households at least to replace the lost farm income (Asfir, Citation2016).
Despite the presence of many agricultural policies that Ethiopia has implemented such as market liberalization, structural adjustment, Agricultural-Led Industrialization, Sustainable Development and Poverty Reduction Program, Participatory and Accelerated Sustainable Development to Eradicate Poverty, and successive Growth and Transformation Plans I and II to raise productivity in agriculture between 1991 and 2016, Ethiopia’s agricultural production is deemed low and concentrates mostly on on-farm agricultural development (Shikur, Citation2020).
Thus far, these policies have not included non-agricultural livelihood strategies in the policy framework (Kassie, Citation2018). Despite its growing importance for Ethiopia’s poor, the necessity of livelihood diversification has received little attention. Hence, examining factors that influence farm household’s income diversification strategy in the context of peri-urban areas is crucial to mitigate hurdles of rural urban livelihood transitions. Therefore, the objective of this study is to (i) assess the determinant factors of livelihood diversification of peri-urban farmers and (ii) examine the livelihood diversification activities of indigenous peri-urban farmers.
2. Literature review
2.1. Concepts and definition of livelihood diversification
The term “livelihood” refers to a way of living to sustain one’s life and provide basic needs (Khatun & Roy, Citation2011). Livelihood attempts to capture not just what people do to make a living, but the resources that provide them with the capability to build a satisfactory living, the risk factors that they must consider in managing their resources, and the institutional and policy context that either helps or hinders them in their pursuit of a viable or improving living (Ellis & Allison, Citation2004). Livelihood diversification is defined as the process by which rural families construct a diverse portfolio of activities and social support capabilities in their struggle for survival and to improve their standard of living (Ellis, Citation1998). Therefore, livelihood strategies are a combination of the activities that people choose to undertake to achieve their livelihood goals (Ellis & Allison, Citation2004). Livelihood diversification is the grouping of on-farm, off-farm, and non-farm activities to earn a living (Kanza & Vitale, Citation2015).
Livelihood strategies: are coping mechanisms, also known as, comprise the range and combination of activities and choices that people undertake to achieve their livelihood goals. They must be understood as a dynamic process in which people combine activities to meet their various needs at different times and on different geographical or economic levels, whereas they may even differ within a household. Their direct dependence on asset status and transforming structures and processes becomes clear through their position within the framework. A changing asset status may further or hinder other strategies, depending on the policies and institutions at work (Ellis, Citation1998).
Livelihood Outcomes: are the achievement of livelihood strategies, such as increased income, increased well-being (non-material goods such as self-esteem, health status, access to services, and sense of inclusion), reduced vulnerability (better resilience through increase in asset status), and improved food security (e.g., increase in financial capital derived from the combination of one or more livelihood capitals in order to buy or produce foods). Outcomes help us to understand the “output” of the current configuration of factors within the livelihood frame work; they demonstrate what motivates stakeholders to act as they do and what their priorities are.
They might give us an idea of how people are likely to respond to new opportunities and which performance indicators should be used to assess support activities. Livelihood outcomes directly influence assets and dynamically change their levels, thus offering a new starting point for other strategies and outcomes.
2.2. Theoretical perspective
This study is based on the assumptions of empowerment and rational choice theories. The empowerment theory links an individual’s well-being to social and political forces and is concerned with how marginalized people access and manage vital resources necessary for survival (Perkins & Zimmerman, Citation1995). A society’s activities and social processes can either inspire or disempower individuals, and empowerment outcomes may involve a sense of autonomy and resource mobilization abilities for individuals or proof of available neighborhood services for groups (Perkins & Zimmerman, Citation1995). Empowerment occurs through individual and concerted social action. In the context of marginalized groups, such as evicted farmers, the central question is whether access to resources such as land, labor, education, and job opportunities increases or decreases their ability to diversify their livelihoods, which is crucial in peri-urban areas with a declining arable land supply. Applying the empowerment theory to analyze the livelihood diversification strategies of indigenous peri-urban farmers highlights the importance of access to essential assets such as land, education, and employment opportunities for diversification (Pigg, Citation2002).
On the other hand, the rational choice theory posits that in a decision-making situation, an individual or collective entity selects or determines alternate acts or sequences of actions from their available alternatives, which are both feasible and unambiguously identified (Burns & Roszkowska, Citation2016). This principle asserts that an individual evaluates the effects and potential payoffs associated with each choice and is presumed to be mindful of all practical consequences associated with their alternative acts (Burns & Roszkowska, Citation2016; Sato & Royset, Citation2010). When faced with a decision-making situation, an agent considers a finite number of alternatives, assigns them consequences, priorities, and values these consequences, and chooses the best option among the possible alternatives (Burns & Roszkowska, Citation2016). Rational decision behavior is motivated by the individual’s self-interest in the results as they perceive or define them (Burns & Roszkowska, Citation2016). The actor measures the costs and benefits of different choices, primarily relying on the implications for themselves, and chooses the option with the greatest net advantage or “utility.” (Burns & Roszkowska, Citation2016; Sato & Royset, Citation2010). The rational choice theory has been applied to business decisions about productivity, output, spending, and technical transformation, as well as personal and household choices about consumption and savings (Burns & Roszkowska, Citation2016). Therefore, it can help explain how indigenous peri-urban farmers make decisions about livelihood diversification.
2.3. Reason for livelihood diversification
Diversification of income sources, ownership of assets, and occupations are the norm for individuals or households for different socioeconomic reasons. Households and individuals are motivated to diversify asset ownership and income-generating activities. According to the literature, peri-urban households have various motives for diversifying their income sources and generation patterns, instead of concentrating on agriculture with potential gains from specialization.
According to Ellis (Citation2000), the reasons for income diversification are seasonal labor use, differentiated labor markets, household risk strategies and coping behaviors, credit market imperfections, and household savings and investment strategies. Thus, non-farm and off-farm incomes can help overcome credit and insurance problems. It could also provide income-earning opportunities outside the growing season, employ the household’s extra labor, help in managing weather and other risks, such as eviction from their agricultural land, and ensure smoother consumption throughout the year.
Diversification profiles illustrate clear dualistic tendencies, that is, the richest diversifies in order to promote economic growth and accumulate additional wealth, whereas the poorest diversifies in order to survive. In general, livelihood diversification can be classified into pull and push factors. Diversification due to “pull” factors is a response by households to exploit the economic opportunities created by local economic and population growth, proximity to urban markets, and improvements in infrastructure. In contrast, “push” factors, which are mostly common in peri-urban farmers, are those that force households to diversify as a coping strategy such as land expropriation and falling income. Hence, diversification of poor households in developing countries is usually a response to “push” factors (Barrett et al., Citation2001).
Peri-urban farm households require diversification of the nonfarm sector to sustain themselves, unlike rural households. However, limited access to rewarding nonfarm activities due to entry barriers (Abdulai et al., Citation2021; Barrett et al., Citation2001); and missing markets for labor and land (Barrett et al., Citation2001) creates hurdles. This implies that households who were benefiting from diversified agricultural activities due to asset fixity, such as owning irrigation canals, hand-dug wells, specific agricultural tools, and skills, are likely to be marginalized in the shift from farm to nonfarm employments—not only asset-poor farm households.
In conclusion, peri-urban farmers in the study areas are highly vulnerable to push factors such as land eviction due to development induced urban expansion which ultimately diminishes their agricultural income. Therefore, households in the peri urban are forced to shift their lives from on-farm alone based income generation activities to non-farm and off-farm activities or a combination of them in order to make a living sustainably. Hence, the majority of households in the study areas diversify their income in response to push factors such as a coping strategy or the land they lost due to eviction.
2.4. Conceptual framework
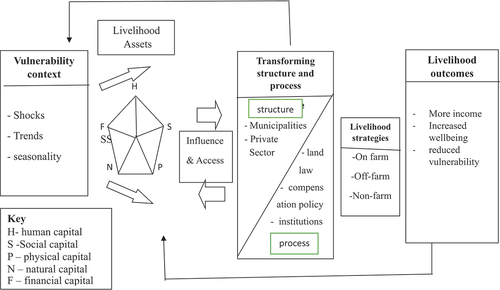
Another significant feature of livelihoods is their interdependency. Very few livelihoods exist in isolation. A livelihood offered may be dependent on other means of subsistence for accessing and exchanging properties. Livelihoods also fight to get access to assets. Consequently, in turn, positive and negative impacts on any given life could affect others. Livelihood strategies, for example, combine agronomic strategies (such as agricultural intensification versus extensification) with diversification of livelihoods (Scoones, Citation2009). Therefore, the linkages between them were forward and backward. As indicated in sustainable livelihood Framework (DFID Department for International Development, Citation1999) the livelihood of a given household is dependent up on its asset endowments mainly human, social, physical, financial, and natural capitals which together enable households to pursue a sustainable livelihood
On the other hand, livelihood strategies are the combination of activities (on-farm, off-farm, and non-farm) that people choose to undertake in order to achieve their livelihood goals (Ellis, Citation2000). However, livelihood activities are actions taken by the household to obtain household income. Therefore, the concept of livelihood includes the assets needed for a means of life and activities (livelihood diversification) and is sustainable when it can cope with and recover from shocks and stresses and retain or boost its livelihood outcomes (more income, increased wellbeing, and reduce vulnerability) now and in the future. This highlights the interplay that tends to be dynamic and contextual between the various components of the Livelihood Framework Approach. For this study, thus, Sustainable Livelihood Approach was used as an empirical tool to examine what are the structures and processes that affect the vulnerability context of the households? What are the livelihood assets that influence/access to transforming structures and process/what livelihood strategies are implemented by the households/what livelihood outcomes are have effect on livelihood assets? Finally, the framework starts out from the perspective of vulnerability and concludes with the outcome of the livelihood (Figure ).
Figure 1. Livelihood frame work depicting interplay between environment and community.
3. Methodology
3.1. Description of the study area
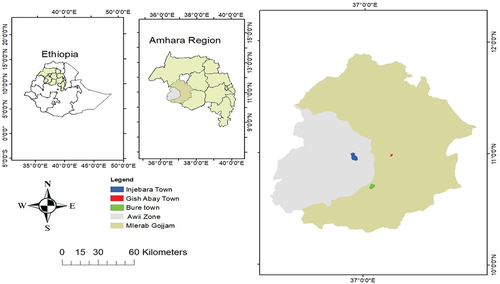
The study was conducted in the urban areas of the Amhara National Regional State (Injibara, Burie, and Gish Abay). Injibara city is the administrative center of the Awi Zone in the Amhara Region and is located 420 km northwest of Addis Ababa (capital city of Ethiopia) and 135 km southwest of Bahir Dar (capital of the Amhara region) and 10°57′N 36°56′E at an elevation of 2560 m above sea level. Based on the 2007 census, Injibara has an estimated total population of 21,065, of whom 10,596 are males and 10,469 are females, but is projected to be 56,723 by 2023, an increase of more than double in 15 years. Modern Injibara was constructed in 1991 at a place called Kosober by locals, at the junction of the highway from Addis Ababa to Bahir Dar and the road leading west towards the Benishangul Gumuz regional state and towards the Grand Ethiopian Renaissance Dam. On the other hand, Bure is a town in western Ethiopia that was established in 1608. It is located in the west Gojjam Zone of the Amhara Region and serves as the administrative center of the Burie district. It has a geographical location of 10°42′0″” N 37°4′0” ″ E, with an elevation of 2091 m above sea level. Bure enjoys a flourishing large business and a connection point for businesses between Wolega, Gondar, and Shewa. Moreover, it is one of the largest agricultural industrial parks in the country (Central Statistical Agency, Citation2013). Gish Abay is a town in western central Ethiopia located in the West Gojjam Zone of the Amhara Region. It is the administrative center of Sekela Woreda. The town is named after the nearby Mount Gish and the Abay River (Blue Nile), whose source is the foothills of the mountain. The town is connected by a 39 km gravel road to Tilili, which is located on the main Addis Ababa—Debre Markos—Bahir Dar Road. The geographical location of the town is found with the coordinates of 10°59′N and 37°13′E with an elevation of 2,744 meters above sea level (Central Statistical Agency, Citation2013). The study area map is presented in Figure above.
Figure 2. Map of the study areas.
3.2. Research design and approach
Qualitative and quantitative approaches were used in this study. A quantitative inferential approach was used to generate quantitative data that could be accurately analyzed quantitatively using a formal and rigorous method to infer population characteristics or relationships. It usually refers to survey research when a sample of the population is questioned and interviewed to ascertain its characteristics in order to determine whether the population as a whole exhibit such characteristics. Moreover, the qualitative approach employed in this research was concerned with the subjective assessment of attitudes, opinions, and perceptions in situations in which the function of the researcher’s insights and impressions generated results either in a non-quantitative form or in a form that was not subjected to exact quantitative analysis. Questionnaires, interviews, and focus group discussions were employed to collect data for the study. The gathered data were triangulated using the above two data analysis approaches. A descriptive survey research design was employed because it is popular to determine whether two or more groups differ in some variables of interest (Kothari, Citation2004).
3.2.1. Data types and source
To attain the objective of this research, all required data were collected from both primary and secondary data sources. The primary data source was a household survey using a pre-tested structured questionnaire by conducting face-to-face interviews to reduce the nonresponse rate and incompleteness of data. Secondary data were collected from published and unpublished materials, including the websites.
3.2.2. Sampling technique and sample size
A multi-stage sampling technique was applied to determine the sample households. Amhara regional state is selected purposively because of its fast urbanization growth rate (6%) compared to other regions and even larger than the national average (4%). In the second stage, two representative zonal administrations, Awi and West Gojjam, were randomly selected from 11 zones where urban expansion is undergoing in the region based on their swiftness of urban expansion. In the third stage, three municipalities, Injibara, Burie, and Gish Abay were randomly selected out of the existing municipalities based on the urban expansion potential and speed of urban growth where large number of investors are attracted, public sector projects are expanding drastically, industrial expansion and land demand for residential is accelerating compared to others. In the fourth stage, the respective peri-urban kebeles (five kebeles from Injibara, four kebeles from Burie and two kebeles from Gish Abay municipalities) were selected purposively for easy access of the targeted population. Finally, from the household list available at each municipality, each municipality’s peri urban households were selected systematically to select the respondents from the list based on probability proportional to sample size (PPS) method.
From 11 peri-urban kebeles, 393 household farm households were selected randomly based on their proportions in the population. The total required sample size was determined using (Kothari, Citation2004) formula;
Where;
n = sample size, z = value of the standard variate at a given confidence level (z = 1.96, 95% confidence level), P = sample proportion, q = 1-p, and e = acceptable error (e = 5% or 0.05). N is the total number of households from which the sample was drawn. Thus, the sample size of evicted households is
Thus, the sample size of non-evicted households will be:
Therefore, a total sample size of 393 respondents was randomly selected from the generated strata sampling frame from the roasters of each kebele administration office.
3.2.3. Model specification
Both Probit and Logit analyses are well-established approaches in the literature for estimating dummy-dependent variables (Babalola & Aduba, Citation2014). However, when there are many observations at the extremes of the distribution, logit is preferred over probit, and the logit model is computationally easier to use than the other type. Therefore, we used a logit model in this study.
Following (Greene, Citation2000), suppose that for the ith respondent faced with j choices, utility choice j can be specified as:
If the respondent chooses j in particular, Uij is the maximum among the j utilities. Therefore, the statistical model is derived based on the probability that choice j is made:
where Uij is the utility of the ith respondent from livelihood strategy j, and Uik is the utility to the ith respondent from livelihood strategy k. Thus, the ith household’s decision can be modeled as maximizing the expected utility by choosing the jth livelihood strategy among j discrete livelihood strategies; that is,
In general, for an outcome variable with J categories, let the jth livelihood strategy that the ith household chooses to maximize its utility take the value 1 if the ith household chooses the jth livelihood strategy and 0 otherwise. The probability that a household with characteristics x chooses livelihood strategy j, then Pij is modeled as
With the requirement that for any i
Where: Pij= probability representing the ith respondent’s chance of falling into category j
X = Predictors of response probabilities
= Covariate effects specific to jth response category with the first category as the
reference.
An appropriate normalization that removes an indeterminacy in the model is to assume that (this arise because probabilities sum to 1, so only J parameter vectors are needed to determine the J + 1 probabilities. So that
, implying that the generalized EquationEquation (4)
(4)
(4) is equivalent to:
Where: y is a polytomous outcome variable with categories coded from 1—-J.
D) Definition of Variables and Working Hypothesis
In this study, peri-urban households participated in different livelihood strategies. Therefore, the dependent variable is a polytomous response that takes value.
Y (1) if the household choice of livelihood strategy is on-farm alone.
Y (2) if the household’s choice of livelihood strategy is on-farm plus non-farm
Y (3) if the household’s choice of livelihood strategy is on-farm plus off-farm and
Y (4) if the household’s choice of livelihood strategy is a combination of on-farm, non-farm, and off-farm.
As Table above showed the distirbution of sample by household, the independent variables expected to determine the choice of livelihood strategies for peri-urban households in the study area are described in Table .
Table 1. Distribution of sample households by municipalities
Table 2. Summary of Definition of explanatory variables of MNL model
3.2.4. Method of data analysis
Data were analyzed using one-way ANOVA, such as mean, standard deviation, maximum, minimum, percentage, frequency, and chi-square test. Multinomial logistic (MNL) regression analysis was used to analyze the determinants of livelihood diversification strategies among peri-urban households to determine the determinant factors for households to choose and adopt livelihood diversification strategies, where the dependent variable has multiple outcomes (j = 1, …, 4, where a household choice relies on j(1) = on-farm alone; j(2) = on-farm + non-farm; j(3) = on-farm + off-farm; j(4) = on-farm + non-farm + off-farm income-generating activities). The MNL model is estimated by normalizing the on-farm alone livelihood strategy as the reference category for the analysis. The maximum likelihood estimates, as indicated by the chi-square test, were found to be highly significant (Table ). A test of multicollinearity is used to check the degree of linear relationships among continuous explanatory variables using the following formula:
Table 3. Livelihood diversification strategies of peri urban households
Hence, VIF for all continuous variables was less than 10 and greater than one. The VIF for all variables used in this study was 1.07. Thus, the absence of an association between continuous variables included in the model is confirmed. Similarly, the results of the contingency coefficient test revealed that there was no problem of association among the seven discrete explanatory variables. This indicates that there is no serious multicollinearity problem. Therefore, all hypothesized explanatory variables (Table ), which were expected to affect the choice and adoption of household livelihood diversification strategies, were included in the MNL analysis using STATA 14.
4. Result and discussion
4.1. Descriptive statistics
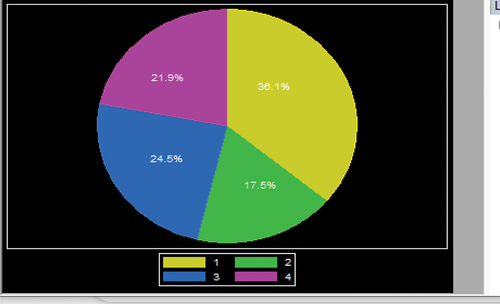
Livelihood strategies are a combination of activities that people undertake to survive and fulfill their livelihood requirements. In their day-to-day struggles, peri-urban people pursue a number of strategies to attain their livelihood goals. In Injibara, Burie, and Gish Abay peri-urban areas, a large proportion of the sample households (36.1%) were solely engaged in agriculture (crop—livestock production), whereas 17.5% of the households combined on-farm and non-farm activities. Among the surveyed households, approximately 24.5% pursued on-farm + off-farm activities, and the remaining 21.9% practiced a combination of on-farm, non-farm, and off-farm activities as their livelihood strategies (Figure ).
Figure 3. Choices of the livelihood diversification strategy adopted by the sampled household.
Despite the various approaches for characterizing household livelihood strategies, the most common approach used by economists is grouping households by the share of income earned from different sectors of the peri-urban economy. This approach is simple, and effectively delineates households into different livelihood categories (Barrett et al., Citation2001). Likewise, this study considered the income shares of each livelihood activity to conceptualize the livelihood strategies of peri-urban households. Farm expropriation is a peculiar characteristic of peri-urban communities due to development-induced projects and urban expansion. In this regard, peri-urban households pursued non-farm and off-farm activities in addition to agriculture as their primary livelihood strategies, while a greater proportion of the households derived their livelihoods from agriculture alone (Table ).
The survey results indicate that peri-urban households in the study area obtained income from agriculture, non-farm, off-farm, and/or a combination of activities. On-farm activity, which embraces both crop production and animal rearing, is the dominant livelihood source or means of survival strategies in the study area. Some of the major crops grown in the area include maize, sorghum, rice, sesame, and soybeans. The results of field observations also indicated that vegetables such as chilies, pepper, cabbage, carrot, tomato, and fruits such as papaya, mango, and orange are cultivated. In addition, cattle, sheep, goats, donkeys, and poultry are major livestock reared by the community in the area for both income and consumption purposes. In this study, non-farm refers to activities that take place outside the agricultural sector, such as petty trade, rural craft, and remittances. Off-farm refers to agricultural activities that take place outside the person’s farm area (wage laborer, land rent, environmental gathering/firewood, and charcoal selling).
4.2. Analysis of livelihood strategies using one‑way ANOVA and chi—square tests
A one-way analysis of variance (F-test) was conducted to examine whether there were significant differences in the mean scores of continuous explanatory variables across livelihood groups, and the results of a post hoc test were included for multiple comparisons. The F-test results showed the existence of a statistically significant mean difference between peri-urban households in terms of landholding size and dependency ratio at less than 1%, market distance at the 5% significance level, and family size and total annual income at the less than 10% significance level (Table ).
Table 4. ANNOVA test result of continuous variables
The landholding sizes of the respondents ranged from 0 to 2 ha, and the average landholding size of the sample households was 0.798 ha. As can be seen in Table , households pursuing on-farm alone as their livelihood strategy had relatively better landholding size than their counterparts. The mean value of farm size owned by households who are relying on agriculture alone was 1.26 ha, while it was 0.87, 0.70, and 0.69 ha for those who are engaged on-farm + non-farm, on-farm +off-farm and on-farm + non-arm + off-farm activities, respectively. A one-way between-group analysis of variance was conducted to explore the impact of landholding size on the choice of livelihood strategies. Household livelihood strategies were categorized into four groups (Group 1, on-farm alone; Group 2, on-farm +non-farm; Group 3, on-farm + off-arm; and Group 4, on-farm + non-arm + off-farm). There was a statistically significant mean difference in landholding size between the groups, as demonstrated by the one-way ANOVA (F (3, 392) = 5.44, p = 0.001). A Tukey post hoc test indicated that the mean score for Group 1 (M = 1.26, SD = 0.74) was significantly different from Group 2 (M = 0.87, SD = 0.48), Group 3 (M = 0.7, SD = 0.37), and Group 4 (M = 0.69, SD = 0.35) at p < 0.01 level.
The total mean dependency ratio of households is 1.14, with a standard deviation of 0.74. The average dependency ratios of households that chose the livelihood strategies of on-farm alone, on-farm + non-farm, on-farm + off-farm, or a combination of on-farm + non-farm + off-farm were 1.21, 0.67, 1.54, and 0.97, respectively. This implies that those households that rely on on-farm alone have a higher dependency ratio as compared to the rest of the groups, and thus, the mean dependency ratio owned by the households significantly varies across different livelihood strategies (p < 0.01) (Table ). A one-way between-group analysis of variance was conducted to investigate the impact of the dependency ratio on the choice of livelihood strategies. There was a statistically significant mean difference in the dependency ratio holding size between groups, as indicated by one-way ANOVA (3, 392) = 23.93, p = 0.000. Post hoc comparisons using the Tukey Honest Significant Difference (HSD) test revealed that the mean score for Group 1 (M = 1.21, SD = 0.60) was significantly different from Group 2 (M = 0.67, SD = 0.24), Group 3 (M = 1.54, SD = 0.94), and Group 4 (M = 0.97, SD = 0.68) at the p < 0.01 level of significance.
Family size was considered in this study as the number of individuals or household members living together in the respondent’s home. The family sizes of the sample respondents ranged from 1 to 8, with a mean of 3.2 and a standard deviation of 1.35. Based on their livelihood strategies, the average family size of the households that chose on-farm alone, on-farm + non-farm, on-farm +off-farm, and on-farm + non-farm + off-farm as livelihood strategies was 2.97, 3.43, 3.35, and 3.26, respectively. A one-way between-group analysis of variance was carried out to examine the impact of family size on the choice of livelihood strategies. There was a statistically significant mean difference in family size for the livelihood groups, as indicated by one-way ANOVA (F (3, 392) = 2.54, p = 0.05). Post hoc comparisons using the Tukey test showed that the mean score for Group 1 (M = 2.97, SD = 1.22) was significantly different from Group 2 (M = 3.43, SD = 1.61), Group 3 (M = 3.35, SD = 1.15), and Group 4 (M = 3.26, SD = 1.47) at p < 0.1 level of significance.
The results of this study also indicated that, on average, those households who reside nearest to the market center were more engaged in non/off-farm and/or a combination of activities than those who live far from the market. A one-way analysis of variance was conducted to explore the effect of market distance on the choice of livelihood strategies. There was a statistically significant mean difference in the market distance for the livelihood groups, as indicated by a one-way ANOVA (F(3, 392) = 2.85, p = 0.037). Post hoc comparisons using the Tukey test indicated that the mean score for groups being compared was significantly different from one another at p < 0.05. Similarly, total annual income variation was observed among households that practiced various livelihood strategies. A one-way between-group analysis of variance was carried out to scrutinize the effect of income on the choice of livelihood strategies. There was a statistically significant mean difference in annual income for the livelihood groups, as indicated by the one-way ANOVA (F(3, 392) = 23, p = 0.06). Post hoc comparisons using the Tukey test indicated that the mean scores for the groups being compared were significantly different from one another at p < 0.1 level.
A chi-square test was conducted to examine whether there was an association between discrete variables and livelihood strategies of the sample respondents. As indicated in Table , the chi-square test results showed the existence of significant differences in the choice of livelihood strategies among the peri urban households at the less than 1% level (χ2-value = 89.85, p < 0.01) (Table ). Moreover, there is a statistically significant difference among the livelihood groups in terms of dummy/categorical variables such as access to extension services, access to productive safety net programs, participation in various leadership positions of the local community, exposure to shock, access to participation in various trainings, and membership in agricultural cooperatives at less than 1% (Table ).
Table 5. Summary of statistics for continuous explanatory variables by choice of livelihood strategies
Table 6. Descriptive results for dummy explanatory variables by choice of livelihood strategies
4.3. Determinants of livelihood diversification strategies
Multinomial logistic regression was performed to model the relationship between the predictors and livelihood diversification strategies of peri-urban households in the study area. Accordingly, this section presents the results obtained from the multinomial logit model, indicating the significant factors that determine households’ livelihood strategies. Before running the model, multicollinearity tests among the hypothesized explanatory variables were performed using the variance inflation factor for continuous variables and the contingency coefficient for discrete variables. Multicollinearity test results showed no serious problems among the explanatory (dummy and continuous) variables. In addition, the model was run and tested for the validity of the independence of irrelevant alternatives (IIA) assumption using the Hausman McFadden test. Upon examining the output from the Hausman test (Prob > chi2 = 0.8642), we see that there is no evidence that the IIA assumption has been violated. Therefore, we present major findings on the factors that affect households’ livelihood strategies. The results of the multinomial logit model indicate that among the hypothesized variables, distance to the market (dismkt), dependency ratio (depend), landholding size (landsize), access to extension services (accextn), exposure to shock (exposure), access to training (acctrain), and membership in cooperatives (coopmemb) were the major determinants of livelihood diversification strategies (Table ).
Table 7. Multinomial logit model result on determinants of livelihood diversification strategies
The model results are presented using the on-farm alone strategy as a base/reference case scenario. The model results indicated that distance from the nearest market (dismkt) had negative and significant effects on households’ choices of on-farm + non-farm and on-farm + off-farm livelihood strategies at the 1% and 5% significance levels, respectively. The negative association between market distance and diversification indicates that livelihood diversification decreases as distance from the market center increases. The marginal effect showed that, keeping other factors constant, a one-kilometer increase in market distance decreased the likelihood of choosing on-farm + non-farm or on-farm + off-farm activities by 0.07% and 0.06%, respectively, relative to the base category. In other words, peri urban farm households in the study areas who are closer to the market center participate more in various livelihood activities. A possible explanation for this could be attributed to the fact that households far from the market center have no easy or quick physical access to the market to transport the amount produced. FGD participants mentioned that proximity to the market center creates access to additional income by providing non-farm employment opportunities and easing access to input and transportation. Similarly, previous studies conducted and reported that as market distance increases from home, households’ non-farm income diversification is discouraged due to transportation costs (Kassie, Citation2018; Tizazu et al., Citation2018).
Landholding size (landsize) of the households in Injibara, Burie and Gish Abay peri urban areas has negatively and significantly influenced livelihood diversification into on-farm + off-farm and on-farm + non-farm + off-farm activities equally at less than 1% level of significance. The marginal effect indicates that keeping other variables constant in the model, a one-hectare increase in the farm size of a household decreases the likelihood of choosing on-farm plus off-farm or on-farm + non-farm + off-farm activities by 0.07% and 0.132%, respectively, relative to the base case. This implies that households with large land holdings are less likely to diversify their livelihoods than those with smaller holdings. Consequently, households with large farms rely more on agriculture than diversifying their livelihood activities to meet their livelihood requirements. One possible reason for this is that large landholding sizes enable farm households to follow agricultural intensification to produce more and increase farm income. In agreement with this result, a study conducted by (Gebru et al., Citation2018b) in the Tigray Region of Ethiopia also found that the probability of engaging in various livelihood strategies decreased as landholding size increased, and the researcher argued that farmers with larger landholdings were encouraged to engage in more farming activities.
The dependency ratio (depend) negatively and significantly influenced the household choices of on-farm + non-farm, on-farm + off-farm, and a combination of on-farm + non-farm + off-farm strategies equally at a less than 1% probability level in the peri urban areas of Injibara, Burie, and Gish Aba town peripheries. This finding indicates that households with high dependency ratios are less likely to diversify their livelihood strategies. Based on the model results, the marginal effect reveals that the likelihood of a household engaging in on-farm + non-farm, on-farm + off-farm, and on-farm + non-farm + off-farm strategies decreased by 0.328%, 0.23%, and 0.032%, respectively, with a 1% increase in dependent family members in the household. This implies that households with a high dependency ratio have a low probability of participating in off-farm and non-farm income-generating livelihood diversification strategies. A possible explanation for this could be attributed to the fact that the availability of an increased number of individuals aged below 15 and above 64 years implies the availability of a large number of dependents who are unable to engage in non-farm income-generating livelihood activities. The finding of this study is consistent with those of (Gebru et al., Citation2018b) and (Khatun & Roy, Citation2011).
The study found that access to training (ACCAIN) positively and significantly affected the choice of on-farm and off-farm activities at a significance level of less than 1%. This implies that households who participated in various income-generating training activities were more likely to have diversified their livelihood activities, whereas peri-urban households who did not participate in income-generating training did not practice diverse livelihood strategies. If other factors remain constant, the probability of livelihood diversification into on-farm and off-farm activities for households that have access to training increases by 0.216% compared to their counterparts in the base case. Training enhances and improves the knowledge, skills, and experiences of farmers, enabling them to expand their income generation options. This finding agrees with that of (Asfir, Citation2016).
Access to extension services (extn) plays a central role in improving the livelihood of peri-urban households. As expected, the results of the estimated coefficient show a positive and statistically significant relationship (p < 0.01 and p < 0.05) between access to extension services and farmers livelihood diversification into on-farm + off-farm and on-farm + non-farm + off-farm activities, respectively. As of prior expectation, farmers who have access to contact with extension workers were found to be the ones who diversified their livelihood diversification strategies into on-farm + off-farm and on-farm + non-farm + off-farm activities. A possible explanation for this could be that extension workers not only provide agricultural extension services to farmers but also entrepreneurial skills, which are the entry points for participating in off-farm income business activities. The results of this study are consistent with those of (Gebru et al., Citation2018b).
Exposure to shocks (exposhock) occurs if the household is experiencing shocks, health problems, or the death of stock, which is expected to be linked positively with livelihood diversification strategies. As projected, this variable had a positive and significant influence on participation on-farm + off-farm and on-farm + non-farm +off-farm strategies were affected positively at a less than 1% significance level as compared with the on-farm alone strategy. This means that households that are more vulnerable to different animal or crop risks have a greater chance of participating in off-farm and non-farm livelihood strategies than households that do not face any risks. When other factors are fixed, households exposed to shocks have a higher probability of participating in the on-farm + non-farm, on-farm + off-farm, and on-farm + non-farm + off-farm livelihood strategies (by 0.02%, 0.17%, and 0.08%, respectively) than households that do not face any type of risk. Therefore, exposure to idiosyncratic shocks is expected to positively affect diversification. This result is in agreement with that of (Yizengaw, Citation2014).
As projected, the sign of the estimated coefficients was found to have a positive relationship between membership in cooperatives (coopmem) and on-farm + non-farm, on-farm + off-farm, and combinations of on-farm + off-farm + non-farm livelihood strategies and was statistically significant at the 1% probability level. If other factors remain constant, the marginal effect in favor of the smallholder farmers who choose on-farm + non-farm, on-farm + off-farm, and combinations of on-farm + off-farm + non-farm livelihood diversification strategies increase by 0.096%, 0.048%, and 0.057%, respectively, compared to those who are not cooperative membership households. Households that are members of formal cooperatives gain benefits such as sharing income and labor, access to credit, reduced individual transaction costs, and updated market information on farm products, such as inputs and farm equipment. This result agrees with the findings of (Khatun & Roy, Citation2011) and (Gebru et al., Citation2018b).
5. Conclusions and recommendations
Livelihood strategies are a means of making a living, and to support them, we need to identify what people are doing and their diversification. This study aims to identify the livelihood strategies and determinants of diversification in the peri-urban areas of selected western Ethiopian cities. It was found that agriculture is the main economic activity and basis of livelihoods for the peri urban households of the study area. The farming system is predominantly rain-fed, traditional, subsistence oriented and it is mixed crop—livestock production. Uncontrolled population growth coupled with smaller farm size due to eviction by development induced urban expansion, rainfall dependency, erratic rainfall pattern, and low return from farming activities has forced the peri-urban households to pursue different income generating activities for their survival and livelihood improvement as well as to cope with the challenges of their livelihoods. The survey results revealed that on farm activity alone (36.5%), on-farm plus non-farm (17.5%), on-farm plus off-farm (24.5%), and a combination of on-farm plus non-farm plus off-farm (21.9%) activities are the most pertinent livelihood strategies in the area. The income portfolio analysis indicated that on-farm activity has a leading contribution to the total income of the households which accounts for about 75.6%, whereas the share of non-farm and off-farm activities accounts for 16.6% and 7.8% of the total household income, respectively. Multinomial logit model result showed that among the hypothesized variables dependency ratio, land size, distance from the marketplace, access to extension services, exposure to shock, access to training, and cooperative membership were the major determinants of livelihood diversification strategies. Moreover, it was found that lack of infrastructural development, poor rural—urban linkage, absence of technical support from concerned bodies, farmland scarcity, lack of working capital, limited access to credit facilities, lack of access to market, inadequate skill training, and lack of awareness, as well as poor coordination and collaboration among different stakeholders are constraints to livelihood diversification in the area. The study concludes that the agricultural sector alone cannot be relied upon as the core activity for rural households and as a means of reducing poverty, achieving food security, and improving livelihoods in the study area. Thus, a comprehensive development plan that enhances successful livelihood diversification is found to be imperative and most urgent. Policies and actions directed towards improving the livelihood of peri urban communities should focus on the development and expansion of peri urban infrastructures like road network, market linkage to their products, strengthening rural—urban linkage and the provision of credit services and trainings, awareness creation activities, as well as institutional arrangements and cooperation to bring sustainable livelihood outcome in the area.
5.1. Limitation of the research and area of further study
This study was conducted to analyze the choice of livelihood diversification strategies and determinant factors in the peri urban areas of some selected towns in Amhara regional state, Ethiopia using cross-sectional data collected from households. However, using time series or longitudinal data with wider coverage would have been a more comprehensive and efficient approach. Unfortunately, it was quite difficult to retrieve recorded data at the individual level. In order to establish causation and track changes in household welfare and livelihood diversification choices over time, longitudinal data may have been instrumental. As a result, this study is limited by these technical constraints, and future research should explore this area further.
Acknowledgments
We would like to thank Arba Minch University for funding this study.
Disclosure statement
No potential conflict of interest was reported by the author(s).
Additional information
Notes on contributors
Tadele Alamneh
Tadele Alamneh is a PhD Scholar in Development Economics at Arba Minch University, Ethiopia. His areas of research interest include macro-economic analysis, efficiency analysis, livelihood analysis, impact analysis, and choice experiments. He has published many manuscripts in internationally reputable journals and presented his papers in more than 10 national and international conferences.
Melkamu Mada
Melkamu Mada is Associate professor of Economics, PhD, in the department of economics at Arba Minch University. He has published more than 26 articles in internationally reputable journals. His research interests include livelihood analysis, impact analysis, environmental valuation method analysis, and poverty analysis.
Tora Abebe
Tora Abebe has a PhD in economics and serves as a lecturer for various economics courses and supervisor of many post-graduate students at Arba Minch University, Ethiopia. His research interests include impact analysis, poverty analysis, and efficiency analysis. He has published several articles in internationally reputable journals.
References
- Abdulai, I. A., Derbile, E. K., & Fuseini, M. N. (2021). Livelihood diversification among indigenous peri-urban Women in the Wa municipality, Ghana. Ghana Journal of Development Studies, 18(1), 72–20. https://doi.org/10.4314/gjds.v18i1.4
- Abera, A., Yirgu, T., & Uncha, A. (2021). Determinants of rural livelihood diversification strategies among Chewaka resettlers’ communities of southwestern Ethiopia. Agriculture & Food Security, 10(1), 1–19. https://doi.org/10.1186/s40066-021-00305-w
- Ambaye, T. K., Tsehay, A. S., & Hailu, A. G. (2021). Analysis of the status and determinants of rural households’ access to agricultural extension services: the case ff jimma geneti woreda, oromia regional state, ethiopia. International Journal of Agricultural Extension and Rural Development Studies, 8(1), 52–99. https://ssrn.com/abstract=3820302
- Asfir, S. S. (2016). Determinants of Rural Households Livelihood Strategies: Evidence from Western Ethiopia. Journal of Economics & Sustainable Development, 7(15), 103–109. www.iiste.org
- Asmah, E. E. (2011). Rural livelihood diversification and agricultural household welfare in Ghana. Journal of Development and Agricultural Economics, 3(7), 325–334. http://www.academicjournals.org/JDAE
- Ayana, G. F., Megento, T. L., & Kussa, F. G. (2022). The extent of livelihood diversification on the determinants of livelihood diversification in Assosa Wereda, western Ethiopia. GeoJournal, 87(4), 2525–2549. https://doi.org/10.1007/s10708-021-10379-5
- Babalola, K., & Aduba, J. J. (2014). Factors influencing adoption of chemical weeding among farmers in North Central Nigeria ; a case study of farmers in Idofian, Ifelodun local Government area, Kwara state. Global Journal of Current Research, 3(1), 28–35. https://shorturl.at/bdBSX
- Barrett, C. B., Reardon, T., & Webb, P. (2001). Nonfarm income diversification and household livelihood strategies in rural Africa: Concepts, dynamics, and policy implications. Food Policy, 26(12), 315–331. https://doi.org/10.1016/S0306-9192(01)00014-8
- Bazezew, A., Bewket, W., & Nicolau, M. (2013). Rural households’ livelihood assets, strategies and outcomes in drought-prone areas of the Amhara Region, Ethiopia: Case study in Lay Gaint District. African Journal of Agricultural Research, 8(46), 5716–5727. https://doi.org/10.5897/AJAR2013.7747
- Burns, T., & Roszkowska, E. (2016, April). Rational choice theory: Toward a psychological, social, and material contextualization of human choice behavior. Theoretical Economics Letters, 06(02), 195–207. https://doi.org/10.4236/tel.2016.62022
- Central Statistical Agency. (2013). Population Projection of Ethiopia for all Regions at Wereda level from 2014 – 2017. Journal of Ethnobiology and Ethnomedicine, 3(1), 28. http://www.csa.gov.et/images/general/news/pop_pro_wer_2014-2017_final
- Danyi, E., & Angnayeli, J. (2015). Land use Policy Customary land allocation, urbanization and land use planning in Ghana: Implications for food systems in the Wa municipality. Land Use Policy, 48, 454–466. https://doi.org/10.1016/j.landusepol.2015.06.030
- DFID (Department for International Development). (1999). Sustainable livelihoods guidance sheets. http://www.eldis.org/vfile/upload/1/document/0901/section2.pdf.
- Ellis, F. (1998). The journal of Development Studies household strategies and rural livelihood diversification household strategies and rural livelihood diversification. The Journal of Development Studies, 35(1), 1–38. https://doi.org/10.1080/00220389808422553
- Ellis, F. (2000). The determinants of rural livelihood diversification in developing countries. Journal of Agricultural Economics, 51(2), 289–302. https://doi.org/10.1111/j.1477-9552.2000.tb01229.x
- Ellis, F., and Allison, E. (2004). Access to natural resources sub-Programme livelihoods diversification and Enterprise Development sub-programme livelihood diversification and natural resource access livelihood support Programme (LSP) an inter-departmental programme for improving support. Livelihood Support Programme (LSP) Working Paper 9.
- Gebru, G. W., Ichoku, H. E., & Phil-Eze, P. O. (2018a). Determinants of livelihood diversification strategies in Eastern Tigray Region of Ethiopia. Agriculture & Food Security, 7(1). https://doi.org/10.1186/s40066-018-0214-0
- Gebru, G. W., Ichoku, H. E., & Phil-Eze, P. O. (2018b). Determinants of livelihood diversification strategies in Eastern Tigray Region of Ethiopia. Agriculture & Food Security, 7(1), 1–9. https://doi.org/10.1186/s40066-018-0214-0
- Gemeda, F. T., Guta, D. D., Wakjira, F. S., & Gebresenbet, G. (2023). Land acquisition, compensation, and expropriation practices in the Sabata town, Ethiopia. European Journal of Sustainable Development Research, 7(2), em0212. https://doi.org/10.29333/ejosdr/12826
- Greene, W. H. (2000). Econometric analysis (4th ed.). Pearson.
- Kanza, P., & Vitale, J. (2015). Agriculture in developing countries and the role of Government: Economic Perspectives. Agricultural and Applied Economics Association and Western Agricultural Economics Association Annual Meeting 2015, July 26-28, San Francisco, California.
- Kassie, G. W. (2018). Agroforestry and farm income diversification: Synergy or trade-off? The case of Ethiopia. Environmental Systems Research, 6(1). https://doi.org/10.1186/s40068-017-0085-6
- Khatun, D., & Roy, B. C. (2011). This document is discoverable and free to researchers across the globe due to the work of AgEcon Search. Help ensure our sustainability. Journal of Gender, Agriculture & Food Security, 1(3), 1–22.
- Kothari, C. R. (2004). Research methodology: Methods and techniques (2nd ed.). New Age International Publishers. In ثبثبثب: Vol. ث ققثق (Issue ثق ثقثقثق).
- Larsen, A. F., & Lilleør, H. B. (2014). Beyond the field: The impact of Farmer field schools on food security and poverty alleviation. World Development, 64, 843–859. https://doi.org/10.1016/j.worlddev.2014.07.003
- Mezgebo, T., & Shaughnessy, M. O. (2014). Growth, peri-urbanization and income diversification: Evidence from peri-urban Tigray, Northern Ethiopia. IGA Economies and Somalia Federalism, 30. cega.berkeley.edu
- Mota, A. A., Lachore, S. T., & Handiso, Y. H. (2019). Assessment of food insecurity and its determinants in the rural households in Damot Gale Woreda, Wolaita zone, southern Ethiopia. Agriculture & Food Security, 8(1), 1–11. https://doi.org/10.1186/s40066-019-0254-0
- Perkins, D. D., & Zimmerman, M. A. (1995). Empowerment TheoIT, research, and Application. American Journal of Community Psychology, 23(5), 569–579. https://doi.org/10.1007/BF02506982
- Pigg, K. E. (2002). Three faces of empowerment: Expanding the theory of empowerment in community development. Journal of the Community Development Society, 33(1), 37–41. https://doi.org/10.1080/15575330209490145
- Sato, H., & Royset, J. O. (2010, February). Path optimization for the resource-constrained searcher. Naval Research Logistics, NA–NA. https://doi.org/10.1002/nav.20411
- Scoones, I. (2009). Livelihoods perspectives and rural development. The Journal of Peasant Studies, 36(1), 171–196. https://doi.org/10.1080/03066150902820503
- Shikur, Z. H. (2020). Agricultural policies, agricultural production and rural households’ welfare in Ethiopia. Journal of Economic Structures, 9(1). https://doi.org/10.1186/s40008-020-00228-y
- Tassie Wegedie, K., & Duan, X. (2018). Determinants of peri-urban households’ livelihood strategy choices: An empirical study of Bahir Dar city, Ethiopia. Cogent Social Sciences, 4(1), 1562508. https://doi.org/10.1080/23311886.2018.1562508
- Tizazu, M. A., Ayele, G. M., & Ogato, G. S. (2018). Determinants of rural households livelihood diversification strategies in Kuarit District, West Gojjam Zone of, Amhara Region, Ethiopia. International Journal of Economic Behavior and Organization, 6(3), 61. https://doi.org/10.11648/j.ijebo.20180603.11
- Washo, J. A., Tolosa, S. F., & Debsu, J. K. (2021). African journal of agricultural research determinants of rural households’ livelihood diversification decision: The case of Didessa and Bedelle District, Bunno Bedelle Zone, Oromia regional state, Ethiopia. African Journal of Agricultural Research, 17(12), 1573–1580. https://doi.org/10.5897/AJAR2021.15771
- Winters, P., Essam, T., Zezza, A., Davis, B., & Carletto, C. (2010). Patterns of rural Development: A cross-country comparison using microeconomic data. Journal of Agricultural Economics, 61(3), 628–651. https://doi.org/10.1111/j.1477-9552.2010.00265.x
- World Bank. (2014) . Ethiopia : Second urban local Government development program as a program-for-results operation. Ulgdp Ii.
- Yizengaw B. (2014). Determinants of household income diversification and its effect on food security status in rural Ethiopia: Evidence from Ethiopia longitudinal rural household survey. MSc in Economic Policy Analysis.
- Yussuf, B. A., & Mohamed, A. A. (2022). Factors Influencing household livelihood diversification: The case of Kebri Dahar District, Korahey Zone of Somali Region, Ethiopia. Advances in Agriculture, 2022, 1–14. https://doi.org/10.1155/2022/7868248