
 ?Mathematical formulae have been encoded as MathML and are displayed in this HTML version using MathJax in order to improve their display. Uncheck the box to turn MathJax off. This feature requires Javascript. Click on a formula to zoom.
Abstract
Even if agriculture is the dominant livelihood base for most Ethiopians, currently the sector is facing many challenges. Hence, rural households are compelled to develop livelihood diversification strategies to cope with the increasing vulnerability associated with agricultural production. The current study therefore assessed the wellbeing, productivity and food security effects of multiple livelihood diversifications on smallholder farmers of kaffa zone, Ethiopia. To do so, econometric tools, such as multinomial logit and multinomial endogenous switching regression model were used to assess factors that affect rural households’ livelihood diversification choice and to evaluate their impact on various welfare indicators, respectively. The findings show that isolated participation in non-farm livelihood diversification results in a significant effect on smallholder farmers’ wellbeing and productivity, but it does not have a significant effect on food security. Furthermore, joint participation in both diversification strategies results in a significant effect on smallholder farmers’ productivity and food security, but it does not have a significant effect on wellbeing. The only livelihood diversification package that has a significant effect on wellbeing, productivity, and food security simultaneously is the first combination, that is, lone participation in off-farm diversification. Thus, to maintain the wellbeing, productivity, and food security of smallholder farmers simultaneously, the study recommends concentrating on off-farm livelihood diversification portfolios rather than the other combinations. Therefore, policymakers and rural finance programs should shift their focus and place a greater emphasis in incentivizing smallholder farmers to invest in diversification strategies that can boost wellbeing, productivity and food security simultaneously, which is off-farm diversification.
PUBLIC INTEREST STATEMENT
Ethiopian agricultural sector is currently facing many challenges such as unexpected shock like drought and flooding, reduction in output mainly due to soil nutrient degradation and lack of capital to use improved agricultural technologies. Thus, the likelihood of reducing poverty and food insecurity only by farming and redressing the issues of access to key agricultural technologies without off/non-farm income diversification could not be successful. Hence, livelihood expansion, which aims to reduce the threat allied with agricultural production and supplement farm income, is highly needed. This study therefore presents the assessment results of the welfare and nutrition security impacts of various livelihood diversification strategies and their determining factors.
1. Introduction
Even though Ethiopia’s economy is based primarily on agriculture, majority of the nations are net cereal buyers because their agricultural production is thought to be extremely poor for a variety of reasons (Emebet & Samuel, Citation2022; Ketema & Kebede, Citation2017). The primary causes of the nation’s low agricultural productivity, which in turn fosters extreme poverty and food insecurity are climate change and variability, traditional farming methods that do not employ new agricultural technologies, and low adoption rate of new technologies because of a lack of capital (Merga & Haji, Citation2019; Wordofa et al., Citation2021). The nation has experienced droughts for a long time, and the incidence of these extreme weather occurrences is rising (Bekele et al., Citation2020). This suggests that enhancing rural households’ quality of life by reducing poverty and food insecurity cannot be achieved just through the agricultural sector alone. Thus, in order to sustainably maintain rural households livelihood, proper interventions are urgently needed to address the problems, raise productivity, and enhance resilience (Zerssa et al., Citation2021).
To increase agricultural output through the use of new technologies like improved varieties, fertilizer, and so forth, it is necessary to diversify sources of income. As a result, to increase the resilience against food shortages and poverty brought by unforeseen events, farm households are driven to diversify their assets and sources of income (Debele & Desta, Citation2016). Expanding livelihoods is therefore essential to supplement farm revenue and lessen the risks associated with agricultural production (Emebet & Samuel, Citation2022). Hence, diversifying sources of income is becoming more and more common strategy for mitigating the effects of economic shocks and reducing susceptibility (Admasu et al., Citation2022; Helmy, Citation2020). Diversification of income sources is necessary to balance revenue and consumption in developing nations like Ethiopia, where agriculture is vulnerable to climate shocks. Instead of relying exclusively on farming to improve wellbeing, households are seeking a variety of livelihood diversification options, with livelihood diversification becoming more and more important to family income (Admasu et al., Citation2022).
Providing sustainable livelihood outcomes, such as economic, social, and environmental development, for both farming and non-farming households is the ultimate goal of livelihood diversification (Tambe, Citation2022). Despite the fact that diversifying household livelihoods is essential to both rural and urban development, the government usually neglect its significance (Getinet & Lorato, Citation2020). Hence, the majorities of rural households still rely on farming, and most are unaware about the benefits of diversifying their sources of income. Therefore, it was thought that one way to diversify income sources for rural households would be to raise awareness among them and lower their dependency ratio by encouraging dependent or unemployed family members to engage in various off/non-farm activities (Emeru et al., Citation2022). However, raising awareness among rural households is a challenging task that calls for further study and/or assistance from the government.
As a livelihood strategy, diversification depends on a number of interrelated factors, such as the context factors that households face (like vulnerability to shocks), the various forms of capital that the households use to generate their livelihood, and institutional and governmental factors like poor infrastructure (Musumba et al., Citation2022). Thus, it is imperative to create a comprehensive urban development policy along with better infrastructure, like roads, to connect rural and urban households. This could promote off-farm and non-farm livelihood diversification approaches in addition to agriculture (Emeru et al., Citation2022). Literatures showed mixed results, in certain regions of the country, livelihood diversification were shown to have a significant positive impact on the food security and well-being of rural households, while in other regions there was a significant negative impact. As a result, contradictory findings were discovered in Ethiopian circumstances, which is insufficient to examine how livelihood diversification strategies affect the wellbeing and food security of rural farming households.
In Ethiopia, particularly in the study area, rural households’ livelihood diversification is unusual, and only few studies have assessed livelihood diversification, with a focus on the significance, determinants and impacts of single livelihood diversification (either non-farm or off-farm) on various welfare indicators (e.g., Akrasi et al., Citation2020; Ayana et al., Citation2021; Dinku, Citation2018; Duguma et al., Citation2023; Emeru et al., Citation2022; Washo et al., Citation2021). However, comparisons of the impact of multiple livelihood diversification strategies on various outcomes have been neglected. This means that studies that assessed the impact of multiple livelihood diversification strategies (LDSs), that is, the impact of participating in at least one off-farm LDSs alone, at least one non-farm LDSs only, and joint participation in both strategies simultaneously, have not yet been conducted in the study area. Thus, it is a decisive and critical issue that should be studied to contribute to the policies and strategies that help to improve the livelihood of rural households, thereby to combat poverty and food insecurity in Ethiopia in general and in Southwest region in particular.
2. Literature Review
It is commonly known that families in sub-Saharan Africa (SSA) want to diversify their sources of income and livelihood strategies in order to control or lower their risks as well as to increase or capitalize on synergies between various sources of income (Barrett et al., Citation2001). The scholarly research generally agrees that increased non-farm employment and livelihood diversification are generally beneficial for people as well as overall economic growth in sub-Saharan Africa. Thus, it should come as no surprise that a large number of development strategies and initiatives aim to create development interventions that would more effectively support livelihood diversification.
While the potential benefits of diversification efforts are widely acknowledged, a major issue for development programming has been widely recognized to be the difficulties in providing more disadvantaged populations with access to and effective uptake of less or non-climate dependent livelihood opportunities. This is because these populations frequently lack the social networks, education, skills, and financial resources necessary for these opportunities to be successful (Davis et al., Citation2010). Effectively fostering agricultural transformation is a comparable problem, to which the literature likewise points to more knowledge gaps than definitive solutions. Last but not least, a further unsolved major programming challenge focuses on how to more successfully grow common elements of the agricultural and non-agricultural sectors together, given the interconnections between agricultural and non-farm activities in many rural economies in SSA, including Ethiopia (Davis et al., Citation2010).
Based on the reviewed literatures, there is also ample evidence showing that certain human traits, together with a constellation of place-based background factors, make it easier for certain households and individuals than others to diversify their sources of income beyond subsistence farming. Among these, experience, financial capital, awareness, literacy, numeracy, and social/professional networks are crucial. For example, a large body of research indicates that the ability to benefit from increased incomes and livelihood options that are not dependent on climate change is contingent upon one’s initial level of wealth.
According to the study of Mohammed et al. (Citation2021), it is acknowledged that livelihood diversification can increase smallholder agricultural systems’ resistance to climate change by spreading risk. According to the research, smallholder farming households who used only farm diversification or a combination of farm and nonfarm diversification were much more likely than those who used no diversification strategy to report being more resilient to climate change. The literature made clear the necessity of agricultural policies that support nonfarm and on-farm livelihoods as supplementary means of diversifying risk. More precisely, the details and fine points of this swift review were delivered below.
The impact of livelihood diversification on poverty in the Jimma zone of Ethiopia was evaluated by Abebe et al. (Citation2021). The findings showed that a household’s family size, off-farm income, landholding, livestock holding, education level, and credit access had a substantial impact on livelihood diversification. Additionally, it is indicated that households’ engagement in livelihood diversification significantly and favorably reduces household poverty. In terms of poverty, it was shown that households having a variety of sources of income were 9% better off than those without. The study finally pointed the need of policies that enhance the household’s capacity to generate revenue by giving a careful thought.
Endiris et al. (Citation2021) determined the food security effects of off-farm diversification in the Dibatie district of Ethiopia. As the study showed, in comparison to their counterfactuals, households with off-farm participants had greater chances of being food secured. It is further indicated that a number of factors were found to have a significant effect on off-farm participation, including, proximity to the closest market, household size, age of the household head, education level, credit service, extension contact, and access to electricity.
Afodu et al. (Citation2020) investigated the effect of livelihood diversification and technology adoption on food security status of rice farming households in the Ogun State, Nigeria. The study indicated that the main factors that affect food security of the rice farmers were livelihood diversification and technology adoption. Furthermore, household size, educational level of the household head, access to credit and farm size are also among the factors that affect food security of the household significantly.
The study of Echebiri et al. (Citation2017) examined rural farm households in Abia state, Nigeria that used livelihood diversification as a survival tactic and a way out of food insecurity. The results of the logit regression indicated that monthly income, cooperative membership, household head education, size of the family, and quantity of credit obtained all had an impact on diversification. In order to increase revenue and halt the cycle of poverty and destitution, the research advised encouraging rural farmers to engage in a variety of money-generating activities in both agricultural and nonagricultural endeavors. The study also showed that offering low-interest soft loans will encourage participation in non-farm income-generating ventures.
3. Methodology
3.1. Study Area, Data, and Sample Size Determination
Both qualitative and quantitative data that are obtained from primary and secondary sources are used in this study. Structured questionnaires were utilized to gather primary data for the descriptive and empirical analyses, while secondary data were mostly gathered from regional agricultural bureaus to support the study. The quantitative data obtained through household questionnaire were administered between 12 February 2023 and 5 March of the same year. Prior to conducting the main survey, the interview schedule was pretested to avoid errors. To obtain relevant data that were pertinent and essential for the present study, knowledgeable and experienced enumerators were selected, trained, and recruited. To draw relevant and representative sample respondents for the study, multistage sampling techniques were followed with both random and non-random sampling. In the first stage, the Kaffa zone was purposively selected from the southwestern region of Ethiopia based on the need for livelihood diversification and the preliminarily stated problems. The Gimbo District was also purposively selected. This was followed by random selection of four studies Kebele’s: Hamani, Tephibuti, Choba, and Gojeb. Finally, 419 representative households were randomly selected, using a probability proportional to the size of each Kebele.
3.2. Measurements of Wellbeing, Productivity and Food Security
Among the various measures of wellbeing, the consumption expenditure approach was used for this study because, in less developed countries, a household’s income is hard to quantify given that a large portion of it comes from self-employment, but consumption is relatively less erratic and easier to quantify. In addition, household income statistics are likely to be understated when compared to consumption expenditures because they are frightened of being taxed (Getahun & Villanger, Citation2015). Thus, households are more likely to declare their expenditures than their income. Taking into account the shortcomings of each metrics, the consumption expenditure approach was used to measure wellbeing. Respondents were questioned on their overall consumption spending on both food and non-food items in order to estimate household consumption expenditure. In this aspect, both purchased goods and those consumed from one’s own production are considered. Finally, the entire amount was adjusted on per adult equivalent basis.
Following the work of Dabessa Iticha et al. (Citation2021), net crop value (NCV) inquiry technique, which takes into account all input costs and other expenses necessary to produce maize was applied to measure maize productivity. Current market price and actual maize production data were collected and used to determine maize production revenue. This was followed by cost estimation based on market prices using a hectare of maize land as the measurement unit. Finally, all the entire costs incurred for the production of maize was deducted from the total revenues obtained from maize production to obtain the second outcome equation of the present study which is productivity measured in net crop value (NCV).
Daily calorie intake (DCI), which was utilized as an outcome variable, was used to measure household food security. The amount and types of food items consumed by each family over the previous 30 days were the first set of data gathered for this particular measure. The calorie content of each food item consumed was then determined using the calorie conversion factor developed by the World Food Program (World Food Program WFP, Citation2017).
3.3. Estimation Methods
Descriptive and econometric analyses were used to analyze quantitative data, depending on the purpose of the study. Therefore, for basic descriptive analysis, percentages, frequencies, and measures of central tendency are employed. Participation in both off-farm and non-farm livelihood diversification strategies leads to four possible combinations that the household could choose from in this empirical study: (i) non-diversification, (ii) off-farm diversification alone, (iii) non-farm diversification only, and (iv) joint diversification. Consequently, factors influencing households’ selection of each package of diversification strategies are identified, and their average treatment effects on the outcome variables are estimated, using econometric tools that take into account multiple outcomes, such as the multinomial endogenous switching regression (MESR) model. The detailed explanation, justification, and specification of the econometric models applied are discussed in the following subsections.
3.3.1. Multinomial Endogenous Switching Regression
A multinomial endogenous switching regression (MESR) approach was chosen for this study since it captures both self-selection bias and the interactions between choices of alternative packages. This is because farmers’ decisions to diversify or not diversify are likely to be influenced by unobservable characteristics that may be correlated with the outcomes of interest (Biru et al., Citation2020; Ding & Abdulai, Citation2020; Tesfay, Citation2020). Additionally, the aforementioned model was selected due to its ability to take into consideration a number of difficulties that arise when estimating impact evaluations, including the endogeneity, selectivity bias, and counterfactuals problems. Thus, following Danso-Abbeam and Baiyegunhi (Citation2018) and Kumar et al. (Citation2019), it is assumed that farmer i aims to maximize his/her net returns, Ui, by comparing the returns from different choices of livelihood diversification combination J (J = 1,2,3,4) over any alternative strategy, m. Household i decides to choose any package J, over any other alternative package m if . This implies that households will participate in the given livelihood diversification strategy if the utility of the chosen combination is higher than that of other alternative packages. However, based on Biru et al. (Citation2020), Ding and Abdulai (Citation2020), Belay and Mengiste (Citation2021), Ahmed (Citation2022a), and Oduniyi et al. (Citation2022), the expected utility
that the household derives from participation in livelihood diversification package J can be specified as:
- is a latent variable defining the expected net benefits that the household derives from the livelihood diversification combination choice J, which is determined by both observed and unobserved characteristics. Xi represents a vector of observed exogenous or covariate variables and εik is an error term that accounts for unobserved characteristics. Let D represent the index of households’ choices among the given alternative combinations of livelihood diversification strategies such that D can be given as
In Equationequation (2)(2)
(2) , the index function suggests that the ith household will participate in livelihood diversification strategy J if they derive or expect a better advantage or net earnings from package J than any other package
. As shown in Table , the base category, which is a non-diversifier of any of the given livelihood diversification strategies (OLD0NLD0), is represented by D = 1 (Regime 1), while the remaining alternative combinations are represented by D = 2, 3, 4 … J indicating diversification using at least one combination of the given strategies. The relationship between the outcome variables and the set of exogenous variables H, for each possible regime is specified as follows:
Table 1. Livelihood diversification combinations and distribution of sample household heads based on their diversification status
Whereare the outcome variables that represent wellbeing (annual consumption expenditure), maize productivity (NCV), or food security (daily calorie intake) of the ith household at different diversification combinations D (D = 1, 2, 3 … J), and u’s are error terms. If the
in Equationequation (1)
(1)
(1) and u’s in Equationequation (3)
(3)
(3) are not independent, the estimation of Equationequation (3)
(3)
(3) using linear regression, that is, ordinary least squares (OLS), will be biased. Hence, a consistent estimation of
requires inclusion of the selection terms of the alternatives in Equationequation (3)
(3)
(3) . This can be solved using the following linearity assumption of Dubin and McFadden’s (Citation1984) model:
Following this assumption, the multinomial endogenous switching regression model equation is specified as:
Where is the covariance between the error terms
in Equationequation (1)
(1)
(1) and u in Equationequation (3)
(3)
(3) ,
’s are the error terms with a zero expected value, and
is the inverse Mills ratio derived from the estimated probabilities in Equationequation (2)
(2)
(2) , which is computed as:
Where-is the correlation coefficient of the three error terms such as
, u’s and ω’s. Even if the regressors in the selection and outcome equations are similar, the parameters of a multinomial endogenous switching regression (MESR) model can generally be identified through the nonlinear functional form of the selection model (Biru et al., Citation2020; Ding & Abdulai, Citation2020; Tesfay, Citation2020). As indicated by Chamberlain and Griliches (Citation1975), a system of equations does not necessarily require instrumental variables for identification. Hence, it is not strictly necessary to include an instrument in the selection equation to identify the parameters of a multinomial treatment effect model. Nevertheless, for the sake of having consistent estimates of the parameters, Tesfay (Citation2020), Biru et al. (Citation2020), Ding and Abdulai (Citation2020), Ahmed (Citation2022a), and Oduniyi et al. (Citation2022) suggested the significance of including selection instruments in the alternative choice model, which is specified in Equationequation (3)
(3)
(3) . According to Kassie et al. (Citation2018), Asmare et al. (Citation2019), and Tesfaye et al. (Citation2021), the exclusion restriction test is recommended for the switching regression model to be adequately identified. This test is accompanied by excluding variables that directly affect the participation equation but not the outcome equation. Thus, following the work of Khonje et al. (Citation2018) and Ahmed (Citation2022b) distance from home to the nearest market and slope of the land were included as selection instrument by approving them through falsification test. The test results show that the identified instruments are jointly significant in determining the participation equation but not significant in explaining the outcome equation. This is because the variables are less likely to have any direct effect on wellbeing, productivity and food security, except through livelihood diversification.
3.3.2. Estimation of Average Treatment Effects
Following the frameworks of MESR model stated above, the treatment effect can be computed for both average treatment effects on the treated (ATTFootnote2) and untreated (ATUFootnote3) groups. This was done by comparing the expected outcome values of the treated (D = 2, 3, 4, … J) and untreated (D = 1) in actual and counterfactual scenarios. Consequently, by equating the expected outcomes of diversifiers with and without diversification from the above framework and following the work of Tesfay (Citation2020), Biru et al. (Citation2020), Ding and Abdulai (Citation2020), Belay and Mengiste (Citation2021), Ahmed (Citation2022a), Oduniyi et al. (Citation2022), and Zegeye et al. (Citation2022), the average treatment effect on treated (ATT) and untreated (ATU) can be specified as follows:
Diversifiers with diversification of D combination (actual expectations observed in the sample):
Diversifiers had they decided not to diversify (counterfactual expectations that are not detected):
Then the average treatment on the treated (ATT) is computed as the difference between (7a) and (8a). For instance, the difference between the first equations in (7a) and (8a) is used to estimate the ATT for those diversifiers of the second combination of the given diversification strategy, that is, D = 2, and it is equated as:
Similarly, the average treatment effect on the untreated (ATU) is the difference between equations (7b) and (Equation8b(7b)
(7b) ). For instance, the difference between the first equations in (7b) and (8b) is used to compute the ATU for non-diversifiers of the second combination of the given diversification strategies, and it is equated as
4. Result and Discussion
4.1. Statistical Result
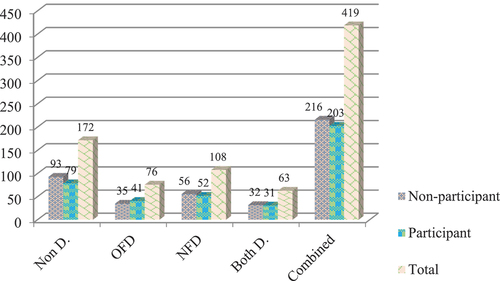
Of the entire 419 sample households surveyed, 366 (87.35%) were male while the rest were female (Figure ). Out of those 366 male headed households, the lion share in livelihood diversification status is pioneered by those households who do not participate in any livelihood diversification strategy. Likewise, the least female participation is observed in off-farm livelihood diversification combination (OLD1NLD0). Only 6 (7.89%) female participation is observed among the lonely participants of off-farm livelihood diversification, which is the least when compared to the other group of livelihood diversification combinations. From 76 off-farm participant households, 35 (46.05%) were non-irrigator whereas 56 (51.85%) were non-irrigator from the whole 108 non-farm participant households (Figure ). Surprisingly, from the whole 63 joint diversifier households, almost the same proportions were found to be irrigator (31) and non-irrigator (32).
Figure 1. Sex distribution of the sampled households.
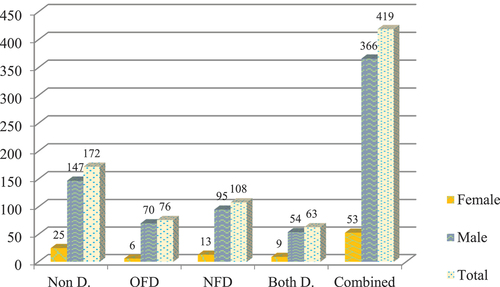
Figure 2. Status of sampled households’ irrigation participation.
As it can be seen from Table , the lowest and highest extremes in terms of land size that the household owned is observed in participants of off-farm livelihood diversification alone (OLD1NLD0) and joint diversifiers (OLD1NLD1), respectively. Compared to the other groups of livelihood diversification combinations, the mean percentile of improved seed users was higher in those participants in off-farm livelihood diversification alone and it was lowest in non-farm livelihood diversifiers alone (OLD0NLD1). Furthermore, the highest mean average credit received was by those households that did not participate in any livelihood diversification strategies with a mean credit of 2162 ETB, whereas the joint diversifiers were found to be the lowest credit users with a mean credit of 381 ETB.
Among the non-diversifiers of any of the given groups of diversification combinations, 20% of them do have steep sloped land, while 39% of those diversifiers with non-farm activities alone have highly sloppy (steep) land (Table ). Moreover, those households who were non-participants in any livelihood diversification strategy (OLD0NLD0) do have a more social position and encounter a minimal problem of insect, pest, and disease occurrence than the other group of diversifiers.
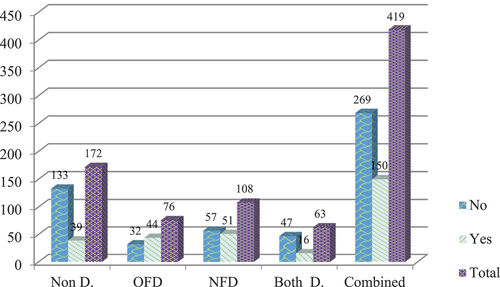
Households that participated in off-farm livelihood diversification alone were found to have the highest family size when measured in adult equivalents, and comparatively more (59%) encountered problems of insects, pests, and disease occurrence (Table ). From the entire 172 households who do not participate in any livelihood diversification strategy, only 9 (5.23%) were encountered with a problem of different insects, pests and disease (Figure ). This reveals that, households who do not encounter with a problem of insect, pest and disease are mostly non-diversifiers.
Figure 3. Various insects, pests and disease occurrence.
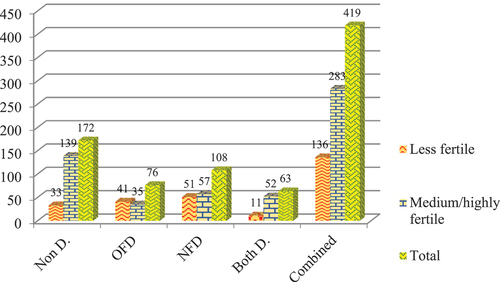
Spouses of joint livelihood diversifier household heads were found to be the least educated, with a mean education level of less than one years of schooling (Table ). As compared to those joint diversifiers and non-diversifiers, household heads’ who diversify his/her income sources from off-farm or non-farm activities alone were found to be the least in having fertile and own land. As the results show, 46% and 54% of off-farm diversifiers have fertile and own land, respectively. Likewise, 53% and 57% of non-farm livelihood diversifiers have fertile and own land, respectively. Moreover, 139 (80.81%) non-diversifier households were found to have medium or highly fertile land which is the highest when compared to the other diversification combinations (Figure ). Similarly, only 35 (46.05%) and 57 (52.78%) participants in off-farm and non-farm diversification strategies were found to have medium or highly fertile land, respectively. This depicts that households who have medium or highly fertile land concentrates on their-own farming rather than participating in other off/non-farm livelihood diversifications.
Figure 4. Plot fertility of the sampled households.
4.2. Factors Affecting the Choice of Livelihood Diversification Package/s
Smallholder farmers’ participation in the livelihood diversification strategy was hampered by a number of factors, despite the fact that it is the most effective strategy for them to adapt to climate change and variability while also promoting wellbeing and food/nutrition security through the additional income generated. Therefore, this study presents and discusses the significant factors constraining smallholder farmers’ participation in livelihood diversification in this section, using Table as the basis for the discussion. Among them, sex of the household head is the one that positively affects lonely participation in off-farm livelihood diversification only (OLD1NLD0). Among them, the sex of the household head is the one that positively affects lonely participation in off-farm livelihood diversification only (OLD1NLD0). This is because most of the time off-farm activity needs to devote the whole day to it; thus, it is more compatible with males than females. Further, a more credible justification is that women are traditionally allocated to domestic tasks and even have limited access to critical resources, such as cash, which often abates their capability to carry out such risky and exhausting tasks. This result was consistent with the findings of Akrasi et al. (Citation2020). Unexpectedly, the regression coefficient sign for the variable “age of the household head” for joint livelihood diversification (OLD1NLD1) was positive. This is due to the fact that the head of the household will become less involved in labor-intensive activities like farming as they become older, which would hence increase their joint diversification. The particular outcome of the present investigation aligns with the conclusions drawn by Washo et al. (Citation2021) and Emeru et al. (Citation2022).
Table 2. Factors affecting livelihood diversification choice: MNL model result
Because it consistently shows a positive correlation and high level of significance for all groups of livelihood diversification combinations at the 1% significance level, the result for the variable “distance from nearest market to households’ residence” is quite surprising. One would normally anticipate an inverse association between a household’s home distance from the closest market and livelihood diversification, since most livelihood diversifications take place in urban areas. Even while it is feasible to diversify sources of income in rural locations as well, doing so requires having strong ties to the nearby markets in order to deal in different raw materials, some of which are available only in larger markets. As a result, households suited to remote areas might be encouraged to diversify their livelihoods rather than spiking on on-farm activities only. This finding is consistent with those of Dinku (Citation2018) and Emeru et al. (Citation2022).
The study revealed a negative correlation between lonely participation in off-farm livelihood diversification (OLD1NLD0) and the two rural wealth indicator variables, namely land size and livestock ownership, as measured in tropical livestock units (TLU). The associated reason is that when the household is wealthy and owns more of these resources, they might not get free time to invest in other tasks like off-farm activities. Furthermore, as the households’ livestock herd size increases, they are obliged to search for water and forage for their livestock; thus, they are going to stick on managing their own farm land in general and their livestock resources in particular rather than seeking any other alternative income-generating activities. A similar finding was reported by Duguma et al. (Citation2023), whereas Washo et al. (Citation2021) reported contradicting results. Among the hypothesized and estimated institutional variables, credit access discourages households from participating in non-farm livelihood diversification alone (OLD0NLD1) and joint diversification (OLD1NLD1). This means that households who obtain more credit participate less in both non-farm livelihood diversification (OLD0NLD1) and joint diversification (OLD1NLD1), which is unsurprising. This can be justified because most of the time, rural households’ livelihood diversification is used to supplement farm income to contest financial constraints that smallholder farmers face during the off season; thus, as households obtain supplementary finance in the form of credit, the likelihood of participating in these activities will be less. However, the public notion that non-constrained households, in terms of credit access, would find it easier to diversify their livelihoods (such as participation in petty trade as an example) using the cash they obtained through credit cannot be confirmed. This is consistent with Dinku (Citation2018) and contradicts the findings of Washo et al. (Citation2021), Emeru et al. (Citation2022), and Duguma et al. (Citation2023).
Having a social position and being distant from the main road negatively affected all groups of livelihood diversification combinations. Therefore, being suited to a distant area from the main road and having a social position reduces the likelihood of participating in all of the given “income diversifications”Footnote4 alone and their joint diversification. Contrary to the present results, mixed outcomes (negative for non-farm and positive for off-farm) were observed in the existing study for the sign of the variable “home distance from main road” (Duguma et al., Citation2023). Plot fertility is an additional negative predictor of isolated diversification even if it does not affect joint diversification. This is because having fertile land stimulates rural households to concentrate on farming rather than seeking other income-generating activities. The estimation result for the variable “plot ownership” is distinguished as compared to the other variables presented due to having disparity in the sign/direction of influence among various groups of diversification combinations. Having a plot of land negatively determines the dependent variables, such as isolated participation in off-farm and non-farm diversification strategies (OLD1NLD0 and OLD0NLD1), whereas its effect turns out to be positive for joint diversification. Consequently, owning a plot of land will make it less likely that you will engage in an isolated diversification approach; on the other hand, it will make it more likely that you will engage in a joint diversification strategy.
Furthermore, it was discovered that living far from the plot and having a larger family size as measured in adult equivalents had opposite effects on off-farm livelihood diversification alone (OLD1NLD0). It was discovered that the estimated sign for family size agreed with Washo et al. (Citation2021) and Emeru et al. (Citation2022). As the model results presented in the same table reveal, having steeply sloped land positively affects all groups of livelihood diversification combinations with various levels of significance. Similarly, another favorable predictor of isolated diversification (OLD1NLD0 and OLD0NLD1) was the presence of insects, pests, and diseases; however, this predictor was not significant for joint diversification. This is because the household will be encouraged to engage in supplemental income-generating activities due to low productivity resulting from steep land that is unsuitable for farming and being hindered by the presence of various insects, pests, and disease.
4.3. The Effects of Livelihood Diversification on Wellbeing, Productivity and Food Security
The second stage of the multinomial endogenous switching regression model (MESRM) estimated the determinants of wellbeing (Table ), food security (Table ), and maize productivity (Table ) by livelihood diversification category after determining the factors that impede segregate and joint diversification of the two off-farm and non-farm livelihood diversification strategies in the first stage of the model. Then after, the effects of participating in the specified diversification packages are estimated using the anticipated wellbeing, maize productivity, and food security from the ESR model. Table displays the switching regression techniques’ estimated average treatment impacts on treated (ATT) results. The genuine (conditional) average participation impacts on households that engage in at least one livelihood diversification approach are indicated by the figures given in the table. The comparison between the outcome variables and their corresponding counterfactuals establishes the estimation method. The study found that households that practice isolated livelihood diversification afford higher consumption expenditures than joint diversifiers. This means that participation in the OLD1NLD0 and OLD0NLD1 packages has a positive and significant effect on smallholder farmers’ wellbeing, with the highest wellbeing advantage from OLD1NLD0 combination. Therefore, from the standpoint of wellbeing, the most appealing package of livelihood diversification that farmers could implement as an ex-ante strategy to augment households’ income and consumption in times of agricultural production failure appears to be lonely participation in off-farm livelihood diversification (OLD1NLD0).
Table 3. Average treatment effect estimates of the given LDSs: MESR model result
As the results presented in Table show that all combinations of off-farm and non-farm livelihood diversification were found to have a substantial effect on maize productivity. However, the highest productivity gain was observed when the household participate in off-farm diversification alone (OLD1NLD0). The result further reveals that lonely participation in non-farm livelihood diversification comparatively results in the least productivity gain. This is to mean, lonely participation in non-farm diversification results in the lowest productivity gain when compared to other diversification combinations of the given portfolios. This is because of the strategy (diversification portfolio) being unrelated with farming. Consequently, those households who participate in non-farm livelihood diversification are not going to concentrate on their agricultural production, compared to the other household groups.
The value reported in the same table further indicates the true (conditional) average livelihood diversification effects on food security of households that had participated in at least one diversification. Lonely participation in off-farm diversification combination and joint diversification results in the highest and significant food security gain (295 and 191 kilo calorie, respectively). This is to mean, food security of the household who participate in OLD1NLD0 and OLD1NLD1 would have decreased by 295 and 191 kilo calorie, respectively, if they had not diversified their livelihood. The lowest and insignificant food security gain is realized by those lonely participants in non-farm diversification strategy.
In conclusion, isolated participation in the OLD0NLD1 package results in a significant effect on smallholder farmers’ wellbeing and productivity but, it does not have a significant effect on food security. This is because higher expenditure on both food and non-food items (having improved wellbeing) and higher productivity does not literally mean food secured. Rural households might boost their food security mainly through off-farm and “on-farm livelihood diversification”Footnote5 than non-farm diversifications. Furthermore, joint participation in the OLD1NLD1 package results in a significant effect on smallholder farmers’ productivity and food security, but it does not have a significant effect on wellbeing. The only livelihood diversification package that have a significant effect on wellbeing, productivity, and food security simultaneously is the first combination, that is, OLD1NLD0. Thus, to maintain the wellbeing, productivity, and food security of smallholder farmers simultaneously, the study recommends concentrating on off-farm livelihood diversification portfolios rather than non-farm and/or joint diversification.
5. Conclusion and Recommendations
Even if agriculture is the dominant base of livelihood for most of the Ethiopians, the sector currently faces many challenges, such as unexpected shocks like drought and flooding, reduction in output mainly due to soil nutrient degradation, and lack of capital to use improved agricultural technologies. Thus, its output is declining due to being subsistent and still traditional, leading households involved in the sector in to poverty and food insecurity. Hence, rural households are compelled to develop diversification strategies to cope with the increasing vulnerability associated with agricultural production. The current study therefore assessed the wellbeing, productivity and food security effects of multiple livelihood diversifications on smallholder farmers of kaffa zone, Ethiopia. To do so, econometric tools, such as multinomial logit and multinomial endogenous switching regression models were used to assess factors that affect rural households’ livelihood diversification choice and to evaluate their impact on various welfare indicators, respectively.
As the impact evaluation (ATT) result from multinomial endogenous switching regression model portrayed, isolated participation in non-farm livelihood diversification results in a significant effect on smallholder farmers’ wellbeing and productivity but it does not have a significant effect on food security. Furthermore, joint participation in both diversification strategies results in a significant effect on smallholder farmers’ productivity and food security, but it does not have a significant effect on wellbeing. The only livelihood diversification package that have a significant effect on wellbeing, productivity, and food security simultaneously is the first combination, that is, lonely participation in off-farm livelihood diversification. Thus, to maintain the wellbeing, productivity, and food security of smallholder farmers simultaneously, the study recommends concentrating on off-farm livelihood diversification portfolios rather than non-farm and/or joint diversification. Therefore, policymakers and rural finance programs should shift their focus and place a greater emphasis in incentivizing smallholder farmers to invest in diversification strategies that can boost wellbeing, productivity and food security simultaneously, which is off-farm diversification.
Variables like age and sex of the household head, distance to the closest market, size of the land, application of improved seed, slope of the land, size of the family in adult equivalent, social position, occurrence of insects, pests, and diseases, distance of the home from the main road, fertility of the plot, and plot ownership are highly significant determinants of different livelihood diversification combinations, as shown by the results of the multinomial logit model. Therefore, by focusing on these extremely important factors that influence diversification decisions, programs aimed at improving the wellbeing and food security of smallholder farmers should first improve their experience with livelihood diversification. The study is limited in considering the four combinations of livelihood portfolio using only off-farm and non-farm livelihood diversification strategies. Thus, the study recommends for further research that consider on-farm livelihood diversification as the third group of livelihood portfolio. Therefore, future research/es should assess the effect of multiple livelihood diversifications having eight combinations using the three groups of livelihood diversification strategies, namely, off-farm, non-farm, and on-farm diversifications.
Authors’ contribution
Kindineh Sisay: Conceived and designed the experiments, performed the experiments, analyzed and interpreted the data, contributed reagents, materials, analysis tools, or data, and wrote the paper. In general, except for the data collection tasks, support, and guidance, all the main contributions pertaining to this study were made by K.S. only.
AUTHOR BIO AND PUBLIC INTEREST STATEMENT.docx
Download MS Word (23 KB)Acknowledgments
The author gratefully acknowledges the contribution of sampled farmers and data collectors, who made tremendous efforts for the success of this research. The author also extends his special thanks to all agricultural experts of the district for their perpetual support by providing all the essential information, facilitating the data collection process, and providing all the vital secondary data.
Disclosure statement
The author declares that there was no any conflict of interest.
Supplementary material
Supplemental data for this article can be accessed online at https://doi.org/10.1080/23311886.2023.2282211
Additional information
Notes on contributors

Kindineh Sisay
Kindineh Sisay is a full-time lecturer and researcher in the School of Agricultural Economics and Agribusiness at Haramaya University, Ethiopia. He holds his MSc degree in Agricultural and Applied Economics from Haramaya University, Ethiopia and University of Pretoria, South Africa with exchange program (in country scholarship). He has taught several courses for Agricultural Economics and Agribusiness students, and supervised several undergraduate researches. He has also managed to publish several articles in articulated peer-reviewed journals, including those published by well-known brand publishers, such as Elsevier, Taylor & Francis, and Wiley. His areas of research include impact assessment, food and nutrition security, natural resource valuation, technology adoption, climate change, poverty, and productivity.
Notes
1. OLD0NLD0 shows an “empty set” whereby households participated in none of the given livelihood diversification strategies. This means that households do not participate in any livelihood diversification strategy among the various types of diversification strategies found in each diversification groups.
2. ATT is the difference in expected outcome of livelihood diversifiers when they decide not to diversify.
3. ATU is the difference in expected outcome of non-diversifiers of livelihood when they diversify.
4. Since the target of livelihood diversification is just to diversify income sources, livelihood diversification is interchangeably used with income diversification.
5. On-farm diversification is diversification of agricultural or income generating activities within the same farming but different from the main agricultural activity like engaging in various crop productions than a single or specific crop production. It is a promising strategy for farmers to adapt climate change while contributing to food and nutrition security.
References
- Abebe, T., Chalchisa, T., Eneyew, A., & Hasanuzzaman, M. (2021). The impact of rural livelihood diversification on household poverty: Evidence from Jimma zone, Oromia National regional State, Southwest Ethiopia. Scientific World Journal, 2021, 1–23. https://doi.org/10.1155/2021/3894610
- Admasu, T. T., Damtie, Y. A., & Taye, M. A. (2022). Determinants of livelihood diversification among households in the sub-Saharan town of Merawi, Ethiopia. Advances in Agriculture, 2022, 1–9. https://doi.org/10.1155/2022/6600178
- Admasu, T. T., Damtie, Y. A., Taye, M. A., & Vasa, L. (2022). Determinants of livelihood diversification among households in the sub-Saharan town of Merawi, Ethiopia. Advances in Agriculture, 2022, 1–9. https://doi.org/10.1155/2022/6600178
- Afodu, O. J., Afolake, A. C., & Lawrence, B. O. (2020). Effect of livelihood diversification and technology adoption on food security status of rice farming households in Ogun State. Nigeria. Agricultural Socio-Economics Journal, 20(3), 233–244. https://doi.org/10.21776/ub.agrise.2020.020.3.7
- Ahmed, M. H. (2022a). Impact of improved seed and inorganic fertilizer on maize yield and wellbeing: Evidence from eastern Ethiopia. Journal of Agriculture and Food Research, 7(2022), 100266. https://doi.org/10.1016/j.jafr.2021.100266
- Ahmed, M. H. (2022b). Impact of irrigation on farm household diet quality: Evidence from Ethiopia. Irrigation and Drainage, 71(4), 1089–1106. https://doi.org/10.1002/ird.2702
- Akrasi, R. O., Eddico, P. N., & Adarkwah, R. (2020). Income diversification strategies and household food security among rice farmers: Pointers to note in the North Tongu district of Ghana. Journal of Food Security, 8(3), 77–88. https://doi.org/10.12691/jfs-8-3-1
- Asmare, F., Teklewold, H., & Mekonnen, A. (2019). The effect of climate change adaptation strategy on farm households wellbeing in the Nile basin of Ethiopia: Is there synergy or trade-ofs? Int J Clim Change Strat Manag, 11(4), 518–535. https://doi.org/10.1108/IJCCSM-10-2017-0192
- Ayana, G. F., Megento, T. L., & Kussa, F. G. (2021). The extent of livelihood diversification on the determinants of livelihood diversification in Assosa Wereda, Western Ethiopia. GeoJournal, 87(4), 1–25. https://doi.org/10.1007/s10708-021-10379-5
- Barrett, C. B., Reardon, T., & Webb, P. (2001). Nonfarm income diversification and household livelihood strategies in rural Africa: Concepts, dynamics, and policy implications. Food Policy, 26(4), 315–331. https://doi.org/10.1016/S0306-9192(01)00014-8
- Bekele, M., Bezabih, M., Elias, H., Fisker, P., Gebrehiwot, T., & Kuma, T. (2020) Building resilience to climate change in Ethiopia what do we know so far? In: Development Economics Research Group Working Paper Series. University of Copenhagen.
- Belay, M., & Mengiste, M. (2021). The ex-post impact of agricultural technology adoption on poverty: Evidence from north Shewa zone of Amhara region, Ethiopia. International Journal of Finance & Economics, 28(2), 1327–1337. https://doi.org/10.1002/ijfe.2479
- Biru, W. D., Zeller, M., & Loos, T. K. (2020). The impact of agricultural technologies on poverty and vulnerability of smallholders in Ethiopia: A panel data analysis. Social Indicators Research, 147(2), 517–544. https://doi.org/10.1007/s11205-019-02166-0
- Chamberlain, G., & Griliches, Z. (1975). Unobservables with a variance-components structure: Ability, schooling, and the economic success of brothers. International Economic Review, 16(2), 422–449. https://doi.org/10.2307/2525824
- Dabessa Iticha, M., Jaleta, M., Mitiku, F., & Tejada Moral, M. (2021). Determinants and profitability of inorganic fertilizer use in smallholder maize production in Ethiopia. Cogent Food & Agriculture, 7(1), 1911046. https://doi.org/10.1080/23311932.2021.1911046
- Danso-Abbeam, G., & Baiyegunhi, L. J. S. (2018). Wellbeing impact of pesticides management practices among smallholder cocoa farmers in Ghana. Technology in Society, 54, 10–19. https://doi.org/10.1016/j.techsoc.2018.01.011
- Davis, B., Winters, P., Carletto, G., Covarrubias, K., Quiñones, E. J., Zezza, A., Stamoulis, K., Azzarri, C., & DiGiuseppe, S. (2010). A cross-country comparison of rural income generating activities. World Development, 38(1), 48–63. https://doi.org/10.1016/j.worlddev.2009.01.003
- Debele, B. N., & Desta, G. D. (2016). Livelihood diversification: Strategies, determinants and challenges for pastoral and agro-pastoral communities of Bale zone, Ethiopia. International Review of Social Sciences and Humanities, 11(2), 37–51.
- Ding, Z., & Abdulai, A. (2020). An analysis of the factors influencing choice of microcredit sources and impact of participation on household income. Journal of International Development, 32(4), 505–525. https://doi.org/10.1002/jid.3466
- Dinku, A. M. (2018). Determinants of livelihood diversification strategies in Borena pastoralist communities of Oromia regional state, Ethiopia. Agriculture & Food Security, 7(1), 1–8. https://doi.org/10.1186/s40066-018-0192-2
- Dubin, J. A., & McFadden, D. L. (1984). An econometric analysis of residential electric appliance holdings and consumption. Econometrica: Journal of the Econometric Society, 52(2), 345–362. https://doi.org/10.2307/1911493
- Duguma, G., Beyene, F., Ketema, M., & Jemal, K. (2023). Determinants and impacts of livelihood choice strategies on farm households’ food security status in North Shewa zone Oromia, Ethiopia. International Journal of Applied Agricultural Sciences, 9(3), 61–73. https://doi.org/10.11648/j.ijaas.20230903.11
- Echebiri, R. N., Onwusiribe, C. N., & Nwaogu, D. C. (2017). Effect of livelihood diversification on food security status of rural farm households in Abia State Nigeria. Scientific Papers Series Management, Economic Engineering in Agriculture & Rural Development, 17(1), 159–166.
- Emebet, A., & Samuel, T. (2022). Livelihood diversification and its impact on household food security among farming households in Kalu Woreda, South Wollo, Ethiopia. Journal of Economics & Sustainable Development, 13(5), 17–24.
- Emeru, G. M., Fikire, A. H., & Beza, Z. B. (2022). Determinants of urban households’ livelihood diversification strategies in North Shewa zone, Ethiopia. Cogent Economics & Finance, 10(1), 2093431. https://doi.org/10.1080/23322039.2022.2093431
- Endiris, A., Brehanie, Z., Ayalew, Z., & Yildiz, F. (2021). The impact of off-farm activities on rural households’ food security status in Western Ethiopia: The case of Dibatie district. Cogent Food & Agriculture, 7(1), 1879425. https://doi.org/10.1080/23311932.2021.1879425
- Getahun, T. D., & Villanger, E. (2015). Labor-intensive jobs for women and development: Intrahousehold welfare effects and its transmission channels (no. 15). CMI (Chr. Michelsen Institute).
- Getinet, B., & Lorato, T. (2020). The role of rural livelihood diversification strategies for household food security in Southern Ethiopia: Empirical evidence from Kecha Bira district of Kembata Tembaro zone. Journal of Finance and Economics, 8(3), 142–151. https://doi.org/10.12691/jfe-8-3-7
- Helmy, I. (2020). Livelihood diversification strategies: Resisting vulnerability in Egypt (No. 441). GLO Discussion Paper. http://hdl.handle.net/10419/210455
- Kassie, M., Marenya, P., Tessema, Y., Jaleta, M., Zeng, D., Erenstein, O., & Rahut, D. (2018). Measuring farm and market level economic impacts of improved maize production technologies in Ethiopia: Evidence from panel data. Journal of Agricultural Economics, 69(1), 76–95. https://doi.org/10.1111/1477-9552.12221
- Ketema, M., & Kebede, D. (2017). Adoption intensity of inorganic fertilizers in maize production: Empirical evidence from smallholder farmers in eastern Ethiopia. Journal of Agricultural Science, 9(5), 124–132. https://doi.org/10.5539/jas.v9n5p124
- Khonje, M. G., Manda, J., Mkandawire, P., Tufa, A. H., & Alene, A. D. (2018). Adoption and wellbeing impacts of multiple agricultural technologies: Evidence from eastern Zambia. Agricultural Economics, 49(5), 599–609. https://doi.org/10.1111/agec.12445
- Kumar, A., Mishra, A., Saroj, S., & Joshi, P. K. (2019). Impact of traditional versus modern dairy value chains on food security: Evidence from India’s dairy sector. Food Policy, 83, 260–270. https://doi.org/10.1016/j.foodpol.2019.01.010
- Merga, B., & Haji, J. (2019). Factors impeding effective crop production in Ethiopia. Journal of Agricultural Science, 11(10), 1–14. https://doi.org/10.5539/jas.v11n10p98
- Mohammed, K., Batung, E., Kansanga, M., Nyantakyi-Frimpong, H., & Luginaah, I. (2021). Livelihood diversification strategies and resilience to climate change in semi-arid northern Ghana. Climatic Change, 164(3–4), 1–23. https://doi.org/10.1007/s10584-021-03034-y
- Musumba, M., Palm, C. A., Komarek, A. M., Mutuo, P. K., & Kaya, B. (2022). Household livelihood diversification in rural Africa. Agricultural Economics, 53(2), 246–256. https://doi.org/10.1111/agec.12694
- Oduniyi, O. S., Chagwiza, C., & Wade, T. (2022). Wellbeing impacts of conservation agriculture adoption on smallholder maize farmers in South Africa. Renewable Agriculture and Food Systems, 37(6), 672–682. https://doi.org/10.1017/S1742170522000308
- Tambe, S. (2022). Sustainable livelihoods approach. In Teaching and learning rural livelihoods (pp. 45–56). Springer. https://doi.org/10.1007/978-3-030-90491-3_4
- Tesfay, M. G. (2020). Does fertilizer adoption enhance smallholders’ commercialization? An endogenous switching regression model from northern Ethiopia. Agriculture & Food Security, 9(1), 1–18. https://doi.org/10.1186/s40066-020-0256-y
- Tesfaye, W., Blalock, G., & Tirivayi, N. (2021). Climate-smart innovations and rural poverty in Ethiopia: Exploring impacts and pathways. American Journal of Agricultural Economics, 103(3), 878–899. https://doi.org/10.1111/ajae.12161
- Washo, J. A., Tolosa, S. F., & Debsu, J. K. (2021). Determinants of rural households’ livelihood diversification decision: The case of Didessa and Bedelle District, Bunno Bedelle Zone, Oromia Regional State, Ethiopia. African Journal of Agricultural Research, 17(12), 1573–1580. https://doi.org/10.5897/AJAR2021.15771
- Wordofa, M. G., Hassen, J. Y., Endris, G. S., Aweke, C. S., Moges, D. K., & Rorisa, D. T. (2021). Adoption of improved agricultural technology and its impact on household income: A propensity score matching estimation in eastern Ethiopia. Agriculture & Food Security, 10(1), 1–12. https://doi.org/10.1186/s40066-020-00278-2
- World Food Program (WFP). (2017). Conducting food security assessments using household expenditure surveys Vam Guidance Paper.
- Zegeye, M. B., Fikire, A. H., & Meshesha, G. B. (2022). Determinants of multiple agricultural technology adoption: evidence from rural Amhara region, Ethiopia. Cogent Economics & Finance, 10(1), 2058189. https://doi.org/10.1080/23322039.2022.2058189
- Zerssa, G., Feyssa, D., Kim, D. G., & Eichler-L¨ Obermann, B. (2021). Challenges of smallholder farming in Ethiopia and opportunities by adopting climate-smart agriculture. Agriculture (Switzerland), 11(3), 1–26. https://doi.org/10.3390/agriculture11030192
Appendix
Table A1. Summary statistics of the variables used in the analysis
Table A2. Second stage estimates for wellbeing measured in annual consumption expenditure
Table A3. Second stage estimates for food security measured in daily calorie intake (KiloCal)
Table A4. Second stage estimates for maize productivity measured in net crop value (NCV)