
 ?Mathematical formulae have been encoded as MathML and are displayed in this HTML version using MathJax in order to improve their display. Uncheck the box to turn MathJax off. This feature requires Javascript. Click on a formula to zoom.
Abstract
Iraq and other nations have had fatalities as a result of the COVID-19 pandemic, which started from China. In Iraq, the 2020 coronavirus pandemic spread started on February 24–2020, in the Najaf province. Other cases of COVID-19 were detected in other governorates, where the overall number of confirmed infections in Iraq reached 2,114,313 including 24,267 deaths, as of January 16–2022. This study aims to identify infection recognition patterns using data mining applications by Remote Sensing RS and Geographical Information Systems GIS techniques to prepare coronavirus spread mapping based on spatial-temporal distribution and GIS-based spreading pattern processes in Iraq. In addition, to evaluate the air quality in the period of virus breakout and lockdown. The assessed data included the period from the beginning of the spread of the corona until its end. To present the mode of spread at the beginning of pandemic, we relied on statistical and remotely sensed data from February 24 to June 25–2020. Along with the results of the GIS spatial distribution maps, we provided a visual view of infection queries and presented the results as a spreading pattern map of COVID-19 in Iraq. Thus, GIS and remote sensing technologies are indispensable to overcoming contagious diseases by monitoring their geographical distribution.
1. Introduction
Coronavirus is an emerging new strain of virus that is mutated from SARS and belongs to the RNA-enveloped positive-sense family of viruses that infect humans and animals (Ullah, Citation2021). The disease symptoms vary between severe and advanced cases and other cases with very simple symptoms where most patients infected with the virus show symptoms of fever, fatigue, tonsillitis, and sneezing (Nobel et al., Citation2020). When the virus reaches the lungs, respiratory symptoms such as coughing, difficulty breathing, and acute respiratory infections may appear in the patient and may be followed by major complications (Azhar et al., Citation2020). It seems that the elderly are the age group most affected by the infection, in addition to patients with diabetes, chest, heart, and kidney diseases, diseases, and immune system disorders (Du et al., Citation2020). This virus is transferred by direct contact with the infected person (Arons et al., Citation2020; Gormley et al., Citation2020). This virus, like others, has many mutations, which lead to the emergence of new strains of the disease, more dangerous and rapidly spreading, such as the Delta (Perez-Gomez, Citation2021), and Omicron (Islam et al., Citation2022).
The coronavirus pandemic was spreading far and wide around the world, resulting in a major threat locally and globally (Feng et al., Citation2020). This virus, which started in Wuhan, China, became the principal human challenge (Azarafza et al., Citation2021; Lu et al., Citation2020). The economic, social, and political conditions have been more adversely impacted by this COVID-19 regional epidemic (Asfaw et al., Citation2022; Yoosefi Lebni et al., Citation2021). Different restrictions operations were applied (e.g. closing the country's borders and restricting aerial traffic) to limit the virus spread and reduce the infectious, nevertheless, the virus spread has been very fast and widespread (Azarafza et al., Citation2021). In addition, some of these preventive measures negatively affected the international economy, people’s livelihood, and psychological state, causing many economic crises and increased unemployment and death due to illness or effects (Atkeson, Citation2020).
On the other hand, these closures led to significant advantages, improving air quality and decreasing the environmental pollution levels (Bherwani et al., Citation2021). From an environmental standpoint, there are advantages, such as a notable improvement in air quality due to the entire cessation of industrial activity and transportation, which are well-known causes of air pollution, there has been a sudden drop in the concentration profile of air pollutants (Praveen Kumar et al., Citation2022). Furthermore, to evaluate the substantial changes in air quality, the National Aeronautics and Space Administration (NASA) and European Space Agency (ESA) published air pollution data for Asian and European nations (Gautam, Citation2020). Moreover, using data on air pollution from nine Asian cities and statistical techniques, Gupta et al. (Citation2021) concluded a relationship between the death rate in infected cases and air pollution. There is a correlation between air pollution levels and COVID-19-related mortality, indicating that air pollution is a significant component in increasing the burden.
Some epidemiological studies have been presented by researchers that estimate the dynamic transmission, resource targeting, and intervention strategy (Azarafza et al., Citation2020; Pande et al., Citation2023; Sresto et al., Citation2022). Remote sensing techniques, GIS, and statistical approaches are used to determine the affected regions, the greatest susceptibility regions, and the spreading pattern of the virus (Badillo-Rivera et al., Citation2020), and to analyze the social resilience level (Habibi et al., Citation2020). Also, the geo-visualization approach integrated with GIS has been used to analyze and visualize the virus data geographically (Kodge, Citation2021). Besides, the data mining applications by clustering were mainly used for preparing the virus spread maps (Azarafza et al., Citation2021).
Clustering is one of the important tools in investigative data analysis (Jain et al., Citation1999). Hence, the classification and identification of sensitive regions in the spatial-temporal distribution and COVID-19 transference can be a significant strategy for preventing the virus’s spread (Lu et al., Citation2020).
Detecting the COVID-19 distribution pattern and its associated hazards in Iraq has enormous ramifications for healthcare systems, public health, and society at large. Early detection of the virus’s propagation pattern enables prompt virus impact mitigation measures. Monitoring hazards enable targeted public health initiatives by allowing an awareness of which regions or communities are more vulnerable. Additionally, a thorough understanding of the dispersion pattern aids in resource allocation and planning for healthcare organizations. Prioritizing immunization efforts benefits from knowledge about the virus’s mode of transmission. Priority may be given to high-risk locations. Making informed decisions on lockdowns, travel restrictions, and business closures requires careful observation of the spread pattern. These choices could have a big impact on the economy.
For identifying a coronavirus spread pattern recognition in Iraq, clustering and GIS-based analysis were implemented to detect the COVID-19 spread pattern from the start point (Najaf city) to the other provinces of Iraq. Different types of data have been used and analyzed statistically. Environmental changes related to air quality caused by the outbreak were also discussed based on remote sensing data and ArcGIS maps by evaluating the air quality during lockdown. Based on the information taken into account and provided in this study, it is possible to recognize the virus spread pattern and related risk monitoring. By identifying hazards, limits can be approached more carefully, potentially reducing economic disruptions. Long-term planning for public health infrastructure and pandemic readiness can be influenced by tracking and comprehending COVID-19 dissemination patterns.
2. Data and study area
Two types of data have been used in this study: data related to COVID-19 and data related to air quality. The data used in this study were downloaded from the World Health Organization WHO website, the Iraqi Ministry of Health, worldometers statistics, and the NASA Worldview application. All used data were reported in Table .
Table 1. Data summary
The geographic location of Iraq is in Southwestern Asia. Iraq covers a total area of 438,317 km2. The largest city is Baghdad, the capital of Iraq. While Iraq’s western and southern regions get substantially drier weather, the central and southern regions experience a range of conditions, from continental to dry. The weather is Mediterranean in the mountains in the north and northeast. Wintertime highs typically reach 16 C. The weather is extremely hot during the summer, with daytime highs of over 50 degrees Celsius in July and August and overnight lows of 26 degrees Celsius. Iraq experiences precipitation from December through February ranging between 100 and 180 mm. Rainfall can occasionally last into April in the northern and northeastern regions (Hamed et al., Citation2021; Jumaah et al., Citation2023).
Iraq’s air is severely polluted by toxins released from a variety of sources Iraq’s metropolitan regions experience severe environmental issues, including air pollution, the effects of climate change, poor rainfall, water scarcity, soil salinity, and water pollution, which worsen the state of the country’s important ecosystems. Therefore, it is crucial to continue with studies and research on monitoring pollution levels and other serious problems such as COVID-19 spread pattern.
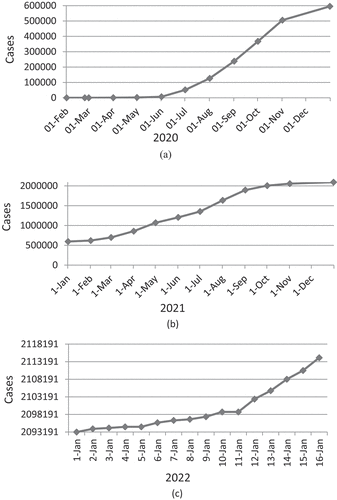
The study area is located between latitudes of (27 ° 15′- 36 ° 36′)N and longitudes of (37° 10′-50° 05′) E (Figure ). Moreover, Figure shows the total commutative cases of coronavirus infections in Iraq for 3 years.
Figure 1. Covid-19 and the geographic location of Iraq.
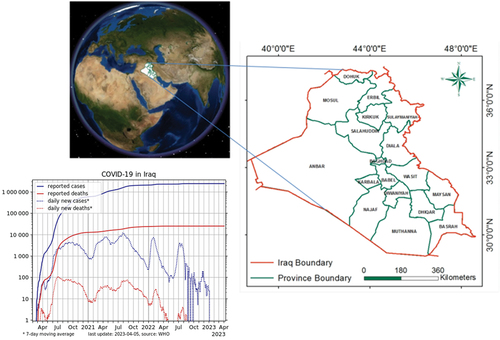
Figure 2. The total commutative cases of corona infections in Iraq in; (a) 2020 (b) 2021, and (c) 2022.
3. Methods
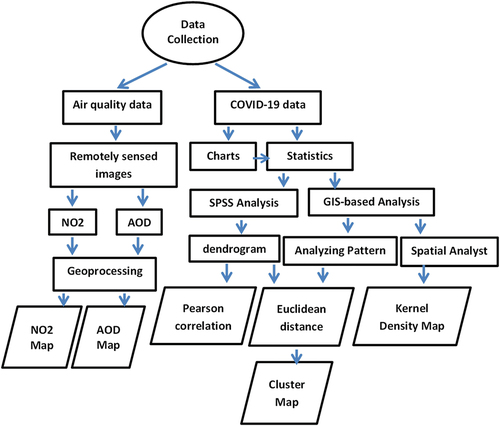
To monitor the coronavirus spreading pattern in Iraq, the clustering method and geographically spatial distribution based on ArcGIS 10.3 have been applied to identity the COVID-19 spreading risk from the beginning area to the further provinces in Iraq. The full period of the pandemic was considered in the analysis. Furthermore, based on data from February 24 to June 25–2020 the investigation and processes have been conducted and implemented to determine the spreading pattern at the beginning of the propagation. Moreover, statistical analyses were used to introduce the dendrogram of infection clustering in Iraq. We used two methods: Euclidean distance and Pearson correlation. It is a typical task in the field of epidemiology and data analysis to create a dendrogram to cluster infections. The hierarchical relationships between data points or groupings of data points are represented as dendrograms, which resemble trees. A dendrogram can assist you in understanding how various diseases or cases are related to one another in the context of infection clustering based on specific traits or similarities. Finally, remotely sensed images were used to detect environmental changes in air quality during outbreaks and embargoes. The study methodology is shown in Figure .
Figure 3. The study methodology.
Modern GIS techniques provide real-time information, facilitate data sharing, and have become very popular in understanding the spread of the coronavirus (Kamel Boulos & Geraghty, Citation2020). GIS also performs a significant job with multi-layer spatial data incorporation alongside statistical information (Ameen et al., Citation2021; Jumaah et al., Citation2018, Citation2021, Citation2023). It permits effective processing and data investigation to interpret and visualize information properly and present beneficial results (Jumaah et al., Citation2019, Citation2022; Kalantar et al., Citation2020). The main task of cluster analysis is pattern recognition for virus transmission tracking through investigative data mining. It is well known that clustering consists of various algorithms, each of which has a different idea of what a cluster is and how to most effectively use it to clarify the task (Azarafza et al., Citation2021). Clustering is formulated as a multitasking enhancer to perform cognitive detection of event patterns according to an iterative method (Aggarwal & Reddy, Citation2014).
In Figure we relied on COVID-19 statistics from Iraq provinces in order to map the total cases of virus infections and identify spreading patterns. Based on layer properties graduated, colors were established and the methodology involved dividing the provinces into five classes based on infection severity. The second mapping analysis involved using a clustering tool to determine spread patterns. The spatial statistics tool was used. Grouping analysis was used for analyzing patterns. The Euclidean distance method was used. The equation of Euclidean distance can be stated as;
where is the Euclidean distance of the
and the
data object,
is the number of parameters,
is the
data object in the kth parameter,
is the
data object in the
parameter (Dini & Fauzan, Citation2020).
The process of dividing a collection of spatial objects into clusters is known as geospatial clustering. While the clusters themselves are as diverse as possible, the objects within them exhibit a high degree of similarity. Furthermore, a spatial analyst tool was used to present a Kernel density map of coronavirus infections.
Moreover, satellite images of the period of the pandemic have been downloaded by the NASA application (worldview). Two images were downloaded and analyzed based on two air quality parameters (Aerosol Optical Depth AOD and Nitrogen Dioxide NO2). Also, spatial distribution maps of AOD and NO2 were presented. Geoprocessing analysis was applied to determine the pollution levels. NO2 It is created by different combustion processes and lightning in the troposphere and serves as a sign of pollution and poor air quality in cities. The Ozone Monitoring Instrument OMI Level-3 NO2 product provides daily gridded global coverage with a temporal resolution of 1 day and sensor/algorithm resolution, where good-quality pixel-level data are binned and “averaged” into global grids of 0.25 × 0.25 degrees. The level at which airborne particles (aerosols) interfere with light’s ability to pass through the atmosphere is indicated by the term “aerosol optical depth” (AOD). Factory pollution, fire smoke, dust from dust storms, sea salt, volcanic ash, and smog are all sources of aerosols. Studying aerosol optical depth over terrestrial surfaces can be done with the help of the Deep Blue Aerosol Optical Depth layer. Using the Deep Blue (DB) algorithm, this layer was produced. Both the Terra and Aqua satellites can provide daytime overpasses of the MODIS Deep Blue Aerosol Optical Depth (Land) layer. The sensor’s temporal resolution is daily.
4. Results
Figure represents the cumulative cases of COVID-19 in Iraq from the beginning to October 2021. Based on Figure , the cumulative infections reached 1,943,701 cases. The maximum number of cases were within two provinces, Baghdad and Basrah, with 586,300 cases. Based on Figure cluster map shows the severity of infection in cluster 2 Baghdad province. Figure represents the coronavirus infections in Iraq from Feb 24 to June 25–2020, based on GIS mapping. The maximum number of infections was 265–9445 cases within 4 months concentrated in 10 provinces in north and south of Iraq. Table represents a cluster map summary involving the minimum and maximum infections in five different periods from Feb 24 to June 25–2020 (4 months evaluation), and Feb 24 to Oct 2021. No infections were reported in Salahuddin province in the beginning period while a total of 97 infections were recorded in June 2020 as a minimum record within the two provinces Dohuk and Mosul. The maximum record in this period was 125 to 9445 infections in Baghdad and other nine provinces. From Feb 24–2020 to Oct 24–2021, the recorded minimum number of infections was 19,074, while the maximum number of infections was 586,300 with a standard deviation of 121,585.55 and a mean of 112,036.83. As well as Table represents overall cluster map statistics for the same periods. Spatial constraints of contiguity edges corners resulted in the Euclidean distance method of high coefficients minimum R2 was 0.96 and maximum of 0.99.
Figure 4. The coronavirus in Iraq; (a) infections, and (b) cluster map.
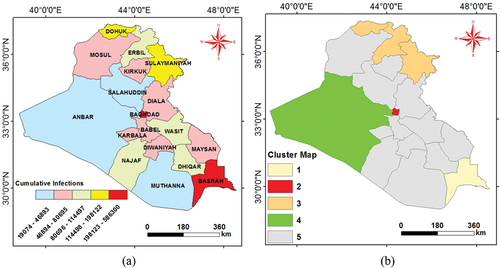
Figure 5. The coronavirus infections in Iraq from Feb 24 to June 25–2020, based on GIS mapping.
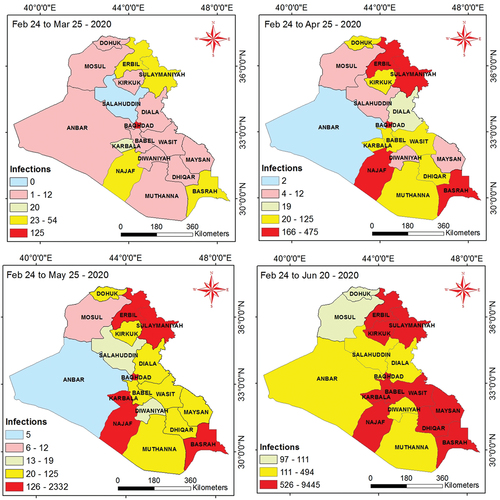
Table 2. Cluster map summary
Table 3. Overall cluster map statistics
Figure represents the global monitoring of COVID-19 in Iraq. Where Iraq appears in highly infected classes with (500,001–5,000,000,000) cases. Figure is a cluster map and Figure represents kernel density map. The dendrogram of infections clustering in Iraq is represented in Figure where Figure represents Euclidean distance, and Figure represents Pearson correlation.
Figure 6. The global monitoring of COVID-19 in Iraq.
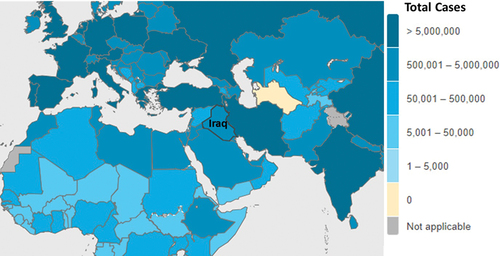
Figure 7. Cluster map of the period Feb 24 to Jun 25–2020.
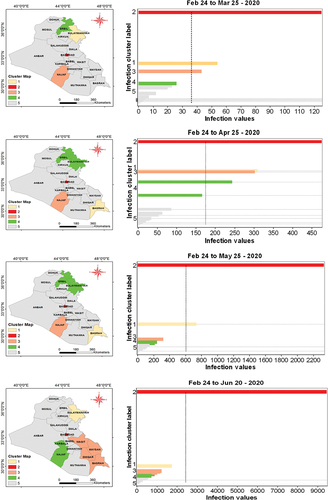
Figure 8. Kernel density map.
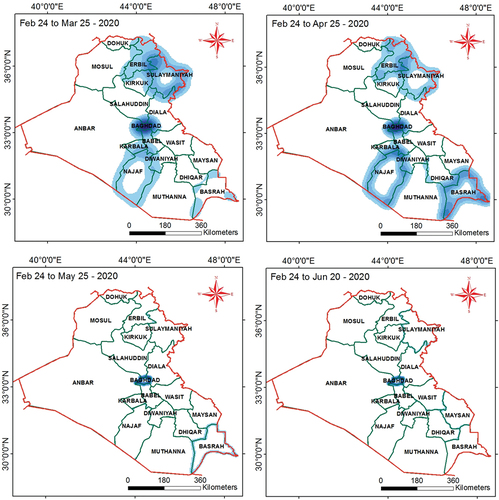
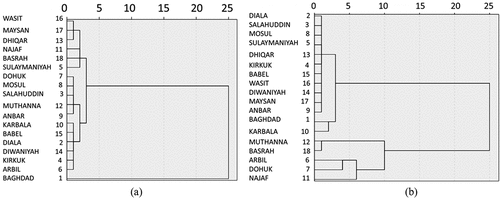
Figure 9. Dendrogram of infections clustering; (a) Euclidean distance, and (b) Pearson correlation.
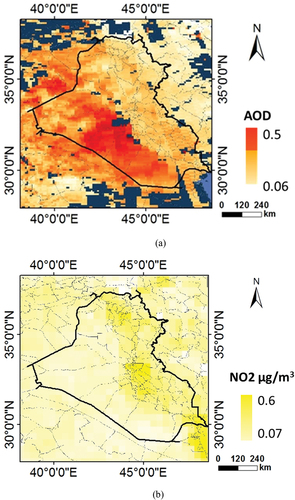
Moreover, Figure represents remote sensing-based maps of air quality where Figure Aerosol Optical Depth (AOD), and Figure Nitrogen Dioxide (NO2). Spatial distribution of AOD and NO2 was obtained by geoprocessing analysis. The AOD ranged between (0.06–0.5), and NO2 ranged from (0.07–0.6) µg/m3. AOD was within low levels in the entire Iraq less than 0.5 except in southwest parts. NO2 was within standards in all of the country.
Figure 10. Remote sensing-based maps of air quality; (a) AOD, and (b) NO2.
5. Discussion
Based on Figure the infections are visualized as a spatial distribution in the provinces in the period of Feb 24–2020 to Oct 24–2021. The blue color represents the minimum infections otherwise red refers to high infections. High infections were within Baghdad and Basrah. The number of cases in these specific regions, such as Baghdad and Basrah, can vary for two essential reasons: population density and travel patterns. Travel volume into and out of major cities and transportation hubs like Baghdad and Basrah are frequently higher. This may result in infections from other areas or nations, which would raise the overall number of cases.
Based on Figure , the infections are visualized as a spatial distribution in the provinces in four different periods from Feb 24 to June 25–2020 at the beginning of the virus spread. From the map, it can be seen the virus state and consequent spread of infections starting from Baghdad and continuing to Basrah and Najaf provinces.
Based on Table , the analysis result of Euclidean distance method clustering was performed with high coefficients of 0.96, 0.97, 0.99, 0.99, and 0.98 for 24 February to Mar, 24 February to Apr, 24 February to May, 24 February to June, and 24 February 2020 to 24 October 2021, respectively. In Figure Iraq is ranked the second stage in the number of infections on a global scale. The population size, testing capability, healthcare infrastructure, public health initiatives, and pandemic dynamics are some factors that influence infection spread. The COVID-19 scenario is dynamic and subject to quick change. Various factors, such as the introduction of novel variations, modifications to public health policies, vaccination efforts, and population behavior, might cause countries to see spikes in cases at different times.
Figure specifies the spreading pattern based on clustering analysis as shown in the map. Cluster 2 indicates a high infection risk from February 24 to June 25–2020. Each period has been divided into five clusters. From Feb 24 to Mar 25–2020, the spreading pattern involved cluster 1, Sulaymaniyah, cluster 2, Baghdad, cluster 3, Najaf, cluster 4, Arbil, and cluster 5 the rest provinces. From Feb 24 to Apr 25–2020 and Feb 24 to May 25–2020 the spreading pattern involved cluster 1, Basrah, cluster 2, Baghdad, cluster 3, Najaf, cluster 4, Sulaymaniyah, and Arbil, and cluster 5, the rest provinces. From Feb 24 to Jun 25–2020, the spreading pattern involved cluster 1, Sulaymaniyah, cluster 2, Baghdad, cluster 3, Wasit, Maysan, Thiqar, and Basrah, cluster 4, Karbala, and Najaf, and cluster 5 the rest of provinces.
Figure clarifies the kernel density estimates. According to the results presented by the map, a non-parametric probability density function was employed for the virus prevalence in Iraq based on infection development and their spatial distribution during the study period of Feb 24 to Jun 25. The map shows the provinces which might have affected each other. Baghdad, Najaf, Basrah, Arbil, and Sulaymaniyah provinces are set within the crisis parts of Iraq for virus spreading.
Based on Figure Euclidean distance dendrogram specifies that there are four groups of prevalent infections in Iraq among the provinces, and the role of the Baghdad Provence in this prevalence is very notable. The first group involved Baghdad province, and the second group involved Arbil, Kirkuk, Diwaniyah, Diala, Karbala, and Babil. The third group involved Anbar, Muthanna, Salahuddin, Dohuk, and Mosul. The fourth group involved Sulaymaniyah, Basrah, Najaf, Thiqar, Maysan, and Wasit. The effect of the spread appears between the second and third groups, and then the fourth group which all of them were influenced by the first group.
Based on Figure Pearson correlation dendrogram, there are five groups of prevalent infections in Iraq among the provinces. The first group involved Najaf province, and the second group involved Dohuk, and Arbil. The third group involved Basrah, and, Muthanna. The fourth group involved Karbala and Baghdad. The fifth group involved Anbar, Maysan, Diwaniyah, Wasit, Babil, Kirkuk, Thiqar, Sulaymaniyah, Mosul, Salahuddin, and Diala. The effect of the spread appears between the first and second groups, and then in the third group. The fourth and fifth groups appear related and influenced by the other groups.
Based on Figure the air contaminants reduced significantly during the outbreak. AOD levels decreased compared to previous levels. An AOD of under 0.1 is considered “clean”. Aerosols get so dense that the sun is obscured as AOD rises from 0.5 to 3. The total NO2 column’s tropospheric component is shown by the OMI Nitrogen Dioxide (NO2) tropospheric parameter with low levels of less than 0.7 in all entire Iraq during the period of lockdown.
6. Conclusion
Through time-series monitoring of the coronavirus dissemination pattern in Iraq at the province level, the study that was presented attempted to pinpoint the clustering mechanisms. The utilized information were obtained from the World Health Organization (WHO) and national sources, (The Iraqi Ministry of Health) for the periods of February 24–2020 to Jan 16–2022. Based on the clustering method, data mining was applied to examine pattern recognition of infections in Iraq. The evaluation involved different periods to identify spread patterns. The results showed that Najaf and Baghdad provinces are the main points for coronavirus developments. But Baghdad is the main responsible province for virus spreading patterns in Iraq. Having a thorough understanding of the virus’s transmission aids in the development of efficient control measures by public health experts and lawmakers. It enables a more precise assessment of the risk connected to certain activities or places. For instance, regions with high transmission rates might be seen as higher risk, which would necessitate the adoption of stronger regulations. Finally, understanding the coronavirus distribution pattern is crucial for managing the pandemic, safeguarding the public’s health, and making wise choices at different levels of government and health care It is a crucial component in pandemic reaction and management.
Furthermore, a notable decrease in air pollution was detected during the outbreak. During the COVID-19 lockdowns that were executed in many regions of the world, air quality improved in several areas, according to numerous reports and research. There was better air in many areas as a result of the lockdowns, which significantly decreased industrial activity, transportation, and other sources of air pollution. Lower emissions of pollutants like nitrogen oxides (NOx) and particulate matter were caused by a slowdown in industrial production, less transportation, and decreased air travel. These advancements were transient and mostly the outcome of exceptional circumstances. They emphasize the possible advantages of implementing more ecologically responsible and sustainable activities in the long run to maintain improved air quality and lessen the effects of pollution on the environment and public health.
Abbreviation
Geographical Information Systems GIS, Remote Sensing RS, World Health Organization WHO, Aerosol Optical Depth AOD, Nitrogen Dioxide NO2, Deep Blue DB, and Ozone Monitoring Instrument OMI.
Author contributions statement
Conceptualization and supervision: HJJ; writing review and editing: HJJ, HGA, HHH, and HMO; data curation and formal analysis: HGA, HHH, HJJ, HMO, HA, and AAA; evidence collection, review, and editing: HGA, HHH, HJJ, HMO, MSA, HA, and AAA.
Acknowledgments
We acknowledge the use of study data from the WHO, the Iraqi Ministry of Health, and the NASA Worldview application, retrieved on 30 October 2020.
Disclosure statement
On behalf of all authors, the corresponding author states that they have no known competing financial interests or personal relationships that could have appeared to influence the work reported in this paper.
Data availability statement
The data that support the findings are available online; https://covid19.who.int/region/emro/country/iq, https://en.wikipedia.org/wiki/COVID-19_pandemic_in_Iraq, https://www.worldometers.info/coronavirus/country/iraq/ and https://worldview.earthdata.nasa.gov.
Additional information
Funding
References
- Aggarwal, C. C., & Reddy, C. K. (2014). Data clustering: Algorithms and applications. Taylor & Francis Group, LLC. https://citeseerx.ist.psu.edu/viewdoc/download?doi=10.1.1.360.3651&rep=rep1&type=pdf
- Ameen, M. H., Jumaah, H. J., Kalantar, B., Ueda, N., Halin, A. A., Tais, A. S., & Jumaah, S. J. (2021). Evaluation of PM2. 5 particulate matter and noise pollution in Tikrit University based on GIS and statistical modeling. Sustainability, 13(17), 9571. https://doi.org/10.3390/su13179571
- Arons, M. M., Hatfield, K. M., Reddy, S. C., Kimball, A., James, A., Jacobs, J. R., Taylor, J. S., Bardossy, K., & Jernigan, J. A. (2020). Presymptomatic SARS-CoV-2 infections and transmission in a skilled nursing facility. New England Journal of Medicine, 382(22), 2081–15. https://doi.org/10.1056/NEJMoa2008457
- Asfaw, H., Karuppannan, S., Erduno, T., Almohamad, H., Dughairi, A. A. A., Al-Mutiry, M., & Abdo, H. G. (2022). Evaluation of vulnerability status of the infection risk to COVID-19 using geographic information systems (GIS) and Multi-Criteria Decision analysis (MCDA): A case study of Addis Ababa city, Ethiopia. International Journal of Environmental Research and Public Health, 19(13), 7811. https://doi.org/10.3390/ijerph19137811
- Atkeson, A. (2020). What will be the economic impact of COVID-19 in the US? Rough estimates of disease scenarios (no. w26867). National Bureau of Economic Research. https://www.nber.org/papers/w26867
- Azarafza, M., Azarafza, M., & Akgün, H. (2021). Clustering method for spread pattern analysis of corona-virus (COVID-19) infection in Iran. Journal of Applied Science, Engineering, Technology, and Education, 3(1), 1–6. https://doi.org/10.35877/454RI.asci31109
- Azarafza, M., Azarafza, M., & Tanha, J. (2020). COVID-19 infection forecasting based on deep learning in Iran. medRxiv. https://doi.org/10.1101/2020.05.16.20104182
- Azhar, H., Jasndeep, K., Elsa, T., Salma, T., & SM, T. S. (2020). Novel COVID-19: A comprehensive review of transmission, manifestation, and pathogenesis. Cureus, 12(5). https://doi.org/10.7759/cureus.8184
- Badillo-Rivera, E., Fow-Esteves, A., Alata-López, F., Virú-Vásquez, P., & Medina-Acuña, M. (2020). Environmental and social analysis as risk factors for the spread of the novel coronavirus (SARS-CoV-2) using remote sensing, GIS and Analytical Hierarchy Process (AHP): Case of Peru. MedRxiv. https://doi.org/10.1101/2020.05.31.20118653
- Bherwani, H., Gautam, S., & Gupta, A. (2021). Qualitative and quantitative analyses of impact of COVID-19 on Sustainable Development Goals (SDGs) in Indian subcontinent with a focus on air quality. International Journal of Environmental Science and Technology, 18(4), 1019–1028. https://doi.org/10.1007/s13762-020-03122-z
- Dini, S. K., & Fauzan, A. (2020). Clustering provinces in Indonesia based on community welfare indicators. EKSAKTA: Journal of Sciences and Data Analysis, 1(1), 56–63. https://doi.org/10.20885/EKSAKTA.vol1.iss1.art9
- Du, Y., Tu, L., Zhu, P., Mu, M., Wang, R., Yang, P., Wang, X., Hu, C., Rongyu Ping, R., Hu, P., Li, T., Cao, F., Chang, C., Hu, Q., Jin, Y., & Xu, G. (2020). Clinical features of 85 fatal cases of COVID-19 from Wuhan. A retrospective observational study. American Journal of Respiratory and Critical Care Medicine, 201(11), 1372–1379. https://doi.org/10.1164/rccm.202003-0543OC
- Feng, Y., Li, Q., Tong, X., Wang, R., Zhai, S., Gao, C., Lei, Z., Chen, S., Zhou, Y., Wang, J., Yan, X., Xie, Z., Chen, P., Liu, S., Xv, X., Liu, S., Jin, Y., Wang, C. … Guo, Y. (2020). Spatiotemporal spread pattern of the COVID-19 cases in China. PLoS ONE, 15(12), e0244351. https://doi.org/10.1371/journal.pone.0244351
- Gautam, S. (2020). COVID-19: Air pollution remains low as people stay at home. Air Quality, Atmosphere & Health, 13(7), 853–857. https://doi.org/10.1007/s11869-020-00842-6
- Gormley, M., Marawska, L., & Milton, D. (2020). It is time to address airborne transmission of coronavirus disease 2019 (COVID-19). Clinical Infectious Diseases, 71(9), 2311–2313. https://doi.org/10.1093/cid/ciaa939
- Gupta, A., Bherwani, H., Gautam, S., Anjum, S., Musugu, K., Kumar, N., Anshul, A., & Kumar, R. (2021). Air pollution aggravating COVID-19 lethality? Exploration in Asian cities using statistical models. Environment Development and Sustainability, 23(4), 6408–6417. https://doi.org/10.1007/s10668-020-00878-9
- Habibi, Y., Guellouh, S., Filali, A., & Berchiche, R. (2020). Analysis of social resilience to the novel coronavirus (covid-19) in algeria. Geomatics, Landmanagement and Landscape, 3, 19–29. https://doi.org/10.15576/GLL/2020.3.19
- Hamed, H. H., Jumaah, H. J., Kalantar, B., Ueda, N., Saeidi, V., Mansor, S., & Khalaf, Z. A. (2021). Predicting PM2. 5 levels over the north of Iraq using regression analysis and Geographical Information System (GIS) techniques. Geomatics, Natural Hazards and Risk, 12(1), 1778–1796. https://doi.org/10.1080/19475705.2021.1946602
- Islam, S., Islam, T., & Islam, M. R. (2022). New coronavirus variants are creating more challenges to global healthcare System: A brief report on the current knowledge. Clinical Pathology, 15, 2632010X221075584. https://doi.org/10.1177/2632010X221075584
- Jain, A. K., Murty, M. N., & Flynn, P. J. (1999). Data clustering: A review, ACM computing survey. ACM Computing Surveys, 31(3), 264–323. https://doi.org/10.1145/331499.331504
- Jumaah, H. J., Ameen, M. H., Kalantar, B., Rizeei, H. M., & Jumaah, S. J. (2019). Air quality index prediction using IDW geostatistical technique and OLS-based GIS technique in Kuala Lumpur, Malaysia. Geomatics, Natural Hazards and Risk, 10(1), 2185–2199. https://doi.org/10.1080/19475705.2019.1683084
- Jumaah, H. J., Ameen, M. H., Mahmood, S., & Jumaah, S. J. (2023). Study of air contamination in Iraq using remotely sensed data and GIS. Geocarto International, 38(1), 1–18. https://doi.org/10.1080/10106049.2023.2178518
- Jumaah, H. J., Ameen, M. H., Mohamed, G. H., & Ajaj, Q. M. (2022). Monitoring and evaluation Al-Razzaza lake changes in Iraq using GIS and remote sensing technology. The Egyptian Journal of Remote Sensing & Space Science, 25(1), 313–321. https://doi.org/10.1016/j.ejrs.2022.01.013
- Jumaah, H. J., Kalantar, B., Ueda, N., Sani, O. S., Ajaj, Q. M., & Jumaah, S. J. (2021). The effect of war on land use dynamics in Mosul Iraq using Remote sensing and GIS techniques, 2021 IEEE International Geoscience and Remote Sensing Symposium IGARSS, 2021, pp. 6476–6479. https://doi.org/10.1109/IGARSS47720.2021.9553165
- Jumaah, H. J., Mansor, S., Pradhan, B., & Adam, S. N. (2018). UAV-Based PM2. 5 monitoring for small-scale urban areas. International Journal of Geoinformatics, 14(4), 61–69. https://www.researchgate.net/publication/359730603_UAV-Based_PM2_5_Monitoring_for_Small Scale_Urban_Areas
- Kalantar, B., Ameen, M. H., Jumaah, H. J., Jumaah, S. J., & Halin, A. A. (2020). Zab River (Iraq) sinuosity and meandering analysis based on the remote sensing data. International Archives of the Photogrammetry, Remote Sensing and Spatial Information Sciences - ISPRS Archives, XLIII-B3-2020(B3), 91–95. https://doi.org/10.5194/isprs-archives-XLIII-B3-2020-91-2020
- Kamel Boulos, M. N., & Geraghty, E. M. (2020). Is the closest health facility the one used in pregnancy care-seeking? A cross-sectional comparative analysis of self-reported and modelled geographical access to maternal care in Mozambique, India and Pakistan. International Journal of Health Geographics, 19(1), 1–12. https://doi.org/10.1186/s12942-020-0197-5
- Kodge, B. G. (2021). A review on current status of COVID-19 cases in Maharashtra state of India using GIS: A case study. Spatial Information Research, 29(2), 223–229. https://doi.org/10.1007/s41324-020-00349-3
- Lu, H., Stratton, C. W., & Tang, Y. W. (2020). Outbreak of pneumonia of unknown etiology in Wuhan, China: The mystery and the miracle. Journal of Medical Virology, 92(4), 401. https://doi.org/10.1002/jmv.25678
- Nobel, Y. R., Phipps, M., Zucker, J., Lebwohl, B., Wang, T. C., Sobieszczyk, M. E., & Freedberg, D. E. (2020). Gastrointestinal symptoms and coronavirus disease 2019: A case-control study from the United States. Adenocarcinoma, and Barrett’s Epithelium Gastroenterology, 159(1), 373–375.e2. https://doi.org/10.1053/j.gastro.2020.04.017
- Pande, C. B., Moharir, K. N., Varade, A. M., Abdo, H. G., Mulla, S., & Yaseen, Z. M. (2023). Intertwined impacts of urbanization and land cover change on urban climate and agriculture in Aurangabad city (MS), India using google earth engine platform. Journal of Cleaner Production, 422, 138541. https://doi.org/10.1016/j.jclepro.2023.138541
- Perez-Gomez, R. (2021). The development of SARS-CoV-2 variants: The gene makes the disease. Journal of Developmental Biology, 9(4), 58. https://doi.org/10.3390/jdb9040058
- Praveen Kumar, R., Samuel, C., Raju, S. R., & Gautam, S. (2022). Air pollution in five Indian megacities during the Christmas and New Year celebration amidst COVID-19 pandemic. Stochastic Environmental Research and Risk Assessment, 36(11), 3653–3683. https://doi.org/10.1007/s00477-022-02214-1
- Sresto, M. A., Morshed, M. M., Siddika, S., Almohamad, H., Al-Mutiry, M., & Abdo, H. G. (2022). Impact of COVID-19 lockdown on vegetation indices and heat island effect: A Remote sensing study of Dhaka city, Bangladesh. Sustainability, 14(13), 7922. https://doi.org/10.3390/su14137922
- Ullah, R. (2021). Post vaccination COVID-19 infections: A big challenge. Pakistan Journal of Chest Medicine, 27(1), 01–02. http://pjcm.net/index.php/pjcm/article/view/718
- Yoosefi Lebni, J., Abbas, J., Moradi, F., Salahshoor, M. R., Chaboksavar, F., Irandoost, S. F., Nezhaddadgar, N., & Ziapour, A. (2021). How the COVID-19 pandemic effected economic, social, political, and cultural factors: A lesson from Iran. International Journal of Social Psychiatry, 67(3), 298–300. https://doi.org/10.1177/0020764020939984