
 ?Mathematical formulae have been encoded as MathML and are displayed in this HTML version using MathJax in order to improve their display. Uncheck the box to turn MathJax off. This feature requires Javascript. Click on a formula to zoom.
Abstract
This study aimed to investigate the extent and determinants of vegetable commercialization among smallholders in the Sebeta Hawas Woreda, Oromia region, Ethiopia. Data were collected through surveys of 385 farm households. The study results indicated that vegetable production in the study area is highly commercialized in terms of vegetable output marketed with an average commercialization extent of 74.2% although vegetable commercialization extent is at a low level (34.82%) in terms of land areas allotted to vegetable production. The results of the truncated Tobit regression model revealed that the extent of vegetable commercialization was significantly and positively influenced by the gender of the household head, year of schooling, family size, access to irrigation facilities, cooperative membership, access to credit services, contact with extension agents, access to improved seeds, access to chemical fertilizers, and access to market information. Conversely, the age of the household head, livestock holdings, and participation in off-farm activities significantly and negatively influenced the extent of vegetable commercialization. The study suggests that vegetable commercialization can be enhanced by supplying farm inputs such as improved seeds, chemical fertilizers, pesticides, and irrigation equipment. In addition, designing gender-focused intervention programs is essential to promote the equal participation of both men and women in vegetable production and marketing. Moreover, providing adequate and relevant market information and strengthening farmers’ cooperatives can enable smallholder farmers to access the market and increase their market participation so that they can obtain reasonable returns from the vegetable business.
1. Introduction
Agricultural commercialization refers to an increased supply of agricultural output to the market compared to the output quantity used by farm households for home consumption. This is considered a major progress toward agricultural transformation (Minot et al., Citation2021; Olwande et al., Citation2015). Growing global market integration, demand for agricultural commodities, and economic growth and development in agriculture-led low-income countries have driven the process of agricultural commercialization (Braun & Diaz-Bonilla, Citation2008; Pingali et al., Citation2005). The most pressing need is to commercialize subsistence-oriented smallholder production systems to meet rising demand and contribute to the resulting income-mediated benefits (Kristen et al., Citation2012).
Given that 80–85% of Ethiopians work in agriculture, primarily subsistence and rain-fed farming and livestock production, promoting agricultural commercialization necessitates significant public, private, and development partner involvement (Mordor Intelligence, Citation2022). According to Hagos and Geta (Citation2016), to alleviate poverty and ensure overall national development, Ethiopia must achieve accelerated agricultural development along a sustainable commercialization path. This aspect places a lot of emphasis on comprehending marketing behavior and the factors that influence each party’s propensity for commercialization at all levels to assist in developing and implementing the best institutional, policy, and technological strategies to guarantee that everyone is actively involved in the commercialization process. Since the Plan for Accelerated and Sustained Development to End Poverty (PASDEP) in 2006, the government of Ethiopia has prioritized accelerating agricultural growth through the commercialization of smallholder production MoFED (Citation2014).
The government of Ethiopia has spent a lot of money over many years commercializing smallholder farming, but so far neither farmers nor the country’s economy have benefited from this strategy. Farmers continue to practice subsistence farming and are unable to cope with shocks from climate change and price instability (Gutu, Citation2017). In Ethiopia, one of the key economic activities is vegetable production (Reddy & Kanna, Citation2016). Its production system includes public and private enterprises as well as home gardens and smallholder farming (ATA (Agricultural Transformation Agency), Citation2014). In Ethiopia, the contribution of cereal crop production to total agricultural crop production was 81.46%, whereas the contribution of vegetable crop production was 2.08% (CSA, Citation2020). This shows that Ethiopia is not as well off from vegetable production despite its enormous potential to boost the economy, household income and food security. Ethiopia has a variety of agroecologies that are suitable for growing various types of vegetables. According to a report by the Ethiopian Horticulture Development Agency (EHDA), (Citation2012), tropical vegetables are grown in lowlands below 1500 meters above sea level, subtropical vegetables in the midlands between 1500 and 2200 masl, and temperate vegetables in the highlands above 2200 masl in Ethiopia.
In Ethiopia’s agricultural development strategy, government policy prioritized the development of the vegetable sub-sector in recognition of the role of vegetables in boosting household income, improving nutrition, and preventing hidden hunger (also known as micronutrient deficiency), which results in health issues because of a diet deficient in important vitamins and minerals such as vitamin A, zinc, iron, and iodine (Adish, Citation2012). Therefore, the paradigm shift in food security strategy from production-oriented to market-oriented production paved the way for smallholder farmers to engage in market-oriented vegetable production (Ministry of Finance and Economic Development (MoFED), Citation2010). Despite this initiative, the Ethiopian government has not adequately addressed the needs of the vegetable sector. To hasten the transition of the sector from subsistence to commercial and market-oriented vegetable production, the Ethiopian government prioritized intensive vegetable production and commercialization (Chanyalew et al., Citation2010). Following the initiatives, Ethiopia is showing better progress in producing vegetables. According to the report by worldpopulationreview.com (2023), Ethiopia was ranked 12th country among 194 potential vegetable-producing countries of the world following Mexico. The country contributed 1,652,069 million tonnes to the total production of 1.155 billion tonnes of vegetables produced in 2021.
Different vegetable crops are produced and sold by smallholder farmers in Sebeta Hawas Woreda to generate income and sustain their way of life. Due to the proximity of the Woreda to Addis Ababa, the capital city of Ethiopia, and the accessibility of irrigation water, which allows smallholder farmers in the Woreda to continue vegetable production throughout the year, the production of vegetables assumes a special significance in this area (Sebeta Hawas Agriculture and Natural Resource Office (SHANRO), Citation2021). Despite the production and marketing potential of vegetables in the study area, little to no emphasis has been given to studying and documenting the extent and determinants of vegetable commercialization in Ethiopia in general and Sebeta Hawas Woreda in particular. Many studies (Ayele et al., Citation2021; Gebre et al., Citation2021; Wassihun et al., Citation2020; Endalew et al., Citation2020; Tefera, Citation2018; Mamo et al., Citation2017; Eshetu, Citation2018; Gari, Citation2017) have focused on cereal crop commercialization, and some of the studies have focused on oil and legume crop commercialization (Bekele & Alemu, Citation2015; Ejeta & Masresha, Citation2020; Tilahun et al., Citation2019) while few of them (Senbeta, Citation2020; Hailu et al., Citation2015; Tufa et al., Citation2014) have focused on vegetable crop commercialization in different parts of Ethiopia. This shows that the majorities of studies have overlooked a comprehensive aspect of vegetable commercialization and its determinants and signifies the lack of empirical evidence and knowledge gaps in the subject area. Therefore, this study was initiated to analyze the extent and determinants of vegetable commercialization among smallholders in Sebeta Hawas Woreda, using both the output commercialization index and land share allocated to vegetable production.
2. Methodology
2.1. Description of the study area
Sebeta Hawas Woreda (district) is located 25 km South–West of Addis Ababa city, Oromia National Regional State, Ethiopia. It has an average elevation of 2592.5 meters above sea level. The study area is situated between 38° 45′ 8″ E, 38° 24′ 34″ E, and 9° 1′ 17″ N, 8° 37′ 5″ N. The mean annual rainfall of the Woreda is approximately1033 mm while the mean annual temperature is about 21.5 °C. The Woreda consists of 36 rural kebeles (peasant associations) and 5 urban kebeles. The current total urban and rural population of Woreda is 189,912, of which 97,150 (51.2%) are males and 92,762 (48.8%) are females (Projection, Citation2022). Agricultural activity is the dominant means of livelihood for the majority of Sabata Hawas Woreda residents. Vegetable crops are grown in Woreda both for their consumption and for local and national markets. The major vegetable crops grown in the area are Onion, Tomato, and Cabbage in the order of potential production. There are other types of vegetables grown in the Woreda that include Ethiopian Cabbage/kale, beetroots, carrots, lettuce, pepper, and other root and tuber crops such as Potato, Sweet potato, and taro, which are produced in small quantities in limited areas of land (Sebeta Hawas Agriculture and Natural Resource Office (SHANRO), Citation2021).
2.2. Data source and sampling techniques
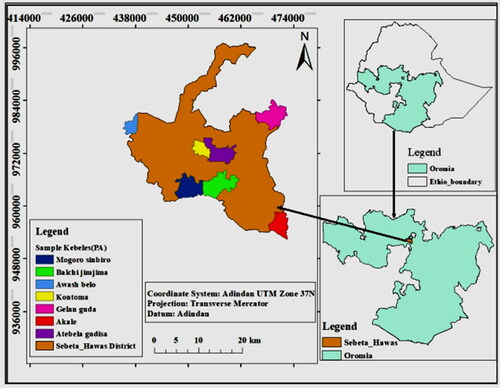
Primary and secondary data were used in this study. Face-to-face interviews using structured and pre-tested questionnaires, and cross-sectional household surveys were used to collect primary data whereas reports of agriculture and natural resource offices at different levels, CSA, NGOs, the Office of Trade and Market Development, the office of Woreda administrative and previous research works were used to collect secondary data. The study employed multi-stage sampling techniques to select the study area and sample the study population. In the first stage, Sebeta Hawas Woreda was selected from 6 Woredas in the Oromia Special Zones Surrounding Finfine based on vegetable production potential. Second, 7 vegetables producing kebeles (Gelan Guda, Mogoro Simbiro, Balchi Jimjima, Akale, Kontoma, Atebela Gudisa, and Awash Belo) were purposively selected from 36 rural kebeles in Woreda based on the volume of vegetable production (). In the third stage, 385 smallholder farm households were randomly selected based on a probability proportional to their total numbers. For the cross-sectional household survey, a representative sample size was obtained using Kothari’s (Citation2004) sample determination formula:
(1)
(1)
Figure 1. Map of the study area. Source: Developed based on ethio-GSI
where n is the required sample size, Z is the inverse of the standard cumulative distribution that corresponds to the level of confidence, e is the desired level of precision, p is the estimated proportion of an attribute present in the population, and q = 1−p. The value of Z is found in a statistical table containing the area under the normal curve with a 95% confidence level.
2.3. Methods of data analysis
2.3.1. Descriptive analysis
The demographic and socioeconomic characteristics of smallholder vegetable producers were analyzed using descriptive statistics such as means, standard deviations, and percentages. SPSS version 20 and STATA version 14 were used for descriptive and econometric analyses respectively.
2.3.2. Measurement of vegetable commercialization
The extent of vegetable commercialization was analyzed using the household commercialization index (HCI). The household commercialization index (HCI) gives the extent of commercialization as the percentage of marketed crop production (Leavy et al., Citation2008; Strasberg et al., Citation1999). A commercialization index near zero indicates low commercialization whereas an index value approaching 100 signifies a higher degree of commercialization. Accordingly, the commercialization index for vegetable output is defined as:
(2)
(2)
On the other hand, the commercialization indicator used for this study was the share of land (HCILS) devoted or allocated to vegetables that are produced and sold. According to Leavy and Poulton (2007), the share of land allocated to crops that are sold provides some insight into the level of commercialization. Therefore, vegetable commercialization in terms of land share is calculated as:
(3)
(3)
We selected the Two-limit Tobit model as the appropriate econometric model for this study. This is the most common censored regression model suitable for analyzing dependent variables with upper or lower limits (Abu, Citation2015; Liu et al., Citation2013; Tobin, Citation1958). This model was proposed because the value of the dependent variable (vegetable commercialization index) is between 0 and 1. The two-limit Tobit model is specified as:
(4)
(4)
where yi* is a latent variable (unobserved for values smaller than 0 and greater than 1) representing subsistence or fully commercial index; xi is a vector of independent variables, which includes factors affecting output sold; β is a vector of unknown parameters; εi is a disturbance term assumed to be independently and normally distributed with zero mean and constant variance σ2; and i = 1, 2,…n (n = the number of observations). Given the observed dependent variable commercialization index (yi), the two-limit Tobit model can be specified as:
(5)
(5)
According to McDonald and Moffit (Citation1980), the following approach was followed to decompose marginal effects and to assess the effect of a change in explanatory variables on the dependent variable. Therefore, the three steps considered in the Tobit model analysis are as follows. These are:
The marginal effect on the latent variable (unconditional expected value)
The marginal effect on the expected value of observations conditional on being uncensored
Where λ(c) is the inverse Mill’s ratio
This captures the change in the dependent variable (conditioned on y > 0) when changing x.
The marginal effect on the probability that the observations are uncensored
The multicollinearity problem was checked before Tobit model analysis. Two techniques have been suggested FOR analyzing multicollinearity existence among explanatory and dummy variables. The first technique is the variance inflation factor (VIF) which helps examine the association among continuous explanatory variables.
VIF is defined as follows based on Gujarat (1995):
(9)
(9)
Where: Xi is the ith quantitative explanatory variable regressed on the other explanatory variable and R2 is the determination coefficient when the variable Xi regressed on the remaining explanatory variables. Thus, if the VIF value is greater than 10, multicollinearity among the continuous explanatory variables is strong Gujarati (Citation1995).
The second technique is calculating contingency coefficients to examine the multicollinearity problem for a pair of dummy variables, calculated as follows:
(10)
(10)
where: CC is the contingency coefficient, chi-square is a random variable and n represents the total sample size used in the study. The contingency coefficient value ranges between 0 and 1 and when the contingency coefficient value is less than 0.75, the association among dummy variables is weak whereas contingency coefficients value above 0.75 shows a strong association among the dummy variables Gujarati (Citation1995).
2.4. Variables selection and related hypothesis
The aim is to analyze the variables that determine the extent of vegetable commercialization in the study area. Therefore, it is believed that several factors, including socioeconomic, demographic, and institutional considerations, influenced extent of vegetable commercialization (Amao & Egbetokun, Citation2018; Giziew, Citation2013; Rabbi et al., 2017). Socioeconomic characteristics, such as education, gender, landholding, caste/ethnicity, family size, and basic source of income determine the extent of commercialization (Feder & Umali, Citation1993; Jensen et al., Citation2014; Mariyono, Citation2017; Raut et al., Citation2011). According to Abdullah et al. (Citation2019), gender is one significant element affecting the commercialization process. Megerssa et al. (Citation2020) reported that market participation was significantly and negatively determined by the age of household heads, with a significance level of 1%. With all other variables being constant, a one-year increase in the age of the head of the household results in a 1.3% decrease in their chances of participating in vegetable marketing. Landholding is also expected to have a positive and significant impact on agriculture’s growth from subsistence to commercial farming (Ghimire et al., Citation2015; Mariyono, Citation2017; Raut et al., Citation2011). According to Kyaw et al. (Citation2018), among rice farmers, access to extension services increase the chance of market participation. Access to credit and the size and income from sources other than the agricultural operation have an impact on extent of commercialization (Abdullah et al. Citation2019; Mariyono, Citation2017; Suvedi et al., Citation2017). An irrigation facility (system) helps to maximize production and, consequently, it is critical to poverty alleviation through increased production in rural areas so as to improve food security and rural livelihoods (Belay & Bewket, Citation2013). Therefore, it was expected to have positive effects on the extent of commercialization. Access to improved seed is expected to have positive effect on extent of vegetable commercialization. Tilahun et al. (Citation2019) reported that when household heads have access to improved seeds, their probability of selling their produce increases by 17.4%. A study by David-Benz et al. (Citation2016) examined 582 respondents in Madagascar and found that although very few farmers have cell phones, they revealed that farmers who have access to market information on their phones are more engaged in the market. They concluded that market information should be distributed through a variety of communication channels, such as radio, television, and so on.
Thus, based on the literature reviews, the demographic, socioeconomic, institutional, and production-related factors determining vegetable commercialization were selected and the hypothesized signs of the variables associated with the dependent variable were projected ().
Table 1. Definition, measurement, and expected signs of variables.
3. Results and discussions
3.1. Socioeconomic and demographic characteristics of sample households
The results of the study revealed that 90.6% of the respondents were male producers while 9.4% of the respondents were female (). From the results, it can be deduced that vegetable production and marketing activities are practiced primarily by males with very little involvement from women. Only a small percentage of respondents (6.3%) in the study area did not use pesticides while 97.7% used pesticides. This demonstrates that pests are common in crop fields and that the use of pesticides is a requirement when growing vegetables. When asked about access to irrigation facilities, 45.7% of respondents said they had access to them, while the majority of respondents (54.3%) stated that they did not. The results also revealed that only 14% of respondents engaged in off-farm activities. Furthermore, 47% of the respondents were identified as members of a cooperative, indicating that the majority of producers in the study area did not belong to a cooperative. Additionally, 10.6% of the respondent households practiced intercropping various vegetables. The producers of vegetables in the study area intercrop onions with Ethiopian cabbage (kale), tomatoes with Ethiopian cabbage, and potatoes with Ethiopian cabbage. According to the information gathered during focus group discussions with producers and the results of the field observations, producers practice intercropping to effectively use land resources by utilizing the open spaces between planting rows. This is a commendable practice that assists farmers in increasing crop yield per unit of land area and serving as crop insurance if it fails due to disease or another natural phenomenon.
Table 2. Summary statistics of the sample households (dummy variables).
The results also indicated that 56.4% of respondents had access to an extension services, compared to the remaining sample respondents who did not (). Producers who have access to extension services are beneficial in that they obtain improved agricultural technology (improved seed, fertilizers, machinery) and training regarding good agronomic practices for improved yield and postharvest management. In addition, 50.4 and 43.64% of respondents replied that they had access to improved seed and chemical fertilizers respectively. Likewise, 47.8% of the respondents had access to the market for their vegetable output while the remaining (52.2%) lacked market access (). This shows that producers in the study area face difficulties finding a market for their produce although the area is very close to the capital city’s market. This problem was raised during a focus group discussion with producers and who claimed that brokers hinder the process of the market where potential buyers (traders) are not allowed to contact farmers directly. Moreover, 52.7% of the sample households reported having access to market information, compared to 46.3% who did not (). The market information provided by traders and other market participants is not as valid for producers as claimed, and there are very few reliable sources of market information (i.e. extension agents and trade and market development office), according to an interview with experts from the trade and market development office and information from focus group discussions.
Access to credit services, source of credit, and intent to obtain credit were examined (). As a result, Edir (11.9%) and credit and saving institutions (5.5%) were the primary sources of credit services for 27.3% of respondents who had access to them. Strong Edir among smallholder farmers in the study area enables smallholders to obtain credit services. The Cooperative Bank of Oromia (COOP Bank) and Oromia Credit and Saving Association (OCSSCO) are financial institutions that provide small amounts of credit for smallholder farmers in the study area, according to focus group discussions and household survey data. The study results also indicated that 13% of the respondents received credit services to purchase fertilizer, 11.7% to purchase vegetable seeds, and 2.6% to purchase draft animals ().
Table 3. Credit service access, sources, and the purpose of receiving credit.
The results of the descriptive statistics for continuous variables are presented in to draw a set of conclusions from them. According to the results, the mean age was 45.43 with a standard deviation of 10.72. This result proves that smallholders in the study area are at a productive age, which benefits vegetable farming output and productivity. The respondents’ average years of experience were roughly 12 years, with the maximum and minimum experiences in vegetable farming being 1 year and 50 years, respectively. Vegetable farming has been practiced for a long time, as indicated by 50 years of experience; however, one year of experience reveals that there are new entrants to vegetable production in the study area.
Table 4. Summary statistics of the sample households (continuous variables).
Besides, the sample household’s average number of years spent in school was 4.8, with a standard deviation of 4.64. To quickly adapt to new technologies, analyze production data, actively participate in markets and implement better agronomic practices on their farms, educated producers must come from households with high levels of education (Dassa et al., Citation2019; Wongnaa et al., Citation2022). Similarly, with a standard deviation of 2.84, the sample households in the study area had an average family size of approximately 6. This demonstrates that the sample households in the study area have larger families than the national average of 4.6 members per household (Martey et al., Citation2012). On the other hand, it was discovered that for the respondents, the average distance to the market and the main road was respectively 13.58 and 3.55 kilometres. The result also showed that the average livestock holding size of the sample households was 7.51, with a standard deviation of 6.26 (). Additionally, the sample households’ mean average land holding size in the study area was 2.81 hectares, with a standard deviation of 2.14. This demonstrates that households in the study area had a larger land holding than the 1.17-hectare national average for a household (CSA, Citation2014). The results also revealed that the land allocated to vegetable production was on average 0.98 hectares, which means that about 34.9% of the land owned by the respondents was allotted to vegetable production.
3.2. Types of vegetables dominantly grown and their share of production
The data has been collected to identify the types of vegetables, which are grown most dominantly, and the production share of each crop in the area being studied. Consequently, the main crops cultivated in the study area were onion, garlic, tomato, cabbage, potato, habesha gomen (Kale), beetroots, and carrots (). Given the percentage of land used for vegetable cultivation, 3 vegetables accounted for nearly 58% of the total acreage. Accordingly, 25, 19.9, and 13.4%, respectively, of the total area allotted to vegetable cultivation was devoted to the production of cabbage, onions, and tomatoes. During the growing season of 2021/22, cabbage, onion, and tomato constituted 67.7% of the total quantity of vegetables produced in the study location. Thus, the three vegetables that were most dominant in terms of cultivation were tomato, onion, and cabbage. According to Schreinemachers et al. (Citation2018), due to their extensive use, tomatoes, onions, and cabbage are important vegetables for the world economy. According to Hanadi et al. (Citation2018), farmers are more willing to grow tomatoes than any other vegetable crop because of their multiple harvest opportunities and substantial market demand. Due to its ability to enhance growers’ well-being and economic standing, onion is also preferred for production (Hussain et al., Citation2012).
Table 5. Types of vegetable crops dominantly grown and their share of production in the study area.
3.3. Status of vegetable commercialization
3.3.1. Commercialization indices of major vegetables
Vegetable commercialization indices (CI) were calculated for each of the vegetables primarily grown in the study area (). Accordingly, the potato was the most commercialized vegetable crop (CI = 84.2%), followed by cabbage (CI = 83.4% CI), tomato (CI = 81.9%), and onion (CI = 78.7%). The results revealed that smallholders in the study area sold more potatoes, cabbage, tomatoes, and onions than other vegetable crops. The vegetable commercialization level was found to be high (CI = 74.2%) compared to the national average of 64% share of vegetable output marketed (Minot et al., Citation2022). This may be attributable to the study area’s climate being conducive to the production of a wide variety of vegetables as well as its proximity to the market, producers’ awareness of the profitability of the vegetable business, and producers’ awareness of production and marketing factors. This result corroborates that of Hailu et al. (Citation2015) who carried out a study in the Tigray Woredas of Enderta and Kilteawlaelo and reported high vegetable commercialization of 80% compared to cereal (15%) and pulse (25%) crops. Similarly, in their study of home-garden commercialization and its effect on food security in Indonesia, Abdoellah et al. (Citation2020) reported 80.56% of vegetable commercialization.
Table 6. Commercialization Indices vegetables.
3.3.2. Level of vegetable commercialization
In , smallholders’ vegetable commercialization levels in the study area were presented. Different studies (Abera, Citation2009; Ayele et al., Citation2021; Mamo et al., Citation2017; Musah et al., Citation2014), have revealed that the commercialization level is divided into three categories (0-25%, 25-50%, and >50%) based on the volume of output supplied to market. However, in this study, household vegetable commercialization levels were grouped into four categories based on Kissoly et al. (Citation2020). Accordingly, household vegetable commercialization level was categorized into subsistence level if the household sells less than 1/4th (<25%) of vegetable outputs, low commercialization level if the household sells 1/4th–2/4th (25–50%) of vegetable outputs, medium commercialization if the household sells 2/4th–3/4th (50–75%) of vegetable outputs and high commercialization level if the household sells more than 3/4th (>75%) of vegetable outputs. The result of the study indicated that 74.81, 17.14, and 6.23% of the sample households in the study area were commercialized at high, medium, and low levels respectively whereas 1.82% of the households were operating at subsistence level (). This shows that the majority of households in the study area conducted market-oriented vegetable production and that more than 3/4th of their vegetable was supplied to the market. This study supports Senbeta’s (Citation2020) findings that 67% of potato growers in Ethiopia’s Kofele district fell into the category of highly commercialized producers because they sold 74.19% of the total potatoes they produced. The result is also in line with that of Emilola et al. (Citation2016), who found that 83.91% of households in southwest Nigeria operated at a high commercialization level with an average of 84% sales of crop output of their total volume of production.
Table 7. Household commercialization status.
A household’s level of commercialization can also be measured by the share of land devoted or allocated to a particular crop (Poulton, Citation2017). According to the study results, out of the total household land holding size of 1082.07 hectares, the sample households in the study area allotted 376.8 hectares of land (34.82%) for vegetable production (). This showed that the vegetable commercialization level in the study area is low (34.82%) in terms of the share of land allocated to vegetable production, which was below 2/4th of the total household land holdings. The result shows that vegetable commercialization in terms of the share of land under vegetable production requires intervention to utilize most of the available land resources. M’ithibutu et al. (Citation2021) reported that the proportion of land set aside for vegetable production has a significant impact on the commercialization of vegetables in Kenya. A similar study by Molla (Citation2022) reported that as land allotted to red peppers increased by one hectare, household market participation increased by 35.6%.
Table 8. Vegetable commercialization level by share of land allocation.
3.4. Determinants of vegetable commercialization level
Before running the truncated tobit model, a multicollinearity test was conducted for the continuous and discrete explanatory variables. The results of the multicollinearity test for the continuous variables indicated that the mean variable inflation factor (VIF) was 1.39. Since the value of VIF is below 10, this confirms that there was no significant multicollinearity problem among the continuous variables. The contingency coefficient value for discrete explanatory variables was found to be 0.12, indicating that there was no significant association between the pair variables as the value of the contingency coefficient was less than 0.75.
The results of the censored Tobit model analysis showed that the level of vegetable commercialization was positively and significantly influenced by the gender of the household, education level, family size, use of pesticides, access to irrigation facilities, cooperative membership, access to credit services, contact with extension agents, access to improved seeds, access to chemical fertilizers, and access to market information, while it was negatively and significantly influenced by the age of the household head, livestock holding size and participation in off-farm activities ().
3.4.1. Gender of household head
The results indicated that the gender of the household head significantly and positively influenced the extent of vegetable commercialization at a 10% significance level (). The results indicated that vegetable commercialization extent increases by 3.4% for households headed by male. This result is consistent with Lykun and Jema’s (Citation2014) finding that male-headed households have better access to information than female-headed households do, allowing them to manage their farms and supply more output for the market. Kahenge et al. (Citation2019) also reported that the soybean household commercialization increased by 13.9% for male-headed households relative to female headed households. The results of the study also confirm those of Zondi et al. (Citation2022), who identified the household head’s gender as a key factor in marketing indigenous crops in South Africa. Moreover, the result is consistent with that of Ayele et al. (Citation2021), who discovered that household head gender had a positive and significant impact on the degree of cereal crop commercialization among smallholders in Ethiopia’s Guji Zone.
Table 9. Parameter estimates of the two-limit Tobit model for output commercialization determinants.
3.4.2. Age of household head
At the 1% significance level, the age of the household head significantly and negatively affected the household level of vegetable commercialization (). The result showed that as an additional year added to the households’ head, the extent of vegetable commercialization decrease by 0.2%. The ability of households to quickly adopt new agricultural technology declines as their age increases and it becomes more difficult for them to implement new extension packages (Geoffrey et al., Citation2014). This result is consistent with Workineh and Michael (Citation2002) assertion that the efficiency and productivity of the household tend to decline as family heads get aged. This result is also in line with Bekele and Alemu (Citation2015) study, which found that the age of the household head had a negative and significant impact on the level of household haricot bean commercialization.
3.4.3. Household head years of schooling
At a 5% level of significance, the households’ years of schooling had a significant and positive effect on the commercialization of vegetables (). The result revealed that level of vegetable commercialization increases by 1% for every additional year of education attained by household head. This suggests that the capacity to analyze and plan profitable farming business type’s increases as the education level of the household head increases (Megerssa et al. Citation2020). Households with more education are better able to adapt to new farming techniques and marketing strategies. The results of the study are consistent with those of Mamo et al. (Citation2017), Addisu (Citation2018), Meleaku et al. (Citation2020), and Wassihun et al. (Citation2020), who found that the level of formal education increased the level of commercialization of wheat, teff, sorghum, and maize.
3.4.4. Family size of household
At the 1% level of significance, the sample family size had a significant and positive effect on the level of commercialization of vegetables (). This shows that the level of vegetable commercialization increases by 0.6% for every additional adult member in a household. This demonstrates that having a large family size enables farmers grow more vegetables and market their yield (Martey et al. Citation2012). This result is consistent with the findings of Kahenge et al. (Citation2019) who found that a household’s family size has a positive and significant contribution to the commercialization level at a 5% level of significance. The results of this analysis, however, are at odds with those of Siziba et al. (Citation2011), who confirmed that the likelihood of a household selling its outputs for more than it needs for consumption decreases as the size of the family increases. The result also disagrees with that of Kyaw et al. (Citation2018), who discovered that household size had a significant and negative effect on the level of commercialization, with larger families requiring more food for consumption than is available on the market.
3.4.5. Access to irrigation facilities
The results of the study demonstrated that, at a significance level of 1%, having access to irrigation facilities had significant and a positive impact on the level of vegetable commercialization (). The result indicated that for household heads having access to irrigation facilities, level of vegetable commercialization increases by 4.3% than households without such access. This suggests that investing in irrigation infrastructure will help vegetables become more commercially viable. This result concurs with that of Ater et al. (Citation2021), who discovered that in South Sudan, the level of farmer commercialization rises by 7.82% for every unit increase in access to irrigation facilities. The results also support the findings of Tufa et al. (Citation2014), who found that access to irrigation facilities had a significant effect on smallholder farmers’ decisions to participate.
3.4.6. Participation in off-farm activities
The results demonstrated that household involvement in off-farm activities significantly and negatively influenced the commercialization of household vegetables at the 1% level of significance (). The result revealed that a unit additional household head income from off-farm activities other than vegetable farming, extent of vegetable commercialization decreases by 7.9%. This occurs when a household’s income rises from off-farm income sources, the households are not encouraged to engage in or produce vegetables. This result is consistent with Gebre et al. (Citation2021) finding that off-farm activities significantly and negatively affect sorghum commercialization at the 1% level of significance. In contrast with this study, Wassihun et al. (Citation2020) reported that the participation of households in off-farm activities positively and significantly influenced maize commercialization levels, which is in contrast with the finding of this study.
3.4.7. Cooperative membership
At the 5% level of significance, membership in cooperatives had a significant and positive effect on the level of vegetable commercialization (). The result showed that, for household heads those who are member of cooperative, commercialization level raises by 2.8% than those who are not member of cooperative. Household heads that are member to cooperative have better access to resources, information, and opportunities for bargaining when selling the vegetables they grow. According to a 2019 study by Kahenge et al., belonging to a cooperative had a positive effect on the commercialization of soybeans in Eastern Zambia. The finding of this study are also consistent with those of Moono (Citation2015) and Agwu et al. (Citation2013), who claim that belonging to an organization increases a farm household’s bargaining power and gives them access to better inputs and market information.
3.4.8. Tropical livestock unit (TLU)
At the 1% level of significance, the size of the TLU had a significant and negative influence on the commercialization of vegetables (). The result revealed that as the TLU increased by one unit, the extent of vegetable commercializing decreases by 0.6%. This shows how households with large livestock holdings allocate their land to raising livestock, which may result in less land being used for vegetable production. The results of this study corroborate the findings of Wassihun et al. (Citation2020) who found that the tropical livestock unit (TLU) had a significant and negative effect on maize commercialization in Northwestern Ethiopia. Incntrast to this finding, livestock holding was also found that having livestock had a favorable, statistically significant impact on the extent of commercialization of potatoes at the 10% level. Similarly, Kahenge et al. (Citation2019) found that a unit increase in livestock holding size decreases extent of commercialization by 12.7%.
3.4.9. Access to credit services
The results revealed that, at the 1% level of significance, access to credit services significantly and positively influenced the level of commercialization of vegetable output (). The result indicated that as access to credit service increases, the extent of vegetable commercialization increases by 3.8% that who do not have this access. To increase access to inputs such as seeds, fertilizer, and other farming technologies that help increase production and the quantity of marketable surplus, credit services are crucial for the commercialization of vegetables. This result is consistent with that of Mbitsemunda and Karangwa (Citation2017), who found that smallholders’ likelihood of participating in bean marketing in Rwanda’s Southern Province was positively impacted by access to credit services.
3.4.10. Access to extension services
At the 1% significance level, extension services had a significant and positive influence on household-level vegetable commercialization (). The result showed that as households’ head access to extension services increases, level of vegetable commercialization increases by 4.6%. Extension services can change or raise knowledge and awareness levels in smallholder households so they boosting production and productivity, taking an active role in markets, and commercializing vegetable production. Research by Ojo and Baiyegunhi (Citation2020) in the South African provinces of Limpopo and Mpumalanga on farmers’ choice to adopt a climate change strategy revealed that extension services enhanced farmers’ understanding, led to high production, increased the likelihood of market participation, and commercialized indigenous crops. Similar results were reported by Endalew et al. (Citation2020), who discovered that the commercialization of wheat in Ethiopia’s Debre Elias Woreda was significantly and positively influenced by extension services. The study’s findings show that households with access to extension services increased their level of commercialization by 5.92% compared with households without such access. The findings of this study are consistent with those of Osmani and Hossain (Citation2015), who claim that extension services can improve farmers’ market orientation. Another study indicated that the level of Ethiopian smallholder participation in banana markets was significantly affected by the development of agricultural extensions (Getahun et al., Citation2017).
3.4.11. Access to improved seeds
The results revealed that, at a 1% level of significance, access to improved seeds had a significant and positive effect on the level of vegetable commercialization (). The findings indicated that level of vegetable commercialization increases by 3.7% as improved seed access by smallholder households’ head increases. For smallholder farmers, improved seeds are essential components of commercialized farms and play a critical role in raising productivity and yield quality. In agreement with this finding, Kumilachew (Citation2016) found that access to improved seeds had a 10% significant effect on the commercialization level of potatoes. The author claimed that having access to improved seeds increased outputs that were sold on the market or used for home consumption while also increasing productivity and quality. A similar conclusion was reached by Tilahun et al. (Citation2019), who found that access to improved seeds had a positive and significant influence on the commercialization level of pulses at the 1% level of significance. The result also corroborates Gurung et al. (Citation2016) who reported that access to improved vegetable seeds important for adoption of commercial farming among vegetable growers.
3.4.12. Access to chemical fertilizers
The findings showed that, at a 5% level of significance, access to chemical fertilizers had significant and a positive influence on the level of vegetable commercialization (). The result revealed that as smallholder households’ head access to chemical fertilizers increases, the extent of vegetable commercialization increases by 2.5%. This result is consistent with that of Sida et al. (Citation2021), who reported that the application of chemical fertilizers had a significant and positive effect on the level of crop commercialization at a 1% level of significance. Getachew (Citation2018) also found that teff farming households that used chemical fertilizer saw a 24% increase in commercialization. Alelign (Citation2018) reported similar results that the use of chemical fertilizers increased crop commercialization by 2.41% at a significance level of 1%. The result conform finding of Shrestha and Karki (Citation2017) who found that access to chemical fertilizers enhances adoption of commercial vegetable farming among smallholder vegetable producers.
3.4.13. Access to market information
The results indicated that, at the 1% level of significance, access to market information had a statistically significant and positive effect on the level of commercialization (). Compared to households without access to market information, households with access to market information increase their level of vegetable commercialization by 6%. Market information is an effective marketing instrument that assists smallholder farmers in having sufficient knowledge about where to sell, at what price to sell, to whom to sell, the amount needed, and the feasible means of transport for the vegetables they produce. According to Kyaw et al. (Citation2018), access to market information has a significant and positive effect on the amount of rice sold at the market. The study’s findings also showed that farmers’ knowledge of the market and their ability to plan sales and the quantity of rice to be sold could both be improved with access to market information. This result also corroborates Zondi et al. (Citation2022) who found that access to marketing information has a positive and statistically significant influence on commercialization among indigenous vegetable farmers in Limpopo and Mpumalanga province of South Africa. According these authors, farmers require such information to make an appropriate decision on the quantity of produce to market and the price to charge and also to have an idea of the market competition.
4. Conclusion and recommendations
Producing vegetables helps to reduce poverty by generating jobs, enhancing food choices, and providing potentially new career prospects for disadvantaged farmers. Increasing vegetable production and the extent of commercialization contributes to the rural economy, smallholder farmers’ livelihoods and food security. This study assessed the extent and determinants of vegetable commercialization among smallholders in Ethiopia, Sebeta Hawas Woreda. The study results revealed that vegetable production in Sebeta Hawas Woreda is commercialized in terms of vegetable output sold (74.2%). However, there are significant differences among smallholder households in terms of vegetable commercialization extent (CI from 22 to 97%) and commercialization extent is at a low level in terms of land share (34.82%) allocated to vegetable production. This shed light on the area of intervention by the government and other concerned stakeholders to encourage households with a low extent of vegetable commercialization so that they will be empowered to produce and supply more output to the markets.
The results of the truncated Tobit regression model revealed that the extent of vegetable commercialization was positively and significantly influenced by the gender of the household, education level, family size, access to irrigation facilities, cooperative membership, access to credit services, contact with extension agents, access to improved seeds, access to chemical fertilizers, and access to market information. Conversely, the age of the household head, livestock holding size, and participation in off-farm activities influenced the extent of vegetable commercialization negatively and significantly.
Based on the study’s findings, it is suggested that increasing accessibility of farm inputs like improved vegetable seeds, chemical fertilizers, pesticides, and cost-effective irrigation equipment are the most important priority areas as these production variables had a significant and positive effect on the extent of vegetable commercialization. This can be done by governmental agricultural research institutes and private seed and agro-input companies. Government policy should consider the continuous upgrading of skills and motivating extension workers so that they can regularly visit and monitor the improvements made by farm households regarding extension packages. Besides, emphasizing means of enhancing credit and saving services, linking the smallholder farmers to financial institutions, and formulating policies that support them, even in situations where they lack collateral evidence, is the key to the enhanced extent of vegetable commercialization. Encouraging smallholder farmers to become cooperative members can also help them to access credit services, farm inputs and potential markets. The government might also design gender-oriented training and intervention programs to ensure equal participation of both men and women in the vegetable business. Moreover, the government can support a higher extent of vegetable commercialization by providing adequate and pertinent market information for smallholders using information dissemination alternatives like paper flyers, pamphlets, TV, mobile applications, radios, and short text messages.
It is alleged that the present study is not free from some limitations. First, some important data were collected by relying on the opinions and responses of the smallholder farmers which the technique employed may limit the robustness of the study’s results. Second, in this study, cross-sectional survey data were used and did not consider the dynamic nature of agricultural commercialization through time which can be better addressed via longitudinal studies. Therefore, the abovementioned limitations should be kept in mind when evaluating the conclusion of the study. Furthermore, researchers are encouraged to investigate factors determining the extent of vegetable commercialization using various variables and time series data using larger sample sizes covering wider geographic areas.
Ethical approval
The authors declare that they followed the ethics policies and standards of the journal.
Acknowledgement
We would like to thank the Ethiopian Ministry of Science and Higher Education for funding our research. We also thank Sebeta Hawas Woreda for supporting us in the process of data collection.
Disclosure statement
No potential conflict of interest was reported by the author(s).
Data availability statement
Data can be made available based on reasonable request
Additional information
Funding
Notes on contributors
Asfaw Shaka Gosa
Asfaw Shaka is PhD student at College of Development Studies, Center for Food Security Studies, Addis Ababa University, Ethiopia. He is a Lecturer, researcher and a consultant. His areas of research focus include agribusiness and value chains, food and nutrition security, farm management, climate change and sustainability.
Tebarek Lika Megento
Tebarek Lika (PhD) is an academic staff member of the Department of Geography and Environmental Studies at Addis Ababa University, Ethiopia. He is associate professor and researcher in the same university. His research focus includes agricultural value chain, livelihood, climate change, poverty, and food security.
Meskerem Abi Teka
Meskerem Abi is an Assistant Professor at the Centre for Food Security Studies in the College of Development Studies, Addis Ababa University, Ethiopia. Her research and teaching areas focus on food security, right to food and social protection, sustainable land management, sustainable agriculture, climate change and variability, vulnerability and resilience, social capital, farmers’ knowledge and strategies, institution, and policy.
References
- Abdoellah, O. S., Schneider, M., Nugraha, L. M., Suparman, Y., Voletta, C. T., Withaningsih, S., Heptiyanggit, A., Hakim, L., & Parikesit. (2020). Home-garden commercialization: Extent, household characteristics, and effect on food security and food sovereignty in rural Indonesia. Sustainability Science, 15(3), 1–19. https://doi.org/10.1007/s11625-020-00788-9
- Abdullah, R. F., Ahamad, R., Ali, S., Chandio, A. A., Ahmad, W., Ilyas, A., & Din, I.-U. (2019). Determinants of commercialization and its impact on the welfare of smallholder rice farmers by using Heckman’s two-stage approach. Journal of the Saudi Society of Agricultural Sciences, 18(2), 224–233. https://doi.org/10.1016/j.jssas.2017.06.001
- Abera, G. (2009). Commercialization of Smallholder Farming: Determinants and Welfare Outcomes, A cross Sectional Study in Enderta District, Tigray, Ethiopia Haramaya University. Master Thesis
- Abu, B. M. (2015). Groundnut Market Participation in the Upper West Region of Ghana. Ghana Journal of Development Studies, 12(1-2), 106–124. https://doi.org/10.4314/gjds.v12i1-2.7
- Addisu, G. T. (2018). Determinants of commercialization and market outlet choices of Tef: The case of smallholder farmers in Dendi district of Oromia, Central Ethiopia [Master Thesis]. Haramaya University.
- Adish, A. (2012). Micronutrient deficiencies in Ethiopia: Present situation and way forward. http://www.epseth.or/a/files/Micronutrient%20Deficiencies%20in%Ethiopia.pdf (accessed 23 November 2022).
- Agwu, N. M., Anyanwu, C. I., & Mendie, E. I. (2013). Socioeconomic determinants of commercialization among smallholder farmers in Abia State.
- Alelign, A. (2018). Crop productivity, efficiency and commercialization of smallholder farmers in highlands of Eastern Ethiopia [Ph.D. Dissertation]. Haramaya University.
- Amao, I. O., & Egbetokun, O. A. (2018). Market participation among vegetable farmers. International Journal of Vegetable Science, 24(1), 3–9. https://doi.org/10.1080/19315260.2017.1346030
- ATA (Agricultural Transformation Agency). (2014). Agricultural transformation agenda (annual report).
- Ater, E. A., Benjamin, K. M., & Hillary, K. B. (2021). Factors influencing commercialization of horticultural crops among smallholder farmers in Juba, South Sudan. Journal of Economics and Sustainable Development, 12(14), 45–56. https://doi.org/10.7176/JESD/12-14-05
- Ayele, T., Dagnaygebaw, G., & Haile, T. (2021). Determinants of cereal crops commercialization among smallholder farmers in Guji Zone, Ethiopia. Cogent Food & Agriculture, 7(1), 1948249. https://doi.org/10.1080/23311932.2021.1948249
- Bekele, A., & Alemu, D. (2015). Farm-level determinants of output commercialization: In the case of Haricot bean based farming systems. Ethiopian Journal of Agricultural Science, 25(1), 61–69. https://www.ajol.info/index.php/ejas/article/view/142999/132743.
- Belay, M., &Bewket, W. (2013). Traditional irrigation and water management practices in highland Ethiopia: Case study in Dangila Woreda. Irrigation and Drainage, 62(4), 435–448. https://doi.org/10.1002/ird.1748
- Braun, J. & Diaz-Bonilla, E. (2008). Globalization of agriculture and food: Causes, consequences and policy implications. Oxford University Press.
- Chanyalew, D., Adenew, B., & Mellor, J. (2010). Ethiopia’s agricultural sector policy and investment framework: Ten-year roadmap (2010–2020) (pp.12–22).
- CSA. (2020). Agricultural sample survey. Report on area and production of major crops (Private Peasant House Holdings, Meher Season). Statistical bulletin number 587. Central Statistical Agency, Addis Ababa, Ethiopia. https://www.statsethiopia.gov.et/wp-content/uploads/2020/04/Report-on -Area-and-production-of-major-crops-2012-E.C-Meher-season.pdf (accessed 31 May 2022).
- CSA. (2014). Central statistical sample survey. Report on area and production of major crops. Statistical bulletin number 532. Central Statistical Agency, Addis Ababa.
- Dassa, A. R., Lemu, B. E., Mohammad, J. H., & Dadi, K. B. (2019). Vegetable production efficiency of smallholders farmer in West Shewa Zone of Oromia National Regional State, Ethiopia. American International Journal of Agricultural Studies, 2(1), 39–51. https://doi.org/10.46545/aijas.v2i1.112
- David-Benz, H., Andriandralambo, N., Soanjara, H., Chimirri, C., Rahelizatovo, N., & Rivolala, B. (2016). Improving access to market information: A driver of change in marketing strategies for small producers? EAAE.
- EDHS. (2012). Ethiopia demographic and health survey report. Ethiopia Demographic and Health Survey.
- Ejeta, B., & Masresha, D. (2020). Determinants of red bean commercialization by smallholder farmers in Shalla districts, Oromia Regional State, Ethiopia. Agriculture, Forestry and Fisheries, 9(6), 153–162. https://doi.org/10.11648/j.aff.20200906.11
- Emilola, O. C., Kemisola, A. O., & Alawode, O. O. (2016). Assessment of crop commercialization among smallholder farming households in Southwest Nigeria. International Journal of Scientific Research in Science and Technology, 2(6), 478–486. https://doi.org/10.32628/ijsrst162694
- Endalew, B., Aynalem, M., Assefa, F., & Ayalew, Z. (2020). Determinants of wheat commercialization among smallholder farmers in Debre Elias Woreda, Ethiopia. Advances in Agriculture, 2020, 1–12. https://doi.org/10.1155/2020/2195823
- Eshetu, G. (2018). Commercialization of smallholder Teff producers in Jamma District, South Wollo Zone, Ethiopia [M.Sc. Thesis]. Haramaya University.
- Ethiopian Horticulture Development Agency (EHDA). (2012). Exporting fruits and vegetables from Ethiopia: Addis Ababa. https://www.diversityabroad.com/adminstrator/userpics/userimage9194.pdf.
- Feder, G., & Umali, D. L. (1993). The adoption of agricultural innovations: A review. Technological Forecasting and Social Change, 43(3-4), 215–239. https://doi.org/10.1016/0040-1625(93)90053-A
- Gari, A. G. (2017). Determinants of smallholders wheat commercialization: The case of Gololcha District of Bale Zone, Ethiopia [Master Thesis]. University of Gonder.
- Gebre, E., Workiye, A., & Haile, K. (2021). Determinants of sorghum crop commercialization: The case of Southwest Ethiopia. Heliyon, 7(7), e07453. https://doi.org/10.1016/j.heliyon.2021.e07453
- Geoffrey, S., Hillary, B., & Lawrence, K. (2014). Determinants of market participation among smallscale pineapple farmers in Kericho County. Kenya.
- Getachew, E. (2018). Commercialization of smallholder Teff producers in Jamma District [Master Thesis]. Haramaya University, South Wollo Zone, Ethiopia.
- Getahun, K., Yigezu, E., & Desalegn, A. (2017). Determinants of smallholder market participation among banana growers in Bench Maji Zone, Southwest Ethiopia. International Journal of Agricultural Policy Research, 5(11), 169–177. https://doi.org/10.15739/IJAPR.17.020
- Ghimire, R., Huang, W., & Shrestha, R. B. (2015). Factors affecting adoption of improved rice varieties among rural farm households in Central Nepal. Rice Science, 22(1), 35–43. https://doi.org/10.1016/j.rsci.2015.05.006
- Giziew, A. (2013). Determinants of market supply of vegetables: A case of Akaki-Kality sub-city, Ethiopia. Journal of Rural Development, 32(3), 281–290. http://nirdprojms.in/index.php/jrd/article/view/93323
- Gujarati, D. N. (1995). Basic economics (3rd Edition). McGraw-Hill Inc.
- Gurung, B., Regmi, P. P., Thapa, R. B., Gautam, D. M., Gurung, G. M., & Karki, K. B. (2016). Impact of PRISM approach on input supply, production and produce marketing of commercial vegetable farming in Kaski and Kapilvastu district of western Nepal. Research & Reviews: Journal of Botanical Sciences, 5(4), 34–43.
- Gutu, T. (2017). Climate change challenges, smallholders’ commercialization, and progress out of poverty in Ethiopia (Working Paper Serious No 253). African Development Bank.
- Hagos, A., & Geta, E. (2016). Review on smallholder agriculture commercialization in Ethiopia: What are the driving factors to focus on? Journal of Development and Agricultural Economics, 8(4), 65–76. https://doi.org/10.5897/JDAE2016.0718
- Hailu, G., Manjure, K., & Aymut, K. (2015). Crop commercialization and smallholder farmers’ livelihood in Tigray Region. Ethiopia. Journal of Development and Agricultural Economics, 7(9), 314–322. https://doi.org/10.5897/JDAE2015.0649
- Hanadi, E. A., Mohammed, I. M., & Salih, E. E. (2018). Value chain analysis for tomato production and marketing in Khartoum state. Sudan.Current Investigation in Agriculture and Current Research, 5(4), 651–657.
- Hussain, A., Farooq, S. U., & Khan, K. U. (2012). Aggressiveness and conservativeness of working capital: A case of the Pakistani manufacturing sector. European Journal of Scientific Research, 73(2), 171–182.
- Jensen, P. P., Picozzi, K., de Almeida, O. C. M., da Costa, M. J., Spyckerelle, L., & Erskine, W. (2014). Social relationships impact adoption of agricultural technologies: The case of food crop varieties in Timore-Leste. Food Security, 6(3), 397–409. https://doi.org/10.1007/s12571-014-0345-5
- Kahenge, Z., Muendo, K., & Nhamo, N. (2019). Factors influencing crop commercialization among soya bean smallholder farmers in Chipata District, Eastern Zambia. Journal of Agriculture Science and Technology, 19(1), 13–31. https://ojs.jkuat.ac.ke/index.php/JAGST/article/view/2.
- Kissoly, L., Fasse, A., & Grote, U. (2020). Intensity of commercialization and the dimensions of food security: the case of smallholder farmers in rural Tanzania. Journal of Agribusiness in Developing and Emerging Economies, 10(5), 731–750. https://doi.org/10.1108/JADEE-06-2019-0088
- Kothari, C. R. (2004). Research methodology: Methods and techniques (2nd Edition). New Age International.
- Kristen, J., Mariam, M., Julius, O., & Sourovi, D. (2012). Managing agricultural commercialization for inclusive growth in sub-Saharan Africa. The Global Development Network (GDN).
- Kumilachew, A. M. (2016). Commercial behavior of smallholder potato producers: The case of Kombolcha Woreda, Eastern Part of Ethiopia. UDC 633.49: 631.1.017.3:330.13 (63).
- Kyaw, N. N., Ahn, S., & Lee, S. H. (2018). Analysis of the factors influencing market participation among smallholder rice farmers in Magway region, central dry zone of Myanmar. Sustainability, 10(12), 4441. https://doi.org/10.3390/su10124441
- Leavy, J., Poulton, C., & Poulton, C. (2008). Commercialization in agriculture. Ethiopian Journal of Economics, 16(1), 3–42. https://doi.org/10.4314/eje.v16i1.39822
- Liu, X., Wang, Z., & Wu, Y. (2013). Group variable selection and estimation in the Tobit censored response model. Computational Statistics & Data Analysis, 60, 80–89. https://doi.org/10.1016/j.csda.2012.10.019
- Lykun, B., & Jema, H. (2014). Econometrics analysis of factors affecting market participation of smallholders farming in Central Ethiopia (MPRA Paper No. 77024). posted February 28, 2017: 17: 21 UTC. https://mpra.ub.uni-muenchen.de/77024.
- M’ithibutu, M. J., Gogo, E. O., Mangale, F. L., & Baker, G. (2021). An evaluation of the factors influencing vegetable commercialization in Kenya. International Journal of Agriculture, 6(1), 1–19. https://doi.org/10.47604/ija.1214
- Mamo, T., Getahun, W., Tesfaye, A., Chebil, A., Solomon, T., Aw-Hassan, A., Deleba, T., & Assefa, S. (2017). Analysis of wheat commercialization in Ethiopia: The case of SARD-SC wheat project innovation platform sites. African Journal of Agricultural Research, 12(10), 841–849. https://doi.org/10.5897/AJAR2016.11889
- Mariyono, J. (2017). Profitability and determinants of smallholder commercial vegetable production. International Journal of Vegetable Science, 24(3), 274–288. https://doi.org/10.1080/19315260.2017.1413698
- Martey, E., Al-Hassan, R. M., & Kuwornu, J. K. (2012). Commercialization of smallholder agriculture in Ghana: A Tobit regression analysis. African Journal of Agricultural Research, 7(14), 2131–2141.
- Mbitsemunda, J. K., & Karangwa, A. (2017). Analysis of factors influencing market participation of smallholder bean farmers in Nyanza District of Southern Province, Rwanda. Journal of Agricultural Science, 9(11), 99–108. https://doi.org/10.5539/jas.v9n11p99
- McDonald, J. F., & Moffit, R. A. (1980). The use of Tobit analysis. The Review of Economics and Statistics, 62(2), 318–321. https://doi.org/10.2307/1924766
- Megerssa, R. G., Negash, R., Bekele, A. E., & Nemera, D. B. (2020). Smallholder market participation and its associated factors: Evidence from Ethiopian vegetable producers. Cogent Food & Agriculture, 6(1), 1783173. https://doi.org/10.1080/23311932.2020.1783173
- Meleaku, T., Goshu, D., & Tegegne, B. (2020). Determinants of sorghum market among smallholder farmers in KaftaHumera District, Tigray, Ethiopia. South Asian Journal of Social Studies and Economics, 8(1), 1–13. https://doi.org/10.9734/sajsse/2020/v8i130200
- Ministry of Finance and Economic Development (MoFED). (2014). Growth and transformation plan-GTP. Annual progress report for fiscal year 2012/13. Ministry of Finance and Economic Development.
- Ministry of Finance and Economic Development (MoFED). (2010). Growth and transformation plan (GTP). 2010/11–2014/15.
- Minot, N., Warner, J., Dejene, S., & Zewdie, T. (2022). Agricultural commercialization in Ethiopia trends. Drivers, and impact on well-being (IFPRI Discussion Paper 02156).
- Minot, N., Warner, J., Dejene, S., & Zewdie, T. (2021, August 17–30). Agricultural commercialization in Ethiopia: Results from the analysis of panel household data [Paper presentation]. Agricultural transformation in Ethiopia, 31st International Conference of Agricultural Economists.
- Molla, M. (2022). Determinants of commercialization of smallholder red pepper farmers in Javiethenan District, Amhara Region, Ethiopia. Economics, 11(1), 31. https://doi.org/10.11648/j.eco.20221101.14
- Moono, L. (2015). Analysis of factors influencing market participation among smallholder rice farmers in Western Province of Kenya. Department of Agricultural Economics, University of Nairobi.
- Mordor Intelligence. (2022). Agriculture in Ethiopia-a growth, trends, COVID-19 impact, and forecast (2022–2027). https://mordorintelligence.com/industry-reports/agriculture-in-ethiopia.
- Musah, A. B., Bonsu, O. A. Y., & Seini, W. (2014). Market participation of smallholder maize farmers in the upper region of Ghana. African Journal of Agricultural Research, 9(31), 2427–2435.
- Ojo, T., & Baiyegunhi, L. (2020). Determinants of climate change adaptation strategies and its impact on the net farm income of rice farmers in Southwest Nigeria. Land Use Policy, 95, 103946. https://doi.org/10.1016/j.landusepol.2019.04.007
- Olwande, J., Smale, M., Mathenge, M. K., Place, F., & Mithöfer, D. (2015). Agri. marketing by smallholders in Kenya: A comparison of maize, kale and dairy. Food Policy, 52, 22–32. https://doi.org/10.1016/j.foodpol.2015.02.002
- Osmani, A. G., & Hossain, E. (2015). Market participation decision of smallholder farmers and its determinants in Bangladesh. Ekonomika Poljoprivrede, 62(1), 163–179. https://doi.org/10.5937/ekoPolj1501163G
- Pingali, P., Khwaja, Y., & Meijer, M. (2005). Commercializing small farmers: Reducing transaction costs (FAO/ESA Working Paper No.05-08.FAO). Food and Agriculture Organization of the United Nations.
- Poulton, C. (2017). What is agricultural commercialization; Why is it important, and how do we measure it? (Working Paper Series No. 06) Agricultural Policy Research of Africa.
- Projection. (2022). Sebeta Hawas district population statistics (projection). https://www.citypopulation.de/en/ethiopia/admin/oromia/ET042006_sebeta_hawas/.
- Raut, N., Sitaula, B. K., Vatn, A., & Paudel, G. S. (2011). Determinants of adoption and extent of agricultural intensification in the central mid-hills of Nepal. Journal of Sustainable Development, 4(4), 47–60. https://doi.org/10.5539/jsd.v4n4p47
- Reddy, P. C. S., & Kanna, N. V. (2016). Value chain and market analysis of vegetables in Ethiopia-review. International Journal of Economics and Business Management, 2(1), 90–99.
- Schreinemachers, P., Simmons, E. B., & Wopereis, M. C. S. (2018). Tapping the economic and nutritional power of vegetables. Global Food Security, 16, 36–45. https://doi.org/10.1016/j.gfs.2017.09.005
- Sebeta Hawas Agriculture and Natural Resource Office (SHANRO). (2021). Annual report; unpublished.
- Senbeta, A. N. (2020). Determinants of smallholder farmers’ commercialization of potato in Kofale District, West Arsi Zone. International Journal of Agriculture and Agribusiness, 9(2), 56–62. https://doi.org/10.11648/j.jim.20200902.13
- Shrestha, A. J., & Karki, A. (2017). Commercial vegetable farming: A new livelihood option for farmers in Udayapur, Nepal. http://www.icimod.org/?q=27109.
- Sida, A., Tessema, A., & Shibebaw, K. (2021). Determinants of smallholder crop commercialization: The case of Agarfa and Sinana Districts of Bale Zone, Southern Ethiopia. Research on Humanities and Social Sciences, 11(9), 37–47. https://doi.org/10.7176/RHSS/11-9-05
- Siziba, S., Nyikahadzoi, K., Dagne, A., Fatunbi, A., & Adekunle, A. A. (2011). Determinants of cereal market participation by Sub-Saharan Africa smallholder farmers. Journal of Agriculture and Environmental Studies, 2, 180–193.
- Strasberg, P. J., Jayne, T. S., Yamano, T., Nyoro, J., Karanja, D., & Strauss, J. (1999). Effects of agricultural commercialization on food crop input use and productivity in Kenya (No. 1096-2016-88433).
- Suvedi, M., Ghimire, R., & Kaplowitz, M. (2017). Farmers’ participation in extension programs and technology adoption in rural Nepal: A logistic regression analysis. The Journal of Agricultural Education and Extension, 23(4), 351–371. https://doi.org/10.1080/1389224X.2017.1323653
- Tefera, A. G. (2018). Determinants of commercialization and market outlet choices of Tef: The case of smallholder farmers in Dandi District of Oromia, Central Ethiopia [Master Thesis]. Haramaya University.
- Tilahun, A., Haji, J., Zemedu, L., & Alemu, D. (2019). Commercialization of smallholder pulse producers in East Gojjam Zone, Ethiopia. Journal of Sustainable Agriculture Research, 8(4), 84–93. https://doi.org/10.5539/sar.v8n4p84
- Tobin, J. (1958). Estimation of relationships for limited dependent variables. Econometrica, 26(1), 24–36. https://doi.org/10.2307/1907382
- Tufa, A., Bekele, A., & Zemedu, L. (2014). Determinants of smallholder commercialization of horticultural crops in Gemechis District, West Hararghe Zone, Ethiopia. African Journal of Agricultural Research, 9(3), 310–319. https://doi.org/10.5897/AJAR2013.6935
- Wassihun, A. N., Feleke, F. B., Abate, T. M., & Bayeh, G. A. (2020). Analysis of maize commercialization among smallholder farmers: Empirical evidence from Northwestern Ethiopia. Department of Agricultural Economics, Gondar University.
- Wongnaa, C. A., Bannor, R. K., Dziwornu, R. K., Ennin, J. I., Osei, E. A., Adzikah, C., & Charles, A. (2022). Structure, conduct, and performance of onion market in Southern Ghana. Caraka Tani: Journal of Sustainable Agriculture, 37(1), 71–88. https://doi.org/10.20961/carakatani.v37i1.51899
- Workineh, N., & Michael, R. (2002). Intensification and crop commercialization in Northeastern Ethiopia. Ethiopian Journal of Economics, 11(2), 84–107.
- Zondi, N., Ngidi, M. S. C., Ojo, T. O., & Hlatshwayo, S. I. (2022). Factors influencing the extent of the commercialization of indigenous crops among smallholder farmers in the Limpopo and Mpumalanga Provinces of South Africa. Frontier Sustainable Food System, 5, 777790.