
 ?Mathematical formulae have been encoded as MathML and are displayed in this HTML version using MathJax in order to improve their display. Uncheck the box to turn MathJax off. This feature requires Javascript. Click on a formula to zoom.
Abstract
Numerous studies have attempted to identify potential risk-factors associated with COVID-19 infection, including inter alia: age, diet, higher population density, and the quality and availability of health services. The objective of the current study is to analyze the weight of four covariates on a daily infection rate from SARS-COV2 virus. The method used is regression analysis, where each variable is converted to the standard normal distribution function. Results demonstrate that of the four investigated covariates, vaccination and population size have the highest weights. Given the empirical analysis, the most efficient way to achieve a reduction in the spread of the pandemic is via appropriate vaccination programs.
Contributions to the Literature
Numerous studies have attempted to identify potential risk-factors associated with COVID-19 infection, including inter alia: age, diet, higher population density, and the quality and availability of health services.
The contributions of this article are threefold:
We use a unique method to test the COVID-19 vaccine effectiveness. We follow the COVID-19 infection growth rate in each of the 171 Israeli municipalities, starting from 11 March 2020 (the first documentation of COVID-19 cases) until 21 September 2021, where COVID-19 vaccinations were available starting from 20 December 2020.
A unique feature of Israel is the early initiation of a nationwide vaccination campaign, which resulted in the full vaccination (i.e. receipt of two vaccine doses) in more than half the population by the end of March 2021. Consequently, Israel provides an appropriate case study to examine the efficiency of the vaccination.
The conventional empirical model uses different units of measurement of each explanatory variable. Unlike previous studies, we estimate a model with identical units of measurement, namely one standard deviation of each independent variable. This target is achieved by normalizing all the variables in the regression model.
Findings suggest vaccination as the factor providing the highest contribution to projected infection growth rate decrease. They stress the high importance of vaccination, and provide further support of vaccination efforts.
REVIEWING EDITOR:
1. Background
Coronavirus disease 2019 (COVID-19) is a declared global pandemic with multiple risk factors (World health Organization, WHO) report: coronavirus (Wu & McGoogan, Citation2020). Numerous studies have attempted to identify potential risk-factors associated with COVID-19 infection. These include inter alia: hypertension, obesity, diabetes (Shah et al., Citation2021), age (Public Health England, Citation2020), diet (Losso et al., Citation2021), higher population density (Hamidi et al., Citation2020; Chin et al., Citation2021; Velasco et al., Citation2021), the quality and availability of health services, and the timing of a lockdown policy implementation (Eliyahu & Boaz, Citation2020). This study attempts to examine the relative contribution of the following factors to the daily infection growth rate: efficiency of vaccination, population size, socio-economic ranking, and median age of 171 cities and towns, covering 80.225% of the Israeli population.
The panel dataset used in this article starts from 11 March 2020 and ends on 21 September 2021. During that period, vaccinations were available from 20 December 2020. A unique feature of Israel is the early initiation of a nationwide vaccination campaign, which resulted in the full vaccination (i.e. receipt of two vaccine doses) in more than half the population by the end of March 2021 (e.g. Bar-On et al., Citation2021). Consequently, Israel provides an appropriate case study to examine the efficiency of the vaccination.
The massive vaccination campaign and the full vaccination of half of the population by the end of March 2021 enables a credible comparison between the post and pre vaccination era. In countries with less responsive populations, this comparison is expected to be less credible.
There are several reasons for the success of the Israeli vaccination campaign. Of the 179 countries in the world, Israel is ranked 14 in terms of income per-capita and 34 in terms of Income per capita standardized to the purchasing parity power (PPP) (e.g. Worldmeter https://www.worldometers.info/gdp/gdp-per-capita/). This places Israel in the top quintile of the richest countries in the world. Given the economic possibility to finance an advanced health system and legislation providing for compulsory universal health-care insurance for all Israeli citizens (Porath & Lev, Citation1995), Israel may be considered a welfare state. The State Health Insurance Law supports a broad basket of high-quality preventive, curative, and rehabilitation health-care services.
To reduce inequalities in health, Muhsen et al. (Citation2017) mention the large scope of independent programs, initiated by various health plans, including: focusing on at-risk populations, adapting intervention measures to language, culture, literacy, and comprehension levels and lowering copayments. Similar public-relation promotion programs were applied by the Israeli Ministry of Health to speed up the COVID-19 vaccination campaign.
Forces that may inhibit the success of the vaccination campaign include: (1) the existence of pockets of ‘vaccine hesitancy’ and (2) cultural and ethnic diversity of Israel’s population (Levin-Zamir & Baron-Epel, Citation2020). Yet, the advanced health infrastructure and high availability of health-care services permits Israel to become the leading country in terms of prevalence of vaccination against SARS-COV-2 virus (persons vaccinated divided by total population). This high vaccination prevalence is crucial to avert a decline in herd immunity, which in turn prevents a reoccurrence of diseases that otherwise might be on the verge of extinction (Levin-Zamir & Baron-Epel, Citation2020).
The objective of this study is to demonstrate that among other examined characteristics, vaccination has the highest influence on the daily change of COVID-19 infection rate. The conventional empirical model uses different units of measurement of each explanatory variable. Unlike previous studies (e.g. Hamidi et al., Citation2020; da Silva Lopes, Citation2021; Arbel et al., Citation2022, Citation2023), we estimate a model with identical units of measurement, namely one standard deviation of each independent variable. This target is achieved by normalizing all the variables in the regression model.
Findings suggest vaccination as the factor providing the highest contribution to projected infection growth rate decrease. They stress the high importance of vaccination and provide further support to the recommendations in support of vaccination (e.g. Bar-On et al., Citation2021). Compared to vaccination, socioeconomics ranking of cities and towns provides the lowest negative contribution, which is smaller by a factor of 12.63. The second component providing a positive contribution is the municipal population size. This may be explained on the grounds of elevated number of interactions in more crowded cities and towns (e.g. Hamidi et al., Citation2020; Arbel et al., Citation2021; Chin et al., Citation2021; Velasco et al., Citation2021). The contributions of the median age and socio-economic ranking are smaller and equal to each other.
2. Literature review
The COVID-19 is a global pandemic that started in 2019 in the Huan province of China. A lot has been written about the risk factors of COVID-19 (for more information on the matter, see the background section). In addition–there is a theoretical model which we have expanded upon in Section 3 below. In particular, we draw attention to Chapter 3c that describes the specification of the model and the selection of the explanatory variables.
The risk of developing severe illness or complications from COVID-19 can vary depending on various factors (Richardson et al., Citation2020; Williamson et al., Citation2020; Zhou et al., Citation2020; Ko et al., Citation2021; Wolff et al., Citation2021). Some of the key risk factors include:
Age: Older adults, especially those over the age of 65, are at a higher risk of severe illness and death from COVID-19 (e.g. Kang & Jung, Citation2020; Mueller et al., Citation2020; Henkens et al., Citation2022; Schultz et al., Citation2023).
Underlying Health Conditions: Certain underlying medical conditions increase the risk of severe COVID-19, including: cardiovascular diseases; diabetes; chronic respiratory diseases; obesity; immune system disorders; chronic kidney disease; cancer (World Health Organization (WHO): coronavirus).
Immunocompromised Individuals: People with weakened immune systems due to conditions or medications are more vulnerable to severe COVID-19.
Pregnancy: Pregnant women may have an increased risk of severe illness from COVID-19.
Smoking: Smoking is associated with a higher risk of severe COVID-19.
Ethnicity and Socioeconomic Factors: Some racial and ethnic groups and individuals with lower socioeconomic status may be at increased risk due to disparities in access to healthcare and living conditions (e.g. Gemelas et al., Citation2022; Versey & Russell, Citation2023).
Close Contact: Being in close contact with an infected individual, especially in indoor settings, increases the risk of transmission. In this context, Glaeser (Citation2011) mentions the curses of congestion, crime, and infectious diseases in crowded cities.
Unvaccinated Status: Unvaccinated individuals are at higher risk of contracting and developing severe illness from COVID-19.
COVID-19 vaccines have proven to be highly effective at reducing the risk of infection, severe illness, and death (e.g. Bar-On et al., Citation2021; Loomba et al., Citation2021; Notarte et al., Citation2022; Watson et al., Citation2022; Gozzi et al., Citation2023). The impact of vaccination includes:
**Reducing the Risk of Infection:** Vaccination significantly reduces the likelihood of contracting the virus. While breakthrough infections can occur, they are generally less severe in vaccinated individuals.
**Preventing Severe Illness:** Vaccines are highly effective at preventing severe cases of COVID-19, hospitalization, and death. Even if a vaccinated person becomes infected, the symptoms are usually milder.
**Community Immunity:** Widespread vaccination helps to achieve herd immunity, reducing the overall transmission of the virus in the community and protecting those who cannot be vaccinated, such as individuals with certain medical conditions.
**Economic and Social Impact:** Vaccination is a crucial tool for controlling the spread of the virus, reopening economies, and returning to normalcy by reducing the burden on healthcare systems.
**Variants:** Vaccination is an essential strategy for mitigating the impact of emerging COVID-19 variants, as it can help reduce the severity of illness and transmission of the virus.
It is important to note that vaccine effectiveness may vary depending on the specific vaccine, the emergence of new variants, and individual factors. Booster shots and continued monitoring of the situation are part of ongoing efforts to maintain and enhance the impact of vaccination against COVID-19. Public health recommendations and guidelines may evolve as more data and research become available.
3. Method
3.1. Data description
The dataset used in this article relates to 559 d ()–from the first documentation of COVID-19 cases on 11 March 2020 until 21 September 2021. It encompasses 171 cities and towns in Israel (
) so that
. The sample was chosen based on data availability. The pre- (post-) vaccination era spans half of that period, between
(
).
3.2. Variables
The descriptive statistics of the variables incorporated in the empirical model are given in . The variables in the empirical model include: Cum_Infected is the accumulated number of infected persons; the dependent variable equals
reflects the approximated daily growth rate of infections from SARS-CoV2 virus in each of the 171 Israeli cities and towns (e.g., Johnston & Dinardo, Citation1997: 42-45).
Table 1. Descriptive statistics.
To investigate whether the distribution of each independent variable is symmetrical, reports the respective skewness test. The implication of non-rejection of the null hypothesis is symmetrical distribution (skewness = 0).
Table 2. Skewness test.
The average daily growth rate in the number of COVID-19 cases is 0.95% and the standard deviation is 2.448%. The maximum daily growth rate is 79.93%. This result was obtained in Yarka (an Israeli-Druze village in the northern district of Israel) on 7 August 2020 (from 67 to 149 infected persons).
The independent variables include Dum_vaccine; MedianAge; PopulationSize and RANK2013. Dum_vaccine equals 1 for the post-vaccine era (20 December 2020–21 September 2021); 0 = pre-vaccine era (21 March 2020–19 December 2020). According to , of the sample period, in 49.46% of the time the COVID-19 vaccination was available and administered to the population. Referring to MedianAge (the median age of municipal residents in years), the mean median age is 28.37 and the standard deviation is 6.35 years. The median age ranges between 11.44 and 40.73 years. Referring to PopulationSize (population size of the municipality), the mean is 43,589 residents and the standard deviation is 85,216 residents. The minimum is 5446 persons (Kfar Vradim at the western Galilee) and the maximum is 865,721 persons (Jerusalem). The product of the average population size (43,589) and the number of settlements (171) yields 7,453,719 persons. According to Israeli Central Bureau of statistics media release from December 31, 2020, the population in Israel is 9,291 million persons. Consequently, the sample covers 80.225% of the Israeli population. Referring to RANK2013 (socio-economic ranking on a scale of 1 = the lowest to 255 = the highest), the mean is 118 and the standard deviation is 74. The minimum is 2 (Shaqib al-Salam, in the Negev desert–the poorest municipality) and the maximum is 253 (Lehavim, at the Negev desert − the wealthiest municipality).
As can be seen from , with one exception, one could not reject the null hypothesis of symmetrical distribution of all the independent variables at the 5% level. The exception is the distribution of PopulationSize which is skewed to the right (skewness = 6.3710) and the null hypothesis of symmetrical distribution is clearly rejected. This problem is still preserved when we restrict the settlements only to those with a population size above 52,000 persons. PopulationSize is still skewed to the right (skewness = 3.7109) and the null hypothesis of symmetrical distribution is still rejected. The implication is few cities with large population size. We address this problem in the subsequent robustness test section.
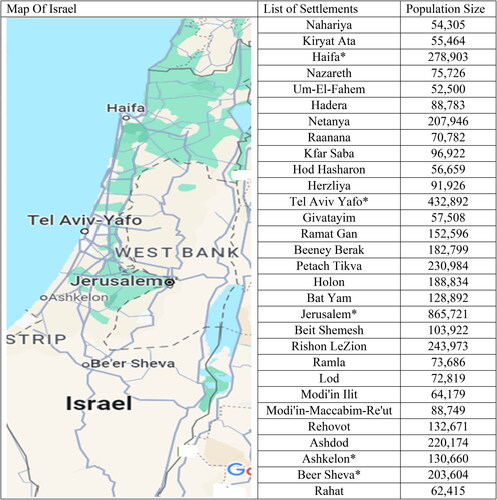
Referring to the daily infected growth rate, gives the relationship between the infection growth rate and population size of the settlements prior to and after vaccination. provides a map of Israel with the names of settlements above 51,000 persons and the population size of each settlement.
Figure 1. Daily growth rate of infected persons () vs. population size of the city (
).
Prior to vaccination ()
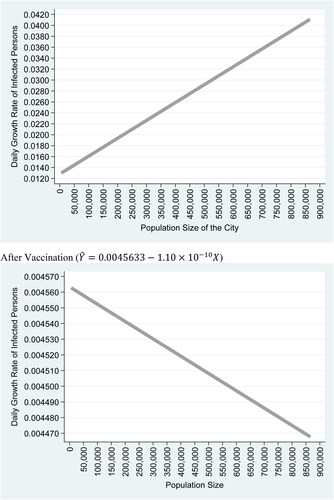
Figure 2. List of settlements above 52,000 persons and their population size.
Source: Google map. The settlements are arranged from north to south. The Population size reflects the number of persons at the settlement. Only settlements with a population above 52,000 persons are included.
*Settlements that appear on the map.
clearly demonstrates a change in infection daily growth rate with the population size at the pre and post-vaccination era. While prior to vaccination era, the inclination of the infection daily growth rate is to rise with population size, at the post-vaccination era, this tendency is reversed to a decrease with population size.
3.3. Model specification
EquationEquations (1)(1)
(1) and Equation(2)
(2)
(2) describe the empirical model:
(1)
(1)
(2)
(2)
where the i represents the index of municipalities (
), and t–the daily time variable (
);
, the approximated daily infection growth rate from SARS-COV2 virus is the dependent variable, and
is the accumulated number of infected persons. The independent variables are:
;
. With the exception of
all the independent variables are generic and constant across time within the same municipality. The stochastic random disturbance term, which satisfies all the classical assumptions of the regression model is represented by
is, and a (
) diagonal matrix of dummy variables capturing generic heterogeneity across cities is represented by
. Finally,
is the corresponding (
) column vector of the matrix A. The random effect regression corrects for serial correlation due to the fact that the same municipality appears in consecutive periods over time (see for example Wooldridge, Citation2009: 489–491).
The choice of the independent control variables were made based on the following considerations:
Median Age–A long series of studies have shown that age is a very important risk factor in the spread of the COVID-19 pandemic and mortality from the SARS-CoV2 virus (Kang & Jung, Citation2020; Mueller et al., Citation2020; Henkens et al., Citation2022; Schultz et al., Citation2023). To the best of our knowledge, none of them investigated the daily COVID-19 infection growth rates. Kang & Jung, Citation2020 states that: ‘During the COVID-19 pandemic, an age-associated vulnerability in the burden of disease has been uncovered’ (page 154). Even as late as 2023, age is still considered as an important COVID-19 risk factor (e.g. Schultz et al., Citation2023).
Population Size of the settlement–This independent variable is a proxy for dense urban environments. There is an interesting debate in the literature over whether crowded cities contribute to the spread of the pandemic. On the one hand, crowded cities are characterized by agglomerative forces, which, in turn, lead to better infrastructure and health services. On the other hand, on many occasions, the benefits associated with crowded cities are offset by the inherent metropolitan curses of congestion, crime, and infectious diseases (Glaeser, Citation2011). Based on 1,165 US counties, Hamidi et al. (Citation2020), for instance, demonstrate that county density promotes significantly lower mortality and infection rates from SARS-CoV2 virus.
RANK2013 is a socio-economic measure. It provides a proxy for income level of settlements in Israel (e.g. Israel Central Bureau of Statistics, Citation2015). Gemelas et al. (Citation2022) stress the lower likelihood of African American to be employed in remotely preformed jobs, thereby increasing their chances of interactions with infected persons. Versey and Russel (Citation2023) indicate the relationships between housing, health and employment and the lack of option to ‘work from home’ among frontline and essential workers. This, in turn, leads to higher exposure time to the SARS-CoV2 virus, and enlarged hospitalizations and mortality rates.
Other considerations of choice of independent variables are data availability (we do not have male-to-female ratio; population density; income of cities–is proxied by the RANK2013 variable; transportation–is proxied by the Population Size variable; vaccination rate in each settlement).
The inherent problem associated with the empirical model given by EquationEquations (1)(1)
(1) and Equation(2)
(2)
(2) is the different units of measurement of the independent variables. In its original form, each variable has different units of measurement. One cannot compare between the median age of the city (measured in years) to population size (measured in persons) to RANK2013 (measured on an ordinal scale) to Dum_Vaccine × t. Therefore in the regression analysis we use the method of beta coefficients. This enables us to compare between identical units of measurements (one standard deviation of each independent variable) and thus rank these independent variables based on the impact of one standard deviation increase. We are unaware of other studies that make use of the beta coefficients to demonstrate the impact of the vaccine.
3.4. Measurement units
To address the problem of unequal units of measurement, we re-estimate the following model:
(3)
(3)
where
,
is the mean and
is the standard deviation of
.Footnote1 The advantage of this model lies in the equal units of measurement, where an increase in one unit of measurement indicates one standard deviation. Consequently, the estimated parameters
measure the separate contribution of each independent variable following an identical increase in the unit of measurement.Footnote2
Based on Wooldridge (Citation2009: 187–189), the Appendix gives a detailed mathematical explanation to the transformation that yields the standardized coefficients or the Beta coefficients. In fact, this procedure is so conventional–that Beta coefficients are inherently incorporated in the outputs of statistical packages such as SPSS.
Wooldridge (Citation2009) argues that: ‘Beta coefficients receive their interesting meaning from Equation (6.4): if increases by one standard deviation, then
changes by
standard deviations. Thus, we are measuring effects not in terms of the original units of
or
, but in standard deviation units. Because it makes the scale of the regressors irrelevant, this equation puts the variables on equal footing. In a standard OLS equation, it is not possible to simply look at the size of different coefficients and conclude that the explanatory variable with the largest coefficient is ‘the most important’. We just saw that the magnitude of coefficients can be changed at will by changing the units of measurement of the. But, when each
has been standardized, comparing the magnitudes of the resulting beta coefficients is more compelling.’ (page 188)
4. Results
reports the estimation outcomes. Columns (1) and (2) are obtained from estimation of EquationEquation (1)(1)
(1) where the dummies for cities are included and excluded, respectively. Column (3) is obtained from EquationEquation (3)
(3)
(3) . The outcomes demonstrate a rise of the projected infection growth rate with the median age and with the population size and a drop with the vaccination and elevated socio-economic ranking of the municipality. The 95% confidence interval of each coefficient given in square brackets demonstrates that all the coefficients are significant at the 5% level. Finally, the between cities R-square is 0.5018. The Wald chi2(4) = 4449.09 (rejection of the null hypothesis that all the coefficients of the independent variables equal zero). The overall indication is a good fit, where 50.18% variance of the dependent variable is explained by the independent variables.
Table 3. Regression analysis and covariates weights.
Referring to Column (3) in , On page 189 Wooldridge (Citation2009) provides an empirical example. Consider the following empirical model: where
is the median price in each of the 506 communities;
is the amount of nitrogen oxide in the air measured in part per million; crime is the number of reported crimes per capita;
is a weighted distance of the community from five employment centers measured in miles;
is the average number of rooms in houses in the community; and
is the average student-teachers ratio of school in the community;
are parameters and u is the classical random disturbance term. The following estimation results are obtained where all the variables are converted to the standard normal distribution function:
Wooldridge (Citation2009) interpret these outcomes as follows: ‘This equation shows that a one standard deviation increase in nox decreases price by 0.34 standard deviation; a one standard deviation increase in crime reduces price by 0.14 standard deviation. Thus, the same relative movement of pollution has a larger effect on housing prices than crime does. Size of the house, as measured by the number of rooms (rooms), has the largest standardized effect.’ (page 189).
describes the relative contribution of each variable to the daily infection rate from COVID19 following a one standard deviation increase and is based on the outcomes obtained from Column (3) in . Std equals 1 for one standard deviation from the mean of each variable. As can be seen from the figure, the highest contributions to projected infection growth rate are obtained from one standard-deviation decrease of vaccination (20.666%) and increase in the population size (5.536%). The lowest contributions are obtained from one standard deviation increase of median age (1.6625%) and decrease of socio-economic ranking (1.6357%).
Figure 3. Relative contributions of explanatory variables.
Notes: The figure describes the relative contribution of each variable to the daily infection rate from COVID-19, namely, projected STD increase of the dependent variable–the daily infection growth rate, following a one standard deviation increase in each independent variable in absolute value (;
;
;
). The Figure is based on the outcomes obtained from column (3) in .
where
is the average and
is the standard deviation of
.
![Figure 3. Relative contributions of explanatory variables.Notes: The figure describes the relative contribution of each variable to the daily infection rate from COVID-19, namely, projected STD increase of the dependent variable–the daily infection growth rate, following a one standard deviation increase in each independent variable in absolute value (−Z[dum_vaccine×t]; Z(PopulationSize); Z[MedianAge]; [−Z(RANK2013)]). The Figure is based on the outcomes obtained from column (3) in Table 2. Z(Xi)=Xi−X¯σX where X¯ is the average and σX is the standard deviation of Xi.](/cms/asset/cea69a79-18d2-4d27-bc16-37b021f331cb/oass_a_2299136_f0003_b.jpg)
Referring to the COVID-19 infection rates, the outcomes demonstrate the significant importance of vaccination, and provide further support for vaccination efforts. Recently, Bar-On et al. (Citation2021) demonstrated a drop in the booster group compared to the nonbooster group by a factor of 11.3, and a drop in the rate of severe illness by a factor of 19.5. Also, Mevorach et al. (Citation2021) suggest that the incidence of myocarditis, although low, increased after the receipt of the BNT162b2 vaccine, particularly after the second dose among young male recipients. Yet, the clinical presentation of myocarditis after vaccination was usually mild. The second component is the municipal population size. This may be explained on the grounds of elevated number of interactions in more crowded cities and towns (e.g. Hamidi et al., Citation2020; Arbel et al., Citation2021; Chin et al., Citation2021).Footnote3 As noted, the contributions of the median age and socio-economic ranking are smaller.
5. Robustness tests
Following the results reported in , one concern that should be addressed is the possibility of autocorrelation. reports the Dickey–Fuller panel unit root test. Results of four tests reject the null hypothesis that all panels contain unit root and supports the alternative hypothesis that at least one panel is stationary.
Table 4. Dickey–Fuller unit root tests for panel data.
Another concern is the predictive power of the model and the goodness of fit. To address these problems, we run a cross validate procedure. To test the predictive power of the model, the procedure randomly assigns an on-sample and off-sample groups and generate a vector of predictions based on off-sample observations. The number of folds is the number of regressions the procedure uses to generate this vector of predictions. We then test whether the Pearson correlation between this vector of predictions obtained from the off-sample group and the observed dependent variable is different from zero. The outcomes obtained from this procedure are reported in . They clearly show rejection of the null hypothesis of zero Pearson correlation at the 5% and 1% levels.
Table 5. Cross validate.
We also considered the possibility of spatial autocorrelation. Results of this test are reported in . Based on the Durbin-Watson Test, the outcomes support the lack of spatial autocorrelation (calculated D.W. = 1.7625; critical D.W. area for rejection of positive spatial autocorrelation between 1.704 and 2). The critical values for the Durbin Watson Statistics with 150 settlements and 3 regressors (excluding the constant term) at the 1% significance level are (Kmenta, Citation1997: 767):
Table 6. Spatial autocorrelation.
Table
Table
As can be seen, the null hypothesis of first-order zero spatial autocorrelation is not rejected.
As part of the robustness tests, we estimated an interaction effect model. Stepwise estimation results obtained from this model are reported in . The outcomes remain robust with respect to those reported in column (3) of and . The largest contribution is the coefficient of the variable where one standard deviation increase of this independent variable raises the standard deviation of the dependent variable by 20.66%. Results also exhibit a good fit of 51.8%–namely–the interacted independent variables explain 51.8% of the variance of the dependent variable.
Table 7. Regression with interacted variables.
Finally, as previously noted in –the distribution of the PopulationSize variable is skewed to the right (skewness = 6.3710) and the null hypothesis of symmetrical distribution is clearly rejected. reports the outcomes, where the variable is omitted. Once again, the outcomes remain robust to previous outcomes.
Table 8. Robustness test: regression analysis and covariates weights.
6. Discussion
6.1. Public health promotion
Results of this study stress the importance of vaccination to the projected infection growth rate. When the contribution is ranked based on an increase/decrease in each variable by equal units (one standard deviation) findings suggest that vaccination is the most influential variable in terms of projected daily infection growth rate.
The public policy repercussion of our study stresses the importance of elevating global awareness via vaccination campaigns promotions at schools, in conferences and on-line digital means, and allocation of public health experts to promote communication channels with the public.
6.2. Incentives and disincentives for vaccination
Savulesco et al. (Citation2021) review different incentives to get vaccinated, including COVID-19 and non- COVID-19 examples. The disincentive component include: avoiding accessibility to social goods (vaccination as a condition of entry to campus at some US colleges and enrolment in US public schools); withholdings state benefits (in Indonesia and Australia); employment limitations (service staff in England and Moscow may be prevented from entering or continuing in a professional role if they have not been vaccinated; fines (in Indonesia following a refusal to get the COVID-19 vaccination and Germany following a refusal of children vaccination against measles). Incentive measures include financial payment (in Serbia); cash lotteries (vaccinated people are entered into a lottery for a substantial cash prize in Ohio and Kentucky); investment opportunities in saving bonds for 16–35 years of age people if they get vaccinated in West Virginia; and payments in kind, such as, free beer in Connecticut, or guns in West Virginia (Savulescu et al., Citation2021: 1500). Other studies discuss the ethical considerations of cash incentives to get vaccinated (Jecker, Citation2021); and The impact of financial incentives on COVID-19 vaccination intention (Andresen et al., Citation2022; Schneider et al., Citation2023; No Authors Listed, Citation2023).
There are several reasons for the success of the Israeli vaccination campaign. Of the 179 countries in the world, Israel is ranked 14 in terms of income per-capita and 34 in terms of Income per capita standardized to the PPP - purchasing parity power (e.g. Worldmeter https://www.worldometers.info/gdp/gdp-per-capita/). This places Israel in the top quintile of the richest countries in the world. Given the economic possibility to finance an advanced health system and legislation providing for compulsory universal health-care insurance for all Israeli citizens (Porath & Lev, Citation1995), Israel may be considered a welfare state. The State Health Insurance Law supports a broad basket of high-quality preventive, curative, and rehabilitation health-care services.
To reduce inequalities in health, Muhsen et al. (Citation2017) mention the large scope of independent programs, initiated by various health plans, including: focusing on at-risk populations, adapting intervention measures to language, culture, literacy, and comprehension levels and lowering copayments. Similar public-relation promotion programs were applied by the Israeli Ministry of Health to speed up the COVID-19 vaccination campaign.
6.3. Future research
Future research could benefit from studies investigating the critical mass of vaccinated population required to generate herd immunity against COVID-19 disease.
7. Conclusions
The objective of this study is to investigate the relative contribution of the following factors to the daily infection growth rate: efficiency of vaccination, population size, socio-economic ranking, and median age of 171 municipalities, covering 80.225% of the Israeli population.
This article uses a panel dataset. We follow the COVID-19 daily infection percentage of change in 171 Israeli municipalities from 11 March 2020 until 21 September 2021. Israel provides an appropriate case study for the efficiency of the vaccination.
The conventional empirical model uses different units of measurement for each explanatory variable. We are unaware of other studies that estimate a model with identical units of measurement, namely one standard deviation of each independent variable. This target is achieved by normalizing all the variables in the regression model.
As demonstrated by Wooldridge (Citation2009: 187–189), the Beta coefficient methodology is a conventional technique to compare the contribution of each independent variable. This transformation measures the response of the dependent variable to shifts in identical unit of measurement for each independent variable–one standard deviation. Results of our study demonstrate that of the four independent variables, the post-vaccination era has the most influential contribution. One standard deviation decrease is associated with 0.26 standard deviation increase in infection growth rate.
Findings suggest vaccination as the factor providing the highest contribution to projected infection growth rate decrease. They stress the high importance of vaccination and provide further support of vaccination efforts. Compared to vaccination, socio-economic ranking of settlement municipality provides the lowest negative contribution, which is smaller by a factor of 12.63. The second component providing a positive contribution is the urban population size. This may be explained on the grounds of elevated number of interactions in more crowded cities and towns. The contributions of the median age and socio-economic ranking are smaller and equal to each other.
7.1. Public policy repercussions
Since this is an international medical epidemic, it is necessary to develop immunological medical literacy in all countries and to develop international cooperation so that the treatment and vaccinations are carried out more quickly.
7.2. Limitations of the study
The study was done on the basis of the years 2020–2021. Of course, the strains of the corona have changed. We recommend repeating the study and extending it to the years 2022 and 2023.
Future research could benefit from studies investigating the critical mass of vaccinated population required to generate herd immunity against COVID-19 disease.
Ethical approval
Not applicable.
Authors’ contributions
YUA contributed to the study conception and design, data collection and analysis, the first draft and comments on previous versions of the manuscript.
YIA contributed to the study conception and design, data collection and analysis, the first draft and comments on previous versions of the manuscript.
AK contributed to the study conception and design, data collection and analysis, the first draft and comments on previous versions of the manuscript.
MK contributed to the study conception and design, data collection and analysis, the first draft and comments on previous versions of the manuscript.
Supplemental Material
Download Zip (9.3 MB)Acknowledgments
The authors are grateful to Chaim Fialkoff for helpful comments.
Disclosure statement
Not applicable. None of the authors have potential conflicts of interest, financially or non-financially, directly, or indirectly related to this work.
Availability of data and materials
This research is based on information downloaded from the Israeli Ministry of Health website. After publication, supplementary materials which permit replications of the outcomes in Stata version 16.1 software package will be provided.
Additional information
Funding
Notes on contributors
Yuval Arbel
Yuval Arbel, PhD, is an Israeli CPA, and the chair of the Economics Department at Western Galilee College, Acre, Israel. He received his BA degree in Economics and Accounting from Tel Aviv University, and MA and PhD in Urban Economics. He was awarded the President’s Grant from Bar Ilan University for PhD studies in Economics. After completion of his PhD, he participated in a post-doctoral training program at the Faculty of Architecture and Town Planning, Technion, Israel Institute of Technology. His academic areas of expertise are: Urban Economics, Behavioral Finance and Economics, Obesity and Health Economics, Empirical Economics and Econometrics.
Yifat Arbel
Yifat Arbel, B.Sc., is a software engineer and a Mathematician. She received her B.Sc. degree in mathematics from Bar Ilan’s university. After completion of her B.Sc. degree, she worked in start-up as-well-as leading software corporations. She is currently a M.Sc. student in Financial Mathematics at Bar ilan university. Her academic areas of expertise are statistical and mathematical methods of optimization.
Amichai Kerner
Amichai Kerner, PhD, is the chair of the Banking and finance Program, Faculty of Social Sciences at Bar Ilan University, Ramat Gan, Israel. He received his BA degree in Law and Economics from Bar Ilan University, and MA and PhD in Construction Financing. He was awarded the President’s Grant from Bar Ilan University for PhD studies. After completion of his Ph.D., he was Director of the Evening Program of the Netanya Academic College Law School and taught in the School of Banking and Capital Markets. Then he became Vice Dean, in the School of Real Estate, Netanya Academic College. His academic areas of expertise are: Real Estate, Finance, Urban Economics, Obesity and Health Economics.
Miryam Kerner
Miryam Kerner, MD, is a senior dermatologist and the Director of the Dermato-Oncology Clinic, Emek Medical Center, affiliated to the Technion, Israel. She received her MD from the Hebrew University of Jerusalem, an MHA from Tel Aviv University and completed a research fellowship at Memorial Sloan Kettering Cancer Center, New York. Her academic areas of expertise are Dermatology and Dermatology- Oncology.
Notes
1 In the case that ,
and this transformation is not well defined mathematically. This problem has two implications: (1) The constant term of this model is undefined (for convenience, Equation (2) sets the constant term to be equal to zero). (2) Given the independent variables:
, which are constant across time (i.e.,non time-varying-covariates), it is impossible to run the random-effect regression based on this transformation. Consequently, we set
to be zero.
2 It may be readily verified that for a normalized regression model with a constant term and one explanatory variable, the coefficient of the normalized explanatory variable yields the Pearson correlation between the two variables. This may be demonstrated as follows. The simple regression model with one explanatory variable is defined as: (1) where
is the dependent variable,
is the independent variable, (
) are the sample means, (
) are the respective standard deviations,
are the estimated parameters via the OLS procedure,
are the residuals,
. and the Pearson correlation is:
(e.g. Kmenta, Citation1997: 237–243). The derived normal equations of the OLS procedure yield: (2)
. Subtracting (2) from (1) and rearranging terms yields: (3)
. Multiplication of (3) by
yields: (4)
. Substitution of
and
yields: (5)
. Multiplication by
yields: (6)
. Substitution of
: in Equation (6) yields: (7)
.
3 Chin et al. (Citation2021) found that incarcerated residents in California state prisons living in cells with ≥2 others had a 2.5-fold higher infection rate and that inmates in a cell whose occupants participated in out-of-cell work had a 1.6-fold higher rate.
References
- Andresen, J. A., Harris, J. N., Mauro, C., Zimet, G. D., & Rosenthal, S. L. (2022). The impact of financial incentives on COVID-19 vaccination intention among a sample of US adults. Preventive Medicine Reports, 29, 1. https://doi.org/10.1016/j.pmedr.2022.101962
- Arbel, Y., Fialkoff, C., Kerner, A., & Kerner, M. (2021). Do COVID19 infection rates change over time and space? Population density and socio-economic measures as regressors. Cities (London, England), 120, 103400. https://doi.org/10.1016/j.cities.2021.103400
- Arbel, Y., Arbel, Y., Kerner, A., & Kerner, M. (2022). Can the regime type (Democracy versus Autocracy) explain the COVID-19 recovery rates? Chinese Political Science Review, https://doi.org/10.1007/s41111-022-00218-4
- Arbel, Y., Arbel, Y., Kerner, A., & Kerner, M. (2023). To obey or not to obey? Can game theory explain human behavior in the context of coronavirus disease? Review of Development Economics, 27(2), 1078–17. https://doi.org/10.1111/rode.12979
- Bar-On, Y. M., Goldberg, Y., Mandel, M., Bodenheimer, O., Freedman, L., Kalkstein, N., Mizrahi, B., Alroy-Preis, S., Ash, N., Milo, R., & Huppert, A. (2021). Protection of BNT162b2 vaccine booster against covid-19 in Israel. The New England Journal of Medicine, 385(26), 2421–2430. https://doi.org/10.1056/NEJMoa2114255
- Chin, E. T., Ryckman, T., Prince, L., Leidner, D., Alarid-Escudero, F., Andrews, J. R., Salomon, J. A., Studdert, D. M., & Goldhaber-Fiebert, J. D. (2021). COVID-19 in the California state prison system: An observational study of decarceration, ongoing risks, and risk factors. Journal of General Internal Medicine, 36(10), 3096–3102. https://doi.org/10.1007/s11606-021-07022-x
- da Silva Lopes, H., Remoaldo, P. C., Ribeiro, V., & Martín-Vide, J. (2021). Effects of the COVID-19 pandemic on tourist risk perceptions—the case study of porto. Sustainability, 13(11), 6399. https://doi.org/10.3390/su13116399
- Eliyahu, U., & Boaz, M. (2020). Use of databases available on the web to describe covid-19 morbidity and mortality trends. Biomedical Statistics and Informatics, 5(2), 47–51. https://doi.org/10.11648/j.bsi.20200502.12
- Gemelas, J., Davison, J., Keltner, C., & Ing, S. (2022). Inequities in employment by race, ethnicity, and sector during COVID-19. Journal of Racial and Ethnic Health Disparities, 9(1), 350–355. https://doi.org/10.1007/s40615-021-00963-3
- Glaeser, E. (2011). Cities, productivity, and quality of life. Science, 333(6042), 592–594. https://doi.org/10.1126/science.1209264
- Gozzi, N., Chinazzi, M., Dean, N. E., Longini, I. M., Halloran, E., Perra, N., & Vespignani, A. (2023). Estimating the impact of COVID-19 vaccine inequities: A modeling study. Nature Communications, 14(1), 3272. https://doi.org/10.1038/s41467-023-39098-w
- Hamidi, S., Ewing, R., & Sabouri, S. (2020). Longitudinal analyses of the relationship between development density and the COVID-19 morbidity and mortality rates: Early evidence from 1,165 metropolitan counties in the United States. Health & Place, 64, 102378. https://doi.org/10.1016/j.healthplace.2020.102378
- Henkens, M. T. H. M., Raafs, A. G., Verdonschot, J. A. J., Linschoten, M., van Smeden, M., Wang, P., van der Hooft, B. H. M., Tieleman, R., Janssen, M. L. F., ter Bekke, R. M. A., Hazebroek, M. R., van der Horst, I. C. C., Asselbergs, F. W., Magdelijns, F. J. H., Heymans, S. R. B., Al-Ali, A. K., Al-Muhanna, F. A., Al-Windy, N. Y. Y., Almubarak, Y. A., … van der Zee, P. M. (2022). Age is the main determinant of COVID-19 related in-hospital mortality with minimal impact of pre-existing comorbidities, a retrospective cohort study. BMC Geriatrics, 22(1), 184. https://doi.org/10.1186/s12877-021-02673-1
- Israel Central Bureau of Statistics (ICBD). (2020). Media Release 438/2020 (December 31). https://www.cbs.gov.il/en/mediarelease/Pages/2020/Population-of-Israel-on-the-Eve-of-2021.aspx (Last accessed on October 19, 2023).
- Israel Central Bureau of Statistics. (2015). Characterization and classification of geographical units by the socio-economic level of the population. https://www.cbs.gov.il/en/publications/Pages/2019/Characterization-and-Classification-of-Geographical-Units-by-the-Socio-Economic-Level-of-the-Population-2015.aspx (Last accessed on October 19, 2023).
- Jecker, N. S. (2021). Cash incentives, ethics, and COVID-19 vaccination. Science, 374(6569), 819–820. https://doi.org/10.1126/science.abm6400
- Johnston, J., & Dinardo, J. (1997). Econometric methods (4th ed.). McGraw Hill International Editions.
- Kang, S. J., & Jung, S. I. (2020). Age-related morbidity and mortality among patients with COVID-19. Infection & Chemotherapy, 52(2), 154–164. https://doi.org/10.3947/ic.2020.52.2.154
- Kmenta, J. (1997). Elements of econometrics (2nd ed.). Ann Arbor the University of Michigan Press.
- Ko, J. Y., Danielson, M. L., Town, M., Derado, G., Greenlund, K. J., Kirley, P. D., Alden, N. B., Yousey-Hindes, K., Anderson, E. J., Ryan, P. A., Kim, S., Lynfield, R., Torres, S. M., Barney, G. R., Bennett, N. M., Sutton, M., Talbot, H. K., Hill, M., Hall, A. J., … Kim, L. (2021). Risk factors for coronavirus disease 2019 (COVID-19)–associated hospitalization: COVID-19–associated hospitalization surveillance network and behavioral risk factor surveillance system. Clinical Infectious Diseases, 72(11), e695–e703. https://doi.org/10.1093/cid/ciaa1419
- Levin-Zamir, D., & Baron-Epel, O. (2020). Health literacy in Israel - from measurement to intervention: Two case studies. Studies in Health Technology and Informatics, 269, 220–228. https://doi.org/10.3233/SHTI200035
- Loomba, S., de Figueiredo, A., Piatek, S. J., de Graaf, K., & Larson, H. J. (2021). Measuring the impact of COVID-19 vaccine misinformation on vaccination intent in the UK and USA. Nature Human Behaviour, 5(3), 337–348. https://doi.org/10.1038/s41562-021-01056-1
- Losso, J. N., Losso, M. N., Toc, M., Inungu, J. N., & Finley, J. W. (2021). The young age and plant-based diet hypothesis for low SARS-CoV-2 infection and COVID-19 pandemic in sub-Saharan Africa. Plant Foods for Human Nutrition (Dordrecht, Netherlands), 76(3), 270–280. https://doi.org/10.1007/s11130-021-00907-6
- Mevorach, D., Anis, E., Cedar, N., Bromberg, M., Haas, E. J., Nadir, E., Olsha-Castell, S., Arad, D., Hasin, T., Levi, N., Asleh, R., Amir, O., Meir, K., Cohen, D., Dichtiar, R., Novick, D., Hershkovitz, Y., Dagan, R., Leitersdorf, I., … Alroy-Preis, S. (2021). Myocarditis after BNT162b2 mRNA vaccine against covid-19 in Israel. The New England Journal of Medicine, 385(23), 2140–2149. https://doi.org/10.1056/NEJMoa2109730
- Muhsen, K., Green, M. S., Soskolne, V., & Neumark, Y. (2017). Inequalities in non-communicable diseases between the major population groups in Israel: Achievements and challenges. Lancet (London, England), 389(10088), 2531–2541. https://doi.org/10.1016/S0140-6736(17)30574-3
- Mueller, A. L., McNamara, M. S., & Sinclair, D. A. (2020). Why does COVID-19 disproportionately affect older people? Aging, 12(10), 9959–9981. https://doi.org/10.18632/aging.103344
- Notarte, K. I., Catahay, J. A., Velasco, J. V., Pastrana, A., Ver, A. T., Pangilinan, F. C., Peligro, P. J., Casimiro, M., Guerrero, J. J., Gellaco, M. M. L., Lippi, G., Henry, B. M., & Fernández-de-las-Peñas, C. (2022). Impact of COVID-19 vaccination on the risk of developing long-COVID and on existing long-COVID symptoms: A systematic review. EClinicalMedicine, 53, 101624. https://doi.org/10.1016/j.eclinm.2022.101624
- Porath, A., & Lev, B. (1995). The new Israeli national health insurance law and quality of care. International Journal for Quality in Health Care: Journal of the International Society for Quality in Health Care, 7(3), 281–284. https://doi.org/10.1093/intqhc/7.3.281
- Public Health England. (2020). Disparities in the risk and outcomes of COVID-19. https://www.gov.uk/government/publications/covid-19-review-of-disparities-in-risks-and-outcomes. (Last accessed on October 19, 2023)
- Richardson, S., Hirsch, J. S., Narasimhan, M., Crawford, J. M., McGinn, T., Davidson, K. W., Barnaby, D. P., Becker, L. B., Chelico, J. D., Cohen, S. L., Cookingham, J., Coppa, K., Diefenbach, M. A., Dominello, A. J., Duer-Hefele, J., Falzon, L., Gitlin, J., Hajizadeh, N., Harvin, T. G., … Zanos, T. P. (2020). Presenting characteristics, comorbidities, and outcomes among 5700 patients hospitalized with COVID-19 in the New York City area. JAMA, 323(20), 2052–2059. https://doi.org/10.1001/jama.2020.6775
- Savulescu, J., Pugh, J., & Wilkinson, D. (2021). Balancing incentives and disincentives for vaccination in a pandemic. Nature Medicine, 27(9), 1500–1503. https://doi.org/10.1038/s41591-021-01466-8
- Schneider, F. H., Campos-Mercade, P., Meier, S., Pope, D., Wengström, E., & Meier, A. N. (2023). Financial incentives for vaccination do not have negative unintended consequences. Nature, 613(7944), 526–533. https://doi.org/10.1038/s41586-022-05512-4
- Schultz, M. J., van Oosten, P. J., & Hol, L. (2023). Mortality among elderly patients with COVID-19 ARDS-age still does matter. Pulmonology, 29(5), 353–355. https://doi.org/10.1016/j.pulmoe.2023.02.013
- Shah, H., Khan, M. S. H., Dhurandhar, N. V., & Hegde, V. (2021). The triumvirate: Why hypertension, obesity, and diabetes are risk factors for adverse effects in patients with COVID-19. Acta Diabetologica, 58(7), 831–843. https://doi.org/10.1007/s00592-020-01636-z
- No Authors Listed. (2023). Vaccine incentives do not backfire - policymakers take note. Nature, 613(7943), 215. https://doi.org/10.1038/d41586-023-00018-z
- Velasco, J. M., Tseng, W. C., & Chang, C. L. (2021). Factors affecting the cases and deaths of COVID-19 victims. International Journal of Environmental Research and Public Health, 18(2), 674. https://doi.org/10.3390/ijerph18020674
- Versey, H. S., & Russell, C. N. (2023). The impact of COVID-19 and housing insecurity on lower-income Black women. The Journal of Social Issues, 79(2), 773–793. https://doi.org/10.1111/josi.12555
- Watson, O. J., Barnsley, G., Toor, J., Hogan, A. B., Winskill, P., & Ghani, A. C. (2022). Global impact of the first year of COVID-19 vaccination: A mathematical modelling study. The Lancet. Infectious Diseases, 22(9), 1293–1302. https://doi.org/10.1016/S1473-3099(22)00320-6
- Williamson, E. J., Walker, A. J., Bhaskaran, K., Bacon, S., Bates, C., Morton, C. E., Curtis, H. J., Mehrkar, A., Evans, D., Inglesby, P., Cockburn, J., McDonald, H. I., MacKenna, B., Tomlinson, L., Douglas, I. J., Rentsch, C. T., Mathur, R., Wong, A. Y. S., Grieve, R., … Goldacre, B. (2020). Factors associated with COVID-19-related death using OpenSAFELY. Nature, 584(7821), 430–436. https://doi.org/10.1038/s41586-020-2521-4
- Wolff, D., Nee, S., Hickey, N. S., & Marschollek, M. (2021). Risk factors for Covid-19 severity and fatality: A structured literature review. Infection, 49(1), 15–28. https://doi.org/10.1007/s15010-020-01509-1
- Wooldridge, J. M. (2009). Introductory econometrics: A modern approach. South Western, a part of cengage learning (4th ed.). ASCO
- World Health Organization (WHO). Coronavirus. https://www.who.int/health-topics/coronavirus#tab=tab_1 and https://www.who.int/emergencies/diseases/novel-coronavirus-2019 (Last accessed on October 6, 2020).
- Worldmeter. GDP per capita. https://www.worldometers.info/gdp/gdp-per-capita/ (Last accessed on October 19, 2023).
- Wu, Z., & McGoogan, J. M. (2020). Characteristics of and important lessons from the coronavirus disease 2019 (COVID-19) outbreak in china: Summary of a report of 72,314 cases from the Chinese Center For Disease Control and Prevention. JAMA, 323(13), 1239–1242. https://doi.org/10.1001/jama.2020.2648
- Zhou, F., Yu, T., Du, R., Fan, G., Liu, Y., Liu, Z., Xiang, J., Wang, Y., Song, B., Gu, X., Guan, L., Wei, Y., Li, H., Wu, X., Xu, J., Tu, S., Zhang, Y., Chen, H., & Cao, B. (2020). Clinical course and risk factors for mortality of adult inpatients with COVID-19 in Wuhan, China: A retrospective cohort study. The Lancet (London, England), 395(10229), 1054–1062. https://doi.org/10.1016/S0140-6736(20)30566-3
Appendix:
Derivation of the beta coefficients
This Appendix is based on Wooldridge (Citation2009: 187–189).
Consider the following model:
(1)
where the circumflex denotes estimated coefficients and residuals obtained via the OLS procedure.
It is well known that the regression line derived from the OLS procedure passes through the sample mean. Consequently, EquationEquation (1)(1)
(1) may be rewritten as follows:
(2)
Subtracting (2) from (1) and rearranging terms yields:
(3)
Division by the estimated standard deviation of the variable
yields:
(4)
The term on the left-hand side of Equation (4) is a transformation from
to the standard normal distribution function
with mean zero and standard deviation of one.
Next, given that where
is the sample standard deviation of
, we multiply and divide each independent variable by its respective standard deviation. Rearranging terms yields:
+
(5)
Defining ;
for
and
, Equation (5) becomes:
+
(6)
This is Equation (6.4) in Wooldridge (Citation2009). The is known as standardized coefficients or beta coefficients.