
 ?Mathematical formulae have been encoded as MathML and are displayed in this HTML version using MathJax in order to improve their display. Uncheck the box to turn MathJax off. This feature requires Javascript. Click on a formula to zoom.
Abstract
Understanding the complex interplay between soil erosion, nutrient variability, land use and topography is crucial for sustainable agriculture. However, attempts to link these environmental factors with food security got less attention. This study examined the relationship between soil erosion, nutrient variation and the effects on food security in Gibe III dam area. Data were collected using structured questionnaire from 384 households, focus group discussion and Key informant interviews. A logit and food balance sheet models were employed for survey data analysis. Twenty-seven soil samples were taken from three land uses. Two-way Anova was used for statistical analysis of soil data. Results showed that 84% of the farmers perceived soil erosion. Food security had significantly associated with family size, extension services and slope at 5%. Food-secure and insecure households consumed 3102.922 and 1072.995 kcal on average, respectively. CEC was highest in grazing land (31 C mol kg−1) followed by forestland (26.4 C mol kg−1) and lowest in crop land (24.2 C mol kg−1). AP was highest (5.4 mg kg−1) in forest land followed by crop land (2.9 mg kg−1) while lowest (2 mg kg−1) in grazing land. The interaction effect of land use and slope on soil organic matter was significant [F(4, 18) = 93, p = .05], with partial eta squared of 0.95, total nitrogen [F(4, 18) = 47.4, p = .05] (partial eta squared = 0.91) and bulk density [F(4, 18)= 4.7, p = .05] (partial eta squared = 0.5). Sand varied in cropland (65.33%) followed by grazing land (62.67%) compared to forestland. Sustainable land use management should be implemented.
REVIEWING EDITOR:
1. Introduction
Global south has been challenged by environmental degradation which accelerates the security risks (Nguyen et al., Citation2023). Soil erosion and the associated land degradation affects agricultural productivity declining the economy (Saha et al., Citation2021). Nutrients at different topographic position have varying physical, biological and chemical qualities determining the productivity of the soil which is linked to crop producvity (Hayicho et al., Citation2019). Land use and land cover dynamics, soil erosion at different land scape position results in loss of soil fertility leading to reduction in agricultural production (Tilahun et al., Citation2023). Topography affects soil erosion (Chowdhuri et al., Citation2021), which creates variations in soil nutrients (Zhang et al., Citation2022). The effects of soil erosion on food security is occurring due to changes in land use which accelerates nutrient depletion through increased rate of soil erosion (Negese, Citation2021). Soil erosion has resulted in the loss of productivity on approximately 10 million hectares of land worldwide associated with depletion of essential soil nutrients (Pimentel, Citation2006). About 77% of sub-Saharan Africa is seriously affected by soil erosion (Tilahun et al., Citation2023). The rate of nutrient depletion accelerated by the removal of topsoil in different geographical settings is the highest among Sub-Saharan African countries (Degu et al., Citation2019). As a result, food security is at risk because soil erosion affects agricultural output by requiring farmers to use more inputs, as fertility is declining and could eventually result in soil abandonment (Gomiero, Citation2016). Ethiopia heavily depends on agriculture for 43.2% of its gross domestic product, more than 80% of export revenue employing 85% of the labor force. To meet the national demand for crop production, deforestation has been carried out and soil has also been subjected to grazing by livestock, which has depleted the nutrients in the soil due to soil erosion (Donis & Assefa, Citation2017). The physical and chemical properties of soil depend on land management and landscape position (Seifu et al., Citation2020) associated with soil erosion, which washes away fertile soil and reduces agricultural productivity (Chowdhuri et al., Citation2021), leading to food insecurity in Ethiopian communities. Earlier studies, for instance, focused on Betela and Wolka (Citation2021) soil erosion and its controlling practices, land use and cover dynamics in different agro-ecologies and topographical features (Gitima et al., Citation2022), investigating the impact of land Use/Cover Change on Sediment (Estifanos & Gebremariam, Citation2019), and soil fertility in relation to nutrients (Hailu et al., Citation2015). Many studies conducted on soil erosion have not given attention to link with soil nutrient depletion (Bashagaluke et al., Citation2018). Thus, soil erosion-induced nutrient variability along land use and topography linked to food security has received little attention in previous studies though fertility decline and variation is a threat in Gibe III Dam Area. Thus, the major gaps identified in this area include the absence of reliable information on soil erosion, associated nutrient dynamics, and its implications for food security. Hence, scientific evidence is essential to widen the understanding of soil erosion, nutrient dynamics, and their link to food security. The international community would benefit from findings in that filling knowledge gaps helps to promote science and design appropriate land use management systems to increase agricultural production and improve the livelihood of world communities. A study that considers a wide range of socioeconomic and physical factors that affect food security is necessary for effective intervention and sustainable livelihood planning. Thus, the aim of this study was to examine the intricate relationships that exist between soil erosion, topography, land use, and nutrient variability, as well as impacts on food security in Southern Ethiopia.
2. Materials and methods
2.1. The study area
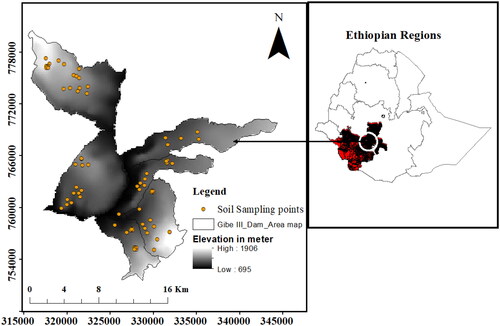
The Gibe III Dam Area which the current study covers is 254 km2 located approximately 450 km South of Addis Ababa, extending from 6036’0” to 6057’0"N latitudes and 3700’0" to 37031’30"E longitudes () in the entire Gibe III Dam watershed in Upper Omo Basin. The area receives 1200 mm of rainfall at minimum and 1900 mm at maximum. The average annual rainfall calculated over the entire Gibe III Dam Area, where the dam is located, was 1426 mm and 75% to 80% of the annual rainfall occurs during a five months period from May to September. The mean annual temperature is 20.4 °C. In terms of geology, the southern parts of Ethiopia in which Gibe III Dam Area located were primarily covered by metamorphic rocks with green schist, amphibolite, and granulite facies, which represent the southern margin of the Arabian-Nubian shield (Gebremichael et al., Citation2021). In terms of land use at broad term, the upper Omo basin encompassing Gibe III Dam Area is characterized by increased pressure on land owing to the wide spread of crop production, diminishing the woodlands (Gebremichael et al., Citation2021). The altitude of the basin generally lies between 333 and 3570 meters above sea level (Gebremichael et al., Citation2021).
Figure 1. Map of study area.
3. Research methodology
3.1. Research design
Both cross-sectional and experimental designs were employed in the current study. The cross-sectional design was opted because household survey data were collected at a time rather than longitudinally, which takes a series of times. Meanwhile experimental designs were used because soil samples were taken from cultivated and grazing land against forest land for comparison in order to examine the nutrient variation along slopes and land uses. Using standard laboratory techniques, soil samples were analyzed for soil properties. Slope categories were identified using Global positioning system (GPS), and DEM was also used to compute elevation. Besides, land use was assessed guided by agricultural extension workers and farmers who have long years of farming experience in their plots of land and finally food security assessment was done to gather data on crop types, food availability and their amount in quintal.
3.2. Research approach
A mixed approach was employed in this study. The validity and reliability of data and their interpretation are increased when both qualitative and quantitative methods are used to acquire the data (Zohrabi, Citation2013). Understanding the type of soil erosion, nutrient variability, and effects on food security was made easier with the use of tools including field notes, open-ended questions, key informant interviews, focus groups, and observation. Additionally, qualitative approaches helped in the triangulation of data acquired in a quantifiable manner.
3.3. Data sources
Primary data on socio-economic and bio physical variables were obtained from rural households, community elders, and experts, whereas data on soil properties were collected from field measurements whereas secondary data were acquired from safety net coordination, agricultural, and rural development offices and published articles. The use of household survey data in connection with soil survey was that as was reported by many studies soil erosion was identified as a threat to agricultural productivity; however, the risk persisted therefore, it is essential to include qualitative approach to understand the challenge in depth.
3.4. Data collection
In this study, household surveys were conducted using questionnaires on 384 sample households, six key informant interviews with three individuals (one natural resource expert, one soil expert and one food security expert) in six kebeles, and six focus group discussions, each consisting of eight individuals (2 farmers, 2 kebele principals, 2 extension workers, and 2 community elders) in six kebeles. In addition, soil samples were taken to analyze the fertility status and dynamics of nutrients along the slope position and land use.
3.5. Techniques of sampling and sample size determination
3.5.1. Household sampling techniques
Cochran (Citation1977) formula was used to determine the size of the sample households selected from the sample frame.
(1)
(1)
where,
is the sample size, z is the specified critical value of the desired confidence level, and P is the estimated proportion of an attribute. q = 1 − p, and e is the required precision level. Using the aforementioned formula,the sample size of a large population whose degree of variability is unknown can be determined. Therefore, in the current study area, there were married sons who depended on their parents for their land but were not considered and registered in their respective kebeles (small administrative unit). However, they were households married and with or without children living near their parents even though the kebeles did not know them. For this reason, this study employed the formula (EquationEquation 1
(1)
(1) ), as it is not exactly known how many households exist in the study area. The sample size for the unknown population was determined. Thus, the maximum variability was assumed to be equal to 50% and at 95% confidence level with 5% precision.
(2)
(2)
(3)
(3)
This study employed multi stage sampling techniques () to select the required sample sizes. First, seven woredas (districts) near the hydroelectric plant in the Gibe III Dam Area, namely Boloso Bombe, Kindo koisha, and kindo Didaye from the Wolaita zone and Zaba, Gena, Loma Bosa, and Disa from the Dawro Zone. Second, Kindo koisha and Loma Bosa woredas were selected purposively because of their accessibility in location, as they are Sodo- Techa- Jima Road, and it is the place where Gibe III Dam has been constructed since the 2000s that created scares in the area. Third, six kebeles namely, Fajena Mata, Mundena, Manara. Chereche from Kindo koisha woreda and Zima Waruma and Chicho Hayo from Loma woreda, were selected by purposively due to their closeness to the dam and the topographic features from other kebeles. In the fourth stage, the probability proportional sampling (PPS) sampling technique was used to allocate the determined sample household heads (EquationEquation 3(3)
(3) ) to each kebele based on sample frames obtained from each kebele administration. In fifth stage, 384 household heads (Male = 295 and Female = 89) were selected using simple random sampling techniques ()
Table 1. Sampling techniques in Gibe III Dam area.
Soil sampling techniques
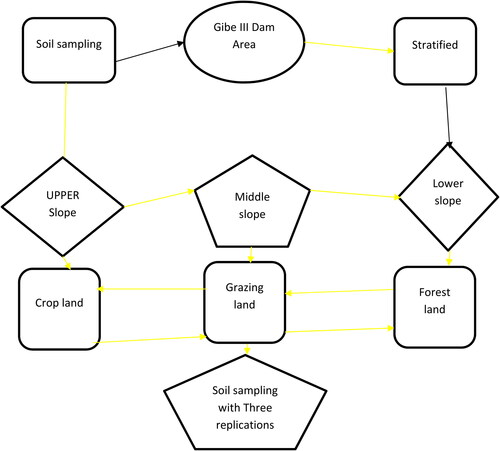
Based on data gathered during a reconnaissance survey of local elders who have lived there for a long time and with the help of agriculture and natural resource experts, samples of soil were taken from three land uses such as crop land, forest land and grazing land along upper, middle and lower slopes. The sites were observed prior to sampling by the researcher. The sampling spots’ elevation and spherical coordinates were found using GPS. In order to create composite sample, three duplicate soil samples were taken from a 20 m by 10 m plot within uniform land forms. Twenty-seven composite soil samples were collected at a depth of 0–20 cm using a stratified sampling approach (). The samples were then combined or homogenized to represent the sample plot for each of the three land uses and slope categories. Subsequently, 1 kg of the sample was taken, labeled, and secured for transport in a plastic bag.
Figure 2. Soil sampling procedure in Gibe III Dam watershed.
3.5. Data analysis
3.6.1. Logit regression
The effect of soil erosion on food security was examined using a binary logistic regression model. To determine each household’s level of food security, the food balance sheet model was employed (Amare & Simane, Citation2017; Degefa, Citation1996). The number of calories consumed by individuals in households was compared with the thresholds of daily calorie requirement in adults equivalent to 2100 kcal. The dependent variable was food security, which was represented by dummy variable 1 if secured and 0 if not secured. Institutional (adoption of physical and biological conservation measures, extension services, credit service), biophysical (farm size, slope, and land use/cover change), demographic, and socioeconomic variables (age, gender, education, marital status, family size, wealth status, and off-farm activities) variables, as well as farmers’ perception index of soil erosion were the independent variables. Farmers’ perception of soil erosion was measured using the soil structure erosion index, given as follows (Betela & Wolka, Citation2021):
(4)
(4)
where ISSD is the perception index of soil structure erosion by farmers;
=Removal of the topsoil (1 if reported yes, otherwise 0);
=Exposure of the subsoil (1 if reported yes, otherwise 0);
=color change (1 if reported yes, otherwise 0);
=problem of plowing (1 if reported yes, otherwise 0);
=Low moisture retaining capacity (1 if reported yes, otherwise 0). The index values range from 0-1. If the value is 0, the area has no soil erosion; if the value is 1, the area is degraded.
The econometric specification of the cumulative logistic probability function is as follows:
(5)
(5)
where,
is the probability that the ith household is food secure given
. Xi;
= ith household dependent/independent variables, i = 1, 2, 3., n;
= a linear function of n explanatory variables
,e = the base of natural logarisms (2.718).;
and
are the regression parameters to be estimated in the model,
is the intercept, and
is the coefficient of the slope. In terms of odds, the model can be written as:
(6)
(6)
(7)
(7)
(8)
(8)
Using the odds ratio’s natural logarithms of EquationEquation (7)(7)
(7) , it will be
=In
(9)
(9)
The logit model takes on the following form if the disturbance term is added to the model:
(10)
(10)
(11)
(11)
Multicollinearity and variance of the inflation factor were checked, and the maximum likelihood estimation procedure was used to estimate the parameters.
3.5.2. Household food avaliability assesment
Food security has four dimensions namely availability, access, utilization, and stability. However, in this study, food availability was measured using the Household Food Balance Model (HFBM). Using the FAO and EHNRI food composition tables of 1996 of Ethiopia, a kilogram was converted into kilocalorie. To calculate the per capita food availability of households in kilocalorie, the total amount of net available food obtained by each household was divided by the adult equivalency. According to the Ethiopian government, 2100 kcal/adult equivalent/day or 225 kg of cereals per person per annum is the minimum acceptable weighted average requirement. Based on this minimum daily calorie intake requirement, food secure and insecure households were identified. Household food balance sheet model (HFBM) was calculated using the equation as used by Degefa (Citation1996):
(12)
(12)
where Nij is the net food available for household i in year j; Pij is the total grain produced by household i in year j; Bij is the total grain purchased by household i in year j; Fij is the total grain obtained through FFW by household i in year j; Rij is the total relief food received by household i in year j; Hij is the post-harvest loss to household i in year j; Sij is the total crop utilized for seed from the home by household i in year j, and Mij is the total marketed output by household i in year j.
3.5.3. Soil physico-chemical properties analysis
The regional soil laboratory centers in Sodo and Hawassa conducted analyses of physical fertility parameters, such as bulk density and soil textures, and chemical fertility parameters, such as pH, organic carbon, total nitrogen, cation exchange capacity, and available phosphorus. The soil samples were air-dried under a shed, ground with a mortar and pestle, and passed through a 2-mm sieve before laboratory analysis. These parameters included organic carbon, phosphorous, total nitrogen, soil texture (sand, silt, and clay), bulk density, and cation exchange capacity. The particle size distribution was determined using the Bouyoucos hydrometer method (Bouyoucos, Citation1962). The bulk density was determined using the core sampling method (Blake & Hartge, Citation1986). The soil pH (pH-H2O) and 1 M KCl (pH-KCl) were determined in a 1:2.5 soil to solution ratio using a pH meter (Hailu et al., Citation2015). Organic matter was determined following the method described by Bashagaluke et al. (Citation2018), whereas Total Nitrogen was determined using the Micro-Kjeldahl method (Bremner & Mulvaney, Citation1982). Ammonium acetate-saturated samples that were subsequently replaced by Na from a percolated NaCl solution after removal of excess ammonium by repeated washing with alcoho used to determine CEC (Donis & Assefa, Citation2017). Besides, sodium bicarbonate extraction solution (pH 8.5) method was employed to determine available phosphorus and the amount was measured using a spectrophotometer (Olsen et al., Citation1954).
3.5.4. Statistical analysis of soil properties
Landscape positions (upper, middle, and lower) and different types of land uses (crop, grazing, and forest lands) were taken as independent variables, and soil nutrients, including organic carbon, phosphorous, CEC, total nitrogen, soil pH, bulk density, and soil textural classes, such as sand silt and clay were taken as dependent variables. The analysis was performed using a two-way Annova in SPSS version 27, and the results were interpreted following Ngnipa et al. (Citation2021; )
(13)
(13)
where ChaCla, Gla: percentage changes in soil properties of cultivated or grazing lands compared to forestland and LUCla, LUGla and LUFla are the mean values of the soil properties under consideration of cultivated, grazing, and forestland, respectively.
Table 2. Soil nutrient Interpretation.
3.6. Data quality control
To control data quality, before collecting actual data, a pilot study was conducted on Molticho Kebele in Kindo koisha woreda on 30 individuals to check the validity and reliability of the questionnaire, which was analyzed using SPSS software version 27. The Cronbach’s alpha was 0.72. Besides, the questionnaire was checked to suit the reality on the ground. Its practicality, feasibility, strengths, and weaknesses were identified and modified. For experimental data, a preliminary survey was conducted before soil sampling was undertaken, in which experience was gained from soil experts in the field. The actual data were collected later, excluding the kebele of the pilot study. The qualitative data were also modified and verified after key informant interview and discussion with focus group discussants involved in the pilot study.
4. Results and discussion
4.1. Socio-economic and food security analysis
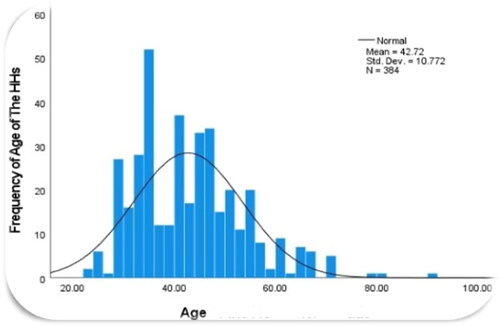
A household survey of 384 respondents revealed various levels of food insecurity in the study area. The result revealed that the mean kilocalorie intake of households was 1585.404 kcal/AE/day, with the minimum and maximum amount of 199.50 kcal and 5620.99 kcal, respectively. The food secure and insecure households consumed on average 3102.922 and 1072.995 kcal respectively. The mean age of household heads was 42.7 (), with minimum and maximum ages of 23 and 90 years, respectively.
Figure 3. Age of the household heads.
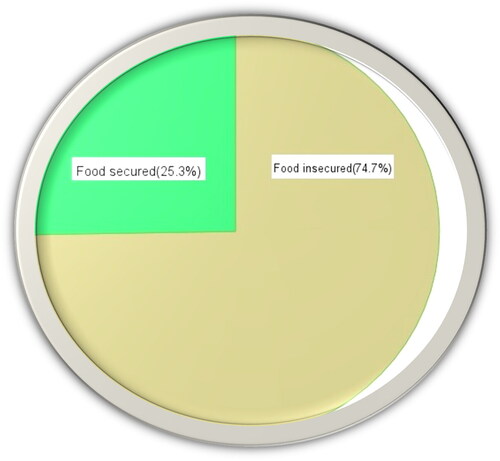
According to household data taken from the Kindo Koisha and Loma Bosa Woreda Agriculture and Natural Resource Management office, 2021, from the total 384 samples, 97 were food secure and 287 were food insecure. Of the food-secure households, 76 were male and 21 were female. However, 219 food-insecure households were males and 68 were females. The percentages of households with food insecurity and security were 74.7% and 25.3%, respectively, during the survey period from March up to May 2021().
Table 3. Food security status in terms of gender in Gibe III Dam area.
Gender of the households
[]
Educational status of the households
The educational status during the survey showed that households those who cannot read and write accounted for 33.1%, whereas those households who could read and write accounted for 66.9%. Food insecure households were 74.7% while insecure households were 25.3% in the study area (). This result is in line with Tsegaye and Bekele (Citation2010) in that about 73% and 27% of the sample households were found to food insecure and secure, respectively. Similarily, study by Meta et al. (Citation2018) revealed that 20.9 and 79.1% of households, respectively, were food secure and food insecure in Teleyayen sub watershed, South Wollo, Ethiopia.
Figure 4. Food security status of the households.
The house hold survey conducted from March up to April 2021 showed that 84.11% of the households perceived the threat of soil erosion on their farm land and their land did not give productivity ().
Table 4. Farmers perception about soil erosion in Gibe III Dam area.
4.2. Linking soil erosion to food security
Based on results, soil erosion is positively associated with family size, extension services, adoption of soil management practices, slope, soil erosion index, with a statistical significance of 1% (). For instance, awareness of the risks of soil erosion increased with family size in the study area. This might have been due to the fragmentation of the land by many children. Land fragmentation may increase soil erosion, affect agricultural production, and threaten food security. In contrast, Cholo et al. (Cohen, Citation1988) found that land fragmentation increases the likelihood of being insecure, rather than imposing challenges. The current study is in line with Betela and Wolka (Zhang et al., Citation2022), in which family size, access to extension services, plot position, and perceived severity of erosion had a positive association with the adoption of introduced physical conservation measures that control soil erosion to increase crop production and improve food security. Similarily, perception of farmers on land use land cover change had positive association with soil erosion at (p < .05). This was because as farmers perceive the presence of land use land change and the associated land degradation which contains soil erosion, the chance of adopting soil and water conservation practices increase to control soil erosion. Thus, productivity increases to ensure food security.
Table 5. Binary logistic regression showing the effects of soil erosion on food security.
4.3. Nutrient dynamics along land use and topography
The particle size distribution varied along the slope positions and land use. For instance, sand was the highest in forestland under a lower slope. Clay was higher in grazing land under the middle slope, whereas silt was the highest in crop land under the middle slope ().
Table 6. Particle distribution variation along slopes and land uses in Gibe III Dam Area.
On grazing land, soil at higher slope had a SOM of 4%, as opposed to 3% at lower slope. This is in line with Li et al. (Citation2015), who reported that the SOM content of soils at higher elevation was higher than at lower elevations in grazing land. This implies that the variations are created due to soil erosion aggravated by continuous clearing of forests and plowing of lands. This idea is in line with Li et al. (Citation2019) who found that increased soil erosion resulted in a decline in soil organic carbon at eroding upper slopes and increased at the locations where deposits were made Similarily the highest Soil organic carbon in grazing land (7.24 Mg C ha−1) was found by Seifu et al. (Citation2021). This finding is in contrast with line with Bufebo et al. (Citation2021) in which soil with the best quality was found in the lower landscape position and forest land, while less quality of soil was found in the upper landscape position and cultivated land.
The CV values for the PH,AP(PPM),textural classes, and CEC were between 0.1-0.6 under different land uses which according to Xiao-Yin et al. (Citation2015) fell under moderate variability. However, the CV for SOM, TN, and BD showed low variability in cropland. The mean CEC was lowest on cultivated land (24.2 C mol kg−1), highest on grazing areas (31 C mol kg−1) followed by forestland (26.4 C mol kg−1) (). A study by Gebremichael et al. (Citation2021) showed that tef fields had the lowest CEC (20.21 cmol(+kg)). Available phosphorus was highest (5.4 mg kg−1) in forest land followed by crop land 2.9 mg kg−1 while lowest (2 mg kg−1) in grazing land. This is in line with Selassie et al. (Citation2015) in which cropland had the highest available phosphorus (6.18 mg kg−1) whereas grazing lands had the lowest (1.33 mg kg−1.
Table 7. The variability of soil properties along slopes &land uses in Gibe III Dam Area.
During the focus group discussion (FGD), farmers stated that ‘‘the main challenge in Chereche, which is one of the selected kebeles in the Area, in Mid land was the land slide, accompanied by soil erosion and land degradation by water erosion, especially gully erosion. Of course, there were soil management techniques, but the landslide associated with soil erosion was beyond the magnitude of natural resource management practices. As FGD discussants expressed, there was serious food insecurity in the community, and it was difficult even to send children to school in Chereche Kebele in the Gibe III Dam Area’’. Chicho Haye kebele suffers from soil erosion, and productivity declines according to FGD discussants and key informant interviewees. In Fajena Kebele, the main cause of soil erosion was deforestation, although its severity was medium according to researcher observation and focus group and key informant results. This is true for Zima Waruma kebele in Loma bosa woreda, which is found in the low-land area. Soil/stone bund was the soil management technique used in the area during the field survey 2021-2022. shows significant main effects of slope and land use type at 5% on soil PH, SOC, TN, Pav(PPM), bulk density, cation exchange capacity, and particle sizes, such as sand and clay. With the exception of silt, all parameters in terms of slope positions were significant at (P < 0.0). The PH, SOC, TN, Pav(PPM), cation exchange capacity, and particle sizes vary with altitude and land use. Similarly, bulk density also showed variation along slope and land use at significant the 1% level ().
Table 8. Analysis of variance for soil nutrients in Gibe III dam area.
Land use significantly affected soil PH with [F(2, 18)=421, p = .05], and the effect size was large (partial eta squared = 0.98) based on criteria by Cohen (Citation1988). The slope also had a significant impact on soil PH [F (2, 18) =145, p = .05] and the effect size was large (partial eta squared = 0.94). There was also interaction effects of slope and land use on soil PH with [F(4, 18) =65, p =.05] and the partial eta squared = 0.942.In terms of soil organic matter, there was a statistically significant main effect of land use [F(2, 18)=237, p =.05], and the effect size was large (partial eta squared = 0.96). There was also main effect of slope on SOM [F(2, 18)=42, p =.05] and the effect size were large (partial eta squared = 0.82). The interaction effects of land use and slope on soil organic matter [F(4, 18)= 93, p =.05], and the effect size was large (partial eta squared = 0.95; ). This is in agreement with Degefa (Belay et al., Citation2017), who found that land use and topography gradients significantly affected soil physicochemical properties in Northern Ethiopia. Total nitrogen was affected by land use [F(2, 18)= 139.4, p =.05] and slope [F(2, 18)= 15.9, p = .05], with a significant effect size. This implies that Total nitrogen varied with land use and slope position, and that its variation could be linked to soil erosion. The interaction effects of land use and slope on total nitrogen [F(4, 18)= 47.4, p = .05] were significant (partial eta squared = 0.91)(). This is in line with Wambua and Kithiia (Citation2014), in which various soil nutrients such as Nitrogen, Phosphorous, and potassium Cation Exchange Capacity (CEC) and soil pH showed variability in relation to various land use systems that existed for a long time in the area. Similarily, the findings by Masha et al. (Citation2023) showed that TN, sand, and silt did not significantly vary with slope, soil texture classes, including sand and clay, bulk density, pH, SOC, Av. P, total N, CEC, and exchangeable bases, changed significantly (p < .05) with land use type. Agroforestry was shown to have the highest levels of soil pH, SOC, Av. P, CEC, whereas cultivated land had the highest concentration of sand.
Table 9. The effects of land use and topography on AVP, BD &CEC in Gibe III Dam Area
Table 10. Main and interaction of Phosphors, Bulk density and cation exchange capacity in Gibe III Dam Area.
Land use affected the available phosphors [F(2, 18)= 21.8, p = .05] with an effect size of 0.71. Similarly, the slope had a significant effect on phosphors [F(2, 18)= 3.79 p = .05], with a large effect of size (partial eta squared = 0.29)). The interaction effects of land use and slope on total nitrogen [F(4, 18)= 12, p = .05] were significant (partial eta squared = 0.72), which was large. In terms of bulk density, there was a statistically significant main effect of land use [F(2, 18)= 8.23, p = .05], and the effect size was 0.48, which is large. The main effect for slope [F(2, 18)= 19.8 p = .05] and the effect size was large (partial eta squared = 0.69)). The interaction effects of land use and slope on BD [F(4, 18)= 4.7, p = .05] were significant (partial eta squared = 0.5), which is large. Similarly, the main and interaction effects of land use and slope on CEC were significant (p < .05) ().
This was also true for sand, silt, and clay particles, which were significantly affected by the main and interaction effects of slope and land use and significant at 5% ().
Table 11. The main and interaction effects of land use and topography on Particle sizes in Gibe III Dam Area.
Particle-size distribution
The finding of this study revealed that sand content generally increased towards lower landscape positions, and this is most probably due to accelerated water erosion, which selectively removes fine particles (silt and clay) from the upper landscape position and deposits at lower slopes, and clay and silt showed an increasing trend from the upper slope towards the lower slopes in cropland, grazing, and forest lands (). The current study shows that there is variability or dynamics along the slope and land use in soil particles, which causes fertility variations that determine soil productivity. Variations in productivity threaten household food security status depending on variations in crop yields. This is in line with Assefa et al. (Citation2020), who showed that soil properties were strongly influenced by terrain slope, land use, and changes in management practices. Nutrients showed correlation with each other in correlation matrix. For instance, soil PH was positively correlated with SOM (r = 0.66, p < .01), silt (r = 0.47, p < .05), TN (r = 0.7, p < .01), clay (r = 0.57, p < .01), and CEC (r = 0.61, p < .01), but showed a negative correlation with sand(r = −0.70, p < .01). Similarly, SOM showed a significant positive relationship with TN (r = 0.97, p < .01) and silt (r = 0.40, p = .05). Total nitrogen (TN) showed a significant positive relationship with soil PH, SOM at p < .01, silt (r = 0.42, p < .01), and clay (r = 0.40, p < .05). However, TN showed a significant negative correlation with sand (r= −0.55, p < .01). Available phosphorous showed a significant relation with sand at p < .01 and a negative with silt and Clay at −.05. Sand was negatively correlated with Soil PH (r= −0.70, p < .01), soil organic matter(r = −0.51, p < .01), TN (r= −0.55, p < .05), but positively correlated with available phosphorous(r = 0.53, p < .01) (). Hayicho et al. (Citation2019) found that Total nitrogen had strong correlation with SOC(r = 0.391, p < .001). However, Kebebew et al. (Citation2022) found contrasting results in Chencha, Southwest Ethiopia, in which SOM and CEC showed a highly significant positive relationship, but the bulk density and soil pH showed a negative relationship. Gizaw and Tolesa (Citation2021) reported that sandy clay loam occupied 65% in Gilgel Gibe I catchment. The deficiency affects the total amount of nutrients available to plants as exchangeable cations, leading to poor yields. Soil erosion not only affects nutrient availability along land use, but slope is also determined by soil organic matter, bulk density, slope, and land use. It can be interpreted that the variations or dynamics in different slopes and land uses are indicators of the pushing factor. Soil erosion detaches material as one of the dominant pushing factors. The topsoil up to 0.20 cm is removed by soil erosion so that the nutrients are dislocated. Rural households are endangered, and their livelihoods, especially food security, are at risk.
Table 12. Matrix of correlation for soil nutrients at 0-20cm depth in Gibe III Dam Area.
The available phosphors of cultivated and grazing lands were lower by 97% and 98%, respectively, than forestland. In comparison to forestland, the percentage change in sand particle size was higher in cultivated land (65.33%) than in grazing land (62.67%). Contrarily, compared to forestland, the clay proportion on cultivated land and grazing land decreased by −66.56% and −59.78%, respectively. The pH of soils on cultivated and grazing lands was lower by 93.64% and 93.53%, respectively, than that of soils on forestland. The CEC of soils on cultivated and grazing lands was 75.8 and 69.0% lower, respectively, than the CEC of soils on forestland. Under crop land and grazing land, all of the selected soil nutrients were lower than under forest land Compared to forestland, the percentage changes in SOM were higher in cultivated land (−96.94%) than in grazing land (−96.74%) (). This study is in line with Adugna and Abegaz (Citation2016) in which the percentage changes in SOM were higher in cultivated land (−49%) than the change in grazing land (−19%) compared to forestland, although the proportion varies depending on the slope and land use as well as agroecology (). Higher total nitrogen, soil organic matter and cation exchange capacity was reported on lower slopes than upper slopes in Zikre watershed, North-Western Ethiopia (Selassie et al., Citation2015).
Table 13. Cultivated and grazing lands compared to forest land in terms of selected nutrient variations in Gibe III Dam Area.
Sand was lowest in crop lands (34.67%), followed by grazing lands (37.33%), whereas it was highest in forest lands (63.56%). There was a statistically significant difference in the means of grazing land, crop land, and forest land. Silt was highest in croplands (31.56%), followed by grazing lands (22.44%) and lowest in forests (15%). Clay was highest in in which grazing lands (40.22%), then crop lands (33.44%), lowest in forest lands (21.44%) (). This result was in contrast to Yitbarek (Citation2013), who found that clay was lower in crop lands than in forest and grazing lands.
Table 14. Mean value of soil nutrients at 0-20cm depth in Gibe III Dam Area.
Soil nutrients such as PH, organic matter, total nitrogen, and available phosphorus varied with land use (). The present study is in line with Leul et al. (Citation2023), in which soil properties that are important for soil quality varied significantly in different land uses.
Table 15. Variation of selected nutrients in cultivated, grazing &forest lands in Gibe III Dam Area.
Table 16. Variation of particle sizes with BD&CEC in Gibe III Dam Area.
5. Conclusions
There were dynamics of soil nutrients along slopes and land uses in Southern Ethiopia. Soil nutrients in the upper slopes and cultivated lands vary in amount and distribution from the lower slopes and forest lands. This is because soil erosion is more severe on steep slopes and croplands and less severe on lower slopes and forestland. The dynamic nature of soil nutrients caused by soil erosion determines crop yield, directly affecting the availability dimension of food security. For stance, the percentage increase in sand on cultivated land is larger (65.33%) than on grazing land (62.67%) when compared to forestland. However, compared to forestland, clay in crop land and grass lands declined by −66.56% and −59.78%, respectively. The mean CEC was highest on grazing land (30.9 C mol kg−1), then it decreased to 26.4 C mol kg−1in forestland, and it was lowest on crop land (24.2 C mol kg−1). The CEC in cropland and grazing land decreased by 75.8 and 69.0%, respectively. It was revealed that all selected soil nutrients under cropland and grazing land were lower than those under forest land. This study revealed that soil nutrients and textural classes varied significantly across different slope positions and land use types. Overall increases in SOC, TN, silt, and sand content from the steep to the gentle slopes were observed for the three land uses along the slopes, which is associated with the dislodging of soil particles from steep slopes and then transportation and sedimentation in low laying areas. The study revealed that soil nutrients varied depending on slope and land use. The important nutrients for crop yield were lower in the upper slope and cropland, indicating the severity of soil erosion. The results showed that soil erosion occurred in different land uses along slopes, which created variability in nutrient availability. The essential nutrients for plant growth were frequently depleted due to soil erosion in the upper slopes and cultivated lands in the Gibe III Dam Area, implying that the food security of rural households was at risk. Ethiopia’s economy depends on agriculture. Thus, any impact on agricultural production seriously affects the livelihoods of the community. Accelerating factors were also associated with soil management practices and erosion control mechanisms. Household survey results revealed that family size, farm size, extension service, adoption of physical and biological conservation practices, and the soil degradation index positively affected food availability. The main reason connecting the availability dimension of food security with soil erosion is that most food security needs are fulfilled by agriculture, which is the backbone of Ethiopia. To mitigate the effects of soil erosion and associated nutrient depletion, soil and water management practices should be implemented in Gibe III Dam Area, Upper Omo basin, Southern Ethiopia and similar geographical settings in the world with the same environmental risks. The outcome this study can be spring board for scientific research in which common understanding can be developed among scientific communities so that valuable insights can be generated implementable worldwide. Thus, this study has global importance in which it can shed light on the uses of land so that sustainable land use management practices can be applied not only specific study area but also extended to the countries in the world suffering from similar threats. Besides, understanding Ethiopia’s dynamics of land use, nutrient variability, and soil erosion can help develop sustainable agricultural techniques that increase productivity and guarantee a steady supply of food for local and international markets, which in turn influences trade. Soil erosion is global risk affecting communities depending on agriculture. By examining the dynamics of soil erosion in Southern Ethiopia, this study can develop strategies and techniques that work well in other contexts with related problems. This study can support global efforts aimed at controlling soil erosion, maintaining soil fertility and sustaining sustainable agriculture. Globally, agricultural systems are frequently concerned with soil nutrient variability. Studies carried out in the southern Ethiopia can provide insights into the factors affecting nutrient variability in soils in various land use types along slopes. The results have the potential to enhance nutrient management strategies, maximize fertilizer utilization, and advance sustainable farming methods worldwide. The results have the potential to support international endeavors aimed at mitigating soil erosion, enhancing the management of nutrients, endorsing sustainable land use methods, and guaranteeing food security in Ethiopia and other regions. Further research should be conducted to better link all food security dimensions with soil quality indicators taking large soil samples in the area. Besides, for land use assessments, the GIS and Remote sensing techniques and machine learning algorism should be applied which were not covered in the current study.
Acknowledgments
I am grateful to Wolaita Sodo and Arbaminch Universities for their support in strengthening this work. I owe appreciation to Kindo Koisha and Loma Bosa woreda agricultural officers in the Wolaita and Dawuro zones, respectively, for their help during data collection. I extend my appreciation to the Wolaita Sodo Soil Regional Laboratory for helping us during soil laboratory analysis.
Disclosure statement
No potential conflict of interest was reported by the author(s).
Additional information
Notes on contributors

Zewde Sufara Yagaso
Zewde Sufara Yagaso is a PhD student in the Department of Geography and Environmental Studies, College of Social Science and Humanities, Arbaminch University, Ethiopia. His areas of interest in research are soil erosion, agriculture, food security, and soil nutrients.

Teshome Yirgu Bayu
Professor Teshome Yirgu Bayu was born on 27/8/1961 GC. He is a full professor in Land Resource Management in the Department of Geography and Environmental Studies, College of Social Science and Humanities at Arba Minch University. He received his Ph.D. in Environmental Geography from Andhra University, India; M.Sc. in Land Resource Management and MSc. in Geography and Environmental Studies from Addis Ababa University. Professor Teshome has published more than 25 peer-reviewed articles in international journals.

Mulugeta Debele Bedane
Dr. Mulugeta Debele Bedane has received his PhD from Haramaya University, Ethiopia. He is currently advising PhD students in the rank of assistant professor in the department of geography and Environmental studies. He is serving as dean of college of social science and Humanities.
References
- Adugna, A., & Abegaz, A. (2016). Effects of land use changes on the dynamics of selected soil properties in northeast Wellega, Ethiopia. Soil, 2(1), 1–19. https://doi.org/10.5194/soil-2-63-2016
- Amare, A., & Simane, B. (2017). Assessment of household food security in the face of climate change and variability in the Upper Blue-Nile of Ethiopia. Journal of Agricultural Science and Technology B, 7(4), 285–300. https://doi.org/10.17265/2161-6264/2017.04.006
- Assefa, F., Elias, E., Soromessa, T., & Ayele, G. T. (2020). Effect of changes in land-use management practices on soil physicochemical properties in Kabe watershed, Ethiopia. Air, Soil and Water Research, 13, 117862212093958. https://doi.org/10.1177/1178622120939587
- Bashagaluke, J. B., Logah, V., Opoku, A., Sarkodie-Addo, J., & Quansah, C. (2018). Soil nutrient loss through erosion: Impact of different cropping systems and soil amendments in Ghana. PLoS One. 13(12), e0208250. https://doi.org/10.1371/journal.pone.0208250
- Belay, H., Mekuriaw, A., GSelassie, Y., & Tsegaye, L. (2017). The effect of soil loss on selected ecosystem services in the Northwestern Highlands of Ethiopia HabtamuTadele 1. Comparison of measured and derived topographic factor values for soil loss estimation view project. Researchgate.Net, 7(4), 3–10. [Online]. Available www.iiste.org
- Betela, B., & Wolka, K. (2021). Evaluating soil erosion and factors determining farmers’ adoption and management of physical soil and water conservation measures in Bachire watershed, southwest Ethiopia. Environ. Challenges, 5(2021), 100348. https://doi.org/10.1016/j.envc.2021.100348
- Blake, G. R., & Hartge, K. H. (1986). Bulk density. In: Klute, A. (Ed.), Methods of soil analysis, Part 1—Physical and mineralogical methods. (2nd ed., Agronomy Monograph 9, pp. 363–382). American Society of Agronomy—Soil Science Society of America.
- Bouyoucos, G. J. (1962). Hydrometer method improved for making particle size analysis of soils. Agronomy Journal, 54(5), 464–465. https://doi.org/10.2134/agronj1962.00021962005400050028x”
- Bremner, C. S., & Mulvaney, J. M. (1982). Nitrogen-total. In Page, A. L., Miller, R. H. & Keeney, D. R. (Eds.), Methods of soil analysis. Part 2. Chemical and microbiological properties (pp. 595–624). Wisconsin.
- Bufebo, B., Elias, E. & Agegnehu, G. (2021). Effects of landscape positions on soil physicochemical properties at Shenkolla Watershed, South Central Ethiopia. Environmental Systems Research, 10, 14. https://doi.org/10.1186/s40068-021-00222-8
- Chowdhuri, I., Pal, S. C., Saha, A., Chakrabortty, R., & Roy, P. (2021). Evaluation of different DEMs for gully erosion susceptibility mapping using in-situ field measurement and validation. Ecological Informatics, 65(September), 101425. https://doi.org/10.1016/j.ecoinf.2021.101425
- Cochran, W. G. (1977). Sampling techniques (3rd ed.). John Wiley & Sons.
- Cohen, J. (1988). Statistical power analysis for the behavioral sciences (2nd ed.). Hillsdale, NJ: Lawrence Erlbaum Associates, Publishers
- Degefa, T. (1996). Belg crop production as a strategy of households’ food security: A comparative study of Belg grower and Non-belg grower farmers in MunessaWereda, Arsi Zone [MA thesis]. Addis Ababa University.
- Degu, M., Melese, A., & Tena, W. (2019). Effects of soil conservation practice and crop rotation on selected soil physicochemical properties: The case of Dembecha district, Northwestern Ethiopia. Applied and Environmental Soil Science, 2019, 1–14. https://doi.org/10.1155/2019/6910879
- Donis, A., & Assefa, K. (2017). Characterization of physicochemical properties of soils as influenced by different land uses in Bedele Area in Ilubabor Zone, Southwestern Ethiopia. Journal of Natural Sciences, 7(5), 37–50.
- Estifanos, T. H., & Gebremariam, B. (2019). Modeling-impact of land use/cover change on sediment yield (case study on Omo-gibe Basin, Gilgel Gibe III Watershed, Ethiopia). American Journal of Modern Energy, 5(6), 84–93. https://doi.org/10.11648/j.ajme.20190506.11
- Gebremichael, A., Kebede, A., & Woyessa, Y. E. (2021). Effect of land use land cover change on stream flow and sediment yield in Gibe III Watershed, Omo-Gibe Basin, Ethiopia. Journal of Earth Science and Climatic Change, 12(10), 20. https://doi.org/10.4172/2157-7617.1000585
- Gitima, G., Teshome, M., Kassie, M., & Jakubus, M. (2022). Spatiotemporal land use and cover changes across agroecologies and slope gradients using geospatial technologies in Zoa watershed, Southwest Ethiopia. Heliyon, 8(9), e10696. https://doi.org/10.1016/j.heliyon.2022.e10696
- Gizaw, T. (2021). Soil erodibility analysis and mapping in Gilgel Gibe-I catchment, Omo-Gibe River Basin, Ethiopia. Applied and Environmental Soil Science. 2021, 1–7. 2021, https://doi.org/10.1155/2021/8985783
- Gomiero, T. (2016). Soil degradation, land scarcity and food security: Reviewing a complex challenge. Sustainability, 8(3), 281. https://doi.org/10.3390/su8030281
- Hailu, H., Mamo, T., Keskinen, R., Karltun, E., Gebrekidan, H., & Bekele, T. (2015). Soil fertility status and wheat nutrient content in Vertisol cropping systems of central highlands of Ethiopia. Agriculture & Food Security, 4(1), 1–10. https://doi.org/10.1186/s40066-015-0038-0
- Hayicho, H., Alemu, M., & Kedir, H. (2019). Assessing the effects of land-use and land cover change and topography on soil fertility in Melka Wakena catchment of Sub-Upper Wabe-Shebelle Watershed, South Eastern Ethiopia. Journal of Environmental Protection, 10(05), 672–693. https://doi.org/10.4236/jep.2019.105040
- Kebebew, S., Bedadi, B., Erkossa, T., Yimer, F., & Wogi, L. (2022). Effect of different land-use types on soil properties in Cheha District, South-Central Ethiopia. Sustain, 14(3), 1323. https://doi.org/10.3390/su14031323
- Leul, Y., Assen, M., Damene, S., & Legass, A. (2023). Effects of land use types on soil quality dynamics in a tropical sub-humid ecosystem, western Ethiopia. Ecological Indicators. 147(January), 110024. https://doi.org/10.1016/j.ecolind.2023.110024
- Li, F. B., Guang-de, L., Xi-yue, Z., Hui-xiang, N, Chun-chun, X., Chao, Y., Xiu-mei, Y., Jin-fei, F., & Fu-ping, F. (2015). Elevation and land use types have significant impacts on spatial variability of soil organic matter content in Hani terraced field of Yuanyang County, China. Rice Science, 22(1), 27–34. https://doi.org/10.1016/j.rsci.2015.05.005
- Li, T., Zhang, H., Wang, X., Cheng, S., Fang, H., Liu, G., & Yuan, W. (2019). Soil erosion affects variations of soil organic carbon and soil respiration along a slope in Northeast China. Ecological Processes, 8(1), 2–8. https://doi.org/10.1186/s13717-019-0184-6
- Masha, M., Belayneh, M., Bojago, E., Tadiwos, S., & Dessalegn, A. (2023). Impact of land-use and topography on soil physicochemical properties in the Wamancho watershed, southern Ethiopia. Journal of Agriculture and Food Research, 14, 100854. https://doi.org/10.1007/s10661-023-11059-2
- Meta, A., Agidew, A., & Singh, K. N. (2018). Determinants of food insecurity in the rural farm households in South Wollo Zone of Ethiopia: the case of the Teleyayen sub-watershed. Agricultural and Food Economics, 6(1), 1–23. https://doi.org/10.1186/s40100-018-0106-4
- Negese, A. (2021). Impacts of land use and land cover change on soil erosion and hydrological responses in Ethiopia. Applied and Environmental Soil Science. 2021, 1–10. https://doi.org/10.1155/2021/6669438
- Ngnipa, R. T., Tabi, F. O., Adamou, S., Tamfuh, P. A., Kome, G. K., Boukong, A., & Mvondo Ze, A. D. (2021). Relationship between selected soil physico-chemical characteristics and Mycorrhizal status under Triumfetta cordifolia in the Cameroon Western Highlands. Open Journal of Soil Science, 11(04), 216–240. https://doi.org/10.4236/ojss.2021.114012
- Nguyen, T. T., Grote, U., Neubacher, F., Rahut, D. B., Do, M. H., & Paudel, G. P. (2023). Security risks from climate change and environmental degradation: implications for sustainable land use transformation in the Global South. Curr. Opin. Environ. Sustain, 63(June), 101322. https://doi.org/10.1016/j.cosust.2023.101322
- Olsen, S. R., Cole, C. V., & Watanabe, F. S. (1954). Estimation of available phosphorus in soils by extraction with sodium bicarbonate. USDA Circular No. 939. US Government Printing Office.
- Pimentel, D. (2006). Soil erosion: A food and environmental threat. Environment, Development and Sustainability, 8(1), 119–137. https://doi.org/10.1007/s10668-005-1262-8
- Reeuwijk, L. P. V. (1993). Procedures for soil analysis. International Soil Reference and Information Centre Technical Paper No.1.
- Saha, A., Pal, S. C., Arabameri, A., Chowdhuri, I., Rezaie, F., Chakrabortty, R., Roy, P., & Shit, M. (2021). Optimization modelling to establish false measures implemented with ex-situ plant species to control gully erosion in a monsoon-dominated region with novel in-situ measurements. Journal of Environmental Management, 287(February), 112284. https://doi.org/10.1016/j.jenvman.2021.112284
- Seifu, W., Elias, E., & Gebresamuel, G. (2020). The effects of land use and landscape position on soil physicochemical properties in a semiarid watershed, northern Ethiopia. Applied and Environmental Soil Science. 2020, 1–20. https://doi.org/10.1155/2020/8816248
- Seifu, W., Elias, E., Gebresamuel, G., & Khanal, S. (2021). Impact of land use type and altitudinal gradient on topsoil organic carbon and nitrogen stocks in the semi-arid watershed of northern Ethiopia. Heliyon, 7(4), e06770. https://doi.org/10.1016/j.heliyon.2021.e06770
- Selassie, Y. G., Anemut, F., & Addisu, S. (2015). The effects of land use types, management practices and slope classes on selected soil physico-chemical properties in Zikre watershed, North-Western Ethiopia. Environmental Systems Research, 4, 3. https://doi.org/10.1186/s40068-015-0027-0
- Tilahun, A., Asmare, T., Nega, W., & Gashaw, T. (2023). The nexus between land use, land cover dynamics, and soil erosion: A case study of the Temecha watershed, upper Blue Nile basin, Ethiopia. Environmental Science and Pollution Research International, 30(1), 1023–1038. https://doi.org/10.1007/s11356-022-22213-7
- Tsegaye, G., & Bekele, W. (2010). Farmers’ perceptions of land degradation and determinants of food security at Bilate watershed, Southern Ethiopia. Ethiop. J. Appl. Sci. Technol, 1(July), 49–62. https://doi.org/10.13140/RG.2.1.3382.8968
- Walkley, A., & Black, I. A. (1934). An examination of the Degtjareff method for determining soil organic matter and a proposed modification of the chromic acid titration method. Soil Science, 37(1), 29–38. https://doi.org/10.1080/15538362.2019.1640167. https://doi.org/10.1097/00010694-193401000-00003
- Wambua, B. N., & Kithiia, S. M. (2014). Effects of soil erosion on sediment dynamics, food security and rural poverty in Makueni District, Eastern Kenya. International Journal of Applied Science and Technology, 4(1), 101–107.
- Xiao-Yin, N. I. U., et al. (2015). Effect of land use on soil erosion and nutrients in Dianchi Lake Watershed, China. Pedosphere, 25(1), 103–111. https://doi.org/10.1016/S1002-0160(14)60080-1
- Yitbarek, T. (2013). Impacts of land use on selected physicochemical properties of soils of Abobo Area, Western Ethiopia. Agriculture, Forestry and Fisheries, 2(5), 177. https://doi.org/10.11648/j.aff.20130205.11
- Zhang, R., Rong, L., & Zhang, L. (2022). Soil nutrient variability mediates the effects of erosion on soil microbial communities: results from a modified topsoil removal method in an agricultural field in Yunnan plateau, China. Environmental Science and Pollution Research International, 29(3), 3659–3671. https://doi.org/10.1007/s11356-021-15894-z
- Zohrabi, M. (2013). Mixed method research: Instruments, validity, reliability and reporting findings. Theory and Practice in Language Studies, 3(2), 254–262. https://doi.org/10.4304/tpls.3.2.254-262