
 ?Mathematical formulae have been encoded as MathML and are displayed in this HTML version using MathJax in order to improve their display. Uncheck the box to turn MathJax off. This feature requires Javascript. Click on a formula to zoom.
Abstract
The COVID-19 pandemic posed an unprecedented shock on the demand and supply chains of commodities, thus, disrupting trade flows globally. Albeit East African Community (EAC) countries reported negative trade balances even prior to the inception of the pandemic; it remains unknown as to whether the situation significantly deteriorated in the pandemic era. This study, therefore, evaluated the impact of the COVID-19 pandemic on the trade balance of EAC economies for the period March 2020–December 2022 using the PMG model. Further, it assessed the differentiated impact of the pandemic on the value of imports and exports. First, the findings revealed the presence of a long-run relationship between COVID-19 and trade deficit/imports/exports in the region. Secondly, whereas the impact of the pandemic on the trade deficit was insignificant in the short run; it was positive and significant in the long run. This suggested that despite the easing of the stringent lockdown measures, countries in the region are still feeling the effects of the pandemic. Thirdly, while the pandemic significantly increased imports in the short run, its impact was insignificant in the long run. Contrariwise, no impact of the pandemic was found on exports. The study, thus, recommends that though current increased controls and surveillance on trade remain inevitable, such measures should be instigated in a manner that does not overly disrupt the normal trade flows. Additionally, EAC countries need to bolster their production chains to guarantee self-reliance which is critical in ensuring that intraregional trade in the region remains buoyant in such challenging times.
Keywords:
Reviewing Editor:
1. Introduction
The COVID-19 pandemic has massively disrupted both global and regional trade by impacting the normal flow of commodities. The coronavirus disease has hastily spread around the world since December 2019 when it was first reported in Wuhan, China, and continues to pose an unprecedented shock on the demand and supply chains of commodities. Statistics from the World Trade Organization (World Trade Organization, Citation2021) estimated a fall in international merchandise trade volumes by 9.2% in 2020. This figure is comparable in magnitude to that reported during the global financial crisis of 2008–2009. Further, Baldwin and Tomiura (Citation2020) predicted that the pandemic could pose severe health and economic crises comparable to the catastrophic effects brought about by the Second World War.
Since the inception of the pandemic, several studies have been undertaken to investigate its impact on trade. However, given that the eventual outcomes of the pandemic remain relatively unknown (McKibbin & Fernando, Citation2021); most studies have generally focused on making forecasts or predictive estimates of trade volumes based on the severity of the pandemic. For instance, World Trade Organization (Citation2020) forecasted that the global merchandise trade volume would fall in the range of between 13% and 32% in 2020. Similarly, the region-specific forecasts predicted a 10.6% decrease in exports for the sub-Saharan Africa (SSA) region countries. On the other hand, World Bank (Citation2020) forecasted an 11% and 7% decrease in exports and imports, respectively, for the SSA region for the year 2020.
Nevertheless, some notable studies have indeed estimated the effects of the pandemic on trade flows (see for example Barbero et al., Citation2021 for European countries; De Lucio et al., Citation2020 for Spain; Hayakawa & Kohei, Citation2021 for global selected countries; Kassa, Citation2020 for SSA countries; Kejžar et al., Citation2022 for European Union member countries; Liu et al., Citation2021 for China; Verschuur et al., Citation2021 for Europe, Asia and United States). Most of these studies have generally employed the gravity models of trade and found a considerable decline in bilateral trade occasioned by the COVID-19 pandemic.
Notwithstanding the vast array of literature examining the impact of the pandemic on trade; the period of study under investigation is rather short and raises eyebrows as to whether this conclusively captures the effects of the COVID-19 pandemic on trade. In a nutshell, most of these studies analyze the pandemic’s effects on trade for the period spanning 2020 and 2021. Further, while numerous studies have been conducted in different jurisdictions, we find scanty evidence of the pandemic’s impact on trade in the EAC region. Although the analysis by Mold and Mveyange (Citation2020) attempts to examine the impact of the pandemic on regional trade in the EAC, it rather delves more into Kenya and only makes forecasts as opposed to the actual impact of the pandemic on trade using the confirmed number of COVID-19 cases.
This study, therefore, deviates from the previous studies by first analyzing the degree of differences in the impact of the COVID-19 pandemic on the trade balance in the EAC region using the Pooled Mean Group (PMG)-Autoregressive Distributed Lag Model (ARDL) model. Secondly, it also separately explores the pandemic’s impact on the value of imports and exports in the region. The study focuses on three countries, that is, Kenya, Rwanda, and Uganda, and uses monthly panel data for the period March 2020 to December 2022. This lengthened period enables us to conduct a concrete analysis and draw meaningful conclusions. It also takes into consideration the fact that several countries globally are still feeling the effects of the pandemic despite the easing of the stringent COVID-19 lockdown measures that were instituted by governments globally in large sections of the 2020 and 2021 periods to contain the virus.
It is observed that even though the COVID-19 lockdown measures that were instituted by governments globally at the onset of the pandemic aimed at containing the virus; they restricted the mobility of people and commodities which further impeded trade flows both domestically and internationally, hence, creating a negative supply shock through supply chain disruptions (Baldwin & Tomiura, Citation2020). Conversely, the demand chain was impacted by the considerable stockpiling of critical commodities such as food products & medical items. This prompted a surge in demand for the aforementioned items hence increasing the value of imports (Kassa, Citation2020; Mold & Mveyange, Citation2020). The lockdown policies culminated in economic uncertainty and also led to business closures and the overall shrinkage of economic activities. This yielded considerable unemployment that lowered the demand for globally traded goods, predominantly durable goods (Kassa, Citation2020; Verma & Gustafsson, Citation2020). Further, the cross-border closures coupled with international travel restrictions constrained trade flows worldwide by increasing trade costs through border-clearance delays which were necessitated by the COVID-19 test requirements (Banga et al., Citation2020).
Generally, the immediate observable effects implied that the value of both imports and exports was impacted by the pandemic. and show the import and export trends across the selected countries in the EAC region for the period running from March 2020 to December 2022. The generally higher value of imports compared to exports insinuates a negative trade balance (see ) over the COVID-19 pandemic period (see Section 3.3.3 on Extended Summary Statistics).
Figure 1. Imports value for the selected EAC countries in USD million (March 2020–December 2022). Source: Central Bank of Kenya (CBK), National Bank of Rwanda (NBR), and Bank of Uganda (BOU) Statistical Databases. Notes: The value of imports is measured in USD million.
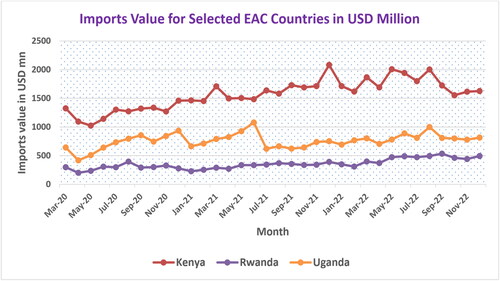
Figure 2. Exports value for the selected EAC countries in USD million (March 2020–December 2022). Source: CBK, NBR, and BOU Statistical Databases. Notes: The value of exports is measured in USD million.
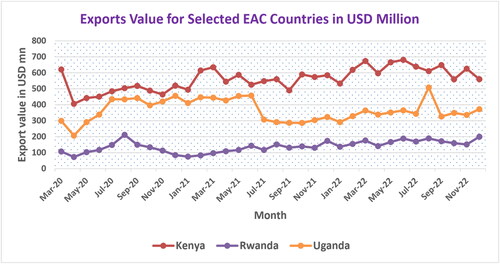
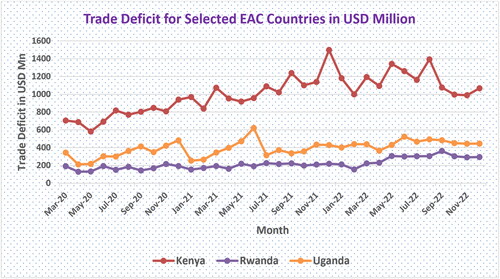
Figure 3. Trade deficit for the selected EAC countries in USD million (March 2020–December 2022). Source: CBK, NBR, and BOU Statistical Databases. Notes: The values shown in depict a negative trade balance (trade deficit).
Three main findings emerged from this study. First, the study established evidence of a long-run relationship between the COVID-19 pandemic and trade deficit/imports/exports in the EAC region. This owed to the negative and statistical significance of the respective Error Correction Term (ECT) coefficients. Secondly and more importantly, an insignificant impact of the pandemic on the trade deficit was found in the short run. In the long run, however, the pandemic significantly increased the trade deficit in the EAC region. This suggested that despite the easing of the stringent lockdown measures, countries in the EAC region are still yet to fully recover from the negative effects of the pandemic. Thirdly, whereas the impact of the pandemic on imports was found to be positive and significant in the short run, it was insignificant in the long run. Furthermore, COVID-19 did not significantly impact exports both in the short run and in the long run.
The rest of the paper is structured as follows: Section 2 reviews the existing literature while Section 3 discusses the methodology, data & variables used. Section 4 presents and discusses the empirical findings while Section 5 concludes the paper.
2. Literature review
2.1. Theoretical review
Several theories have been propounded in literature to explain what factors drive trade. These theories originate from the classical school of thought proponents i.e. see the theory of absolute advantage by Smith (Citation1776) and that of comparative advantage by Ricardo (Citation1817). Building on these earlier works are the neoclassical theories and more predominantly the Heckscher–Ohlin factor endowment (see Heckscher, Citation1919; Ohlin, Citation1933) and the factor price equalization & income distribution (see Jones, Citation1956; Stolper & Samuelson, Citation1941) models. Whereas, the classical theories consider trade models involving two countries, two goods, and only one factor of production (labor); the neoclassical proponents advance much more improved trade models that consider two trading partners, trading in two goods and more factors of production (that’s labor and capital for the Heckscher–Ohlin model) and (labor, capital & territory for the factor price equalization & income distribution models). Notwithstanding the various models’ assumption differences; a striking synonymy among these theories is the conjecture that wage rate (income) and exchange rate are two critical factors likely to define the patterns of trade among countries.
More importantly, the Heckscher–Ohlin theory explains why countries trade in commodities with each other, with emphasis laid on the difference in resource or factor endowments between two countries. The model shows that comparative advantage is indeed influenced by the interaction between the resources that countries have (relative abundance of factors of production) and production technology (which determines the relative intensity by which the varying production factors are utilized in the production cycle). Conversely, and by some virtue of novelty contribution, the Samuelson-Jones model provides the ideology that a country capital-endowed but with less land tends to produce more manufactured products than food products, regardless of the price, whereas a country that is territory-endowed tends to produce more food. Therefore, in ceteris paribus, a capital increase implies an increase in marginal productivity from the manufactured sector, whereas an increase in the offer of territory will raise the production of food to the detriment of manufacturers. In a nut shell, trade between the two countries would create an integrated global economy whose manufacture and food production equals the sum of the two trading partners’ productions.
Gradually departing from the trade theories and in close connection with this study, notable theoretical literature lends credence to three central approaches in explaining trade balance fluctuations. They include the absorption, monetarist, and elasticity approaches. Under the absorption approach, a country’s trade balance improves if the total output exceeds the total domestic expenditures. Consequently, currency devaluation will improve the balance of trade only if the gap between domestic output and domestic expenditure increases (Alexander, Citation1959; Meade, Citation1951). On the other hand, the monetarist approach posits that excess demand or supply for foreign commodities would necessitate more demand or supply of a corresponding stock of money (Mundell, Citation1972; Polak, Citation1957). In other words, if the money demand exceeds the money supply, then the excess money demand will be mollified by inflows of money from abroad, hence improving the balance of trade and vice versa. Finally, the elasticity approach shows that real devaluation of domestic currency yields a favorable impact on the balance of trade. This is conditioned on the sum of the price elasticities of exports & imports being greater than one (Lerner, Citation1944; Marshall, Citation1923). Currency depreciation makes domestic goods cheaper and, thus, attractive for trading partners. This, consequently, increases exports of domestic commodities hence improving the trade balance.
Some studies, however, point to the exchange rate as a key determinant of trade balance and provide a theoretical foundation that relies on the concept of the J-curve phenomenon. This concept posits that real devaluation of domestic currency initially deteriorates the balance of trade (that’s in the short run) but subsequently improves it (in the long run) (see Bahmani-Oskooee, Citation1985; Bahmani-Oskooee & Brooks, Citation1999; Magee, Citation1973; Narayan & Narayan, Citation2004; Rose & Yellen, Citation1989). More particularly, Magee (Citation1973) argued that contracts negotiated before the domestic currency devaluation may be the sole cause for the worsening of the trade balance in the short run. Theoretically and congruent to the elasticity approach (see Lerner, Citation1944; Marshall, Citation1923); devaluation indeed improves the balance of trade by making domestic goods cheaper to the foreign trading partners, hence, increasing exports.
2.2. Empirical review
Several studies have been undertaken to understand the impact of the COVID-19 pandemic on trade globally. The first strand of the empirical literature concentrates on developed economies with the last strand focusing on African economies.
Barbero et al. (Citation2021) examined the pandemic’s impact on bilateral trade flows using the gravity model. They employed monthly trade data for the period January 2019–October 2020 and covered 68 countries that exported across 222 destinations. Their findings revealed a significantly larger negative effect of the pandemic on bilateral trade for those countries that were members of regional trade agreements before the inception of the pandemic. Further, the impact of the pandemic was found to be negative and significant when government policy actions were considered. Lastly, the negative impact was found to be more intense when the exporter and importer countries shared identical income levels with the highest negative impact alluded to those exports between high-income countries.
Liu et al. (Citation2021) employed the gravity-like model approach in analyzing the impact of COVID-19 pandemic-related deaths and lockdown policies on countries’ imports from China during the 2020 year. They found that a country’s COVID-19 deaths & lockdowns significantly reduced its imports from China, signifying that the negative demand shock effects of the pandemic triumphed over the negative supply shock effects. In contrast, COVID-19 deaths in the country’s leading trading partners (China excluded) induced more imports from China, thus, partially offsetting the countries’ effects. Verschuur et al. (Citation2021) employed maritime trade shipping data for the period January 2020–June 2020 in analyzing the impact of the pandemic on trade for various countries across Europe, Asia, and the United States. The study applied the automatic identification system approach to observational data. The findings revealed that though different effects were visible across the countries, the general trend exhibited pronounced declines in trade.
According to the study by De Lucio et al. (Citation2020) for the period January 2020–July 2020, Spanish exports significantly reduced due to the severity of lockdown measures at the destination countries. The decline was, however, non-colossal for the imports. In an extended view, Kejžar et al. (Citation2022) examined the impact of the pandemic on trade in Spanish goods & services. The findings revealed a more pronounced decrease in trade in services owing to the paramount role played by tourism in the Spanish economy. Further, Kejžar et al. (Citation2022) used monthly bilateral trade data of European Union (EU) member countries from June 2015 to May 2020 to pinpoint the role of forward chain linkages for the transmission of the pandemic’s demand shocks. Their findings alluded that the spread of the virus coupled with the institution of stringency lockdown measures by governments not only lowered the demand for tradable commodities further but also contracted labor supply and productivity.
According to Espitia et al. (Citation2021), COVID-19 significantly reduced trade growth when the most relevant trade partners were considered. They allude to this decline decrease in the countries’ involvement in Global Value Chains from the onset of the pandemic to June 2020. While considering a larger sample of countries, Hayakawa and Kohei (Citation2021) examined the impact of the pandemic on trade flows. The study focused on export flows for 35 reporting countries and 250 partner countries for the periods January–August 2019 and January–August 2020. The study was restricted entirely to tradable medical goods. The findings revealed that increased COVID-19 stringency-related measures lead to lesser exports of medical items.
In the African context, Mold and Mveyange (Citation2020) used Kenyan trade data (March 2020 to May 2020) to evaluate the influence of the COVID-19 pandemic on regional trade in the EAC region. Ironically, the first quarter of 2020 was a rather fortunate trade period for Kenya in which exports improved substantially, coupled with the moderation of imports, which resulted in a palpable decrease in its trade deficit. The analysis noted that not all supply chains were distressed by the pandemic In fact; some Kenyan exports such as tea and fruit bettered the levels recorded in the preceding years. The prime victim of the crisis has rather been the imports which declined by a quarter over the period under investigation. More critically, capital goods imports declined strikingly.
In the SSA region, the inception of the pandemic saw a substantial stockpiling of essential commodities i.e. food products and medical items. According to Kassa (Citation2020), this triggered a surge in demand for these commodities. Additionally, the lockdown policies culminated with economic uncertainty also led to business closures and the overall shrinkage of economic activities. This yielded considerable unemployment that lowered the demand for internationally traded goods; with a predominant effect on durable goods (Kassa, Citation2020; Verma & Gustafsson, Citation2020). Moreover, the cross-border closures coupled with international travel restrictions constrained trade flows worldwide by increasing trade costs through border-clearance delays which were necessitated by the COVID-19 test requirements as a pre-requisite to mobility (Banga et al., Citation2020). In particular, using a desk review approach, Bello and Gidigbi (Citation2021) analyzed the impact of trade on economic growth in Nigeria with a special focus on the role of the COVID-19 pandemic. The study established that the pandemic indeed triggered the need for most countries to accelerate digital trade facilitation coupled with structural changes that can minimize contact during trade processes and facilitation. It also reiterated the importance of the proposed African Continental Free Trade Area (AfCFTA) agreement. In a similar vein, the desk-review analysis by Bello and Gidigbi (Citation2022) indicated that there was a decline in trade patterns during and in the post-Covid-19 pandemic era globally and more so in Nigeria. More specifically, the study revealed that unlike in the pre-Covid-19 trade era, there was increasing migration of trade to digital networks in the post-Covid-19 period which is a significant futuristic milestone for African countries.
Drawing partly from the majority of the empirical studies, we augment the COVID-19 pandemic’s impact on trade using a number of control variables. These include the Consumer Price Index (CPI), exchange rate, broad money supply, lending rate, and crude oil price. First, we hypothesize that a higher CPI (proxy to inflation) increases the cost of inputs which translates into an increased cost of domestic production. This favors imports while deteriorating exports hence increasing the trade deficit (see Shawa & Shen, Citation2013). Second, currency depreciation boosts exports but makes imports more expensive. Therefore, it is expected that domestic currency depreciation will improve the balance of trade (see Keho, Citation2021). Third and in line with the monetarist theory, a higher money supply is expected to increase the inflation rate in an economy which in turn raises the costs of inputs such as materials and labor. Costly domestic production makes exports expensive but imports cheaper hence increasing the trade deficit (see Polak, Citation1957; Mundell, Citation1972). Fourth, a lower lending rate triggers a depreciation of the domestic currency (since firms can borrow more money from commercial banks). This increases the competitiveness of exports while making imports more expensive (see Batra & Beladi, Citation2013). Five, higher global oil prices increase the distance elasticity of trade. We hypothesize that this makes trade less global due to high import costs for the net oil-importing countries, thus, impacting negatively on a country’s balance of trade (see Varlik & Berument, Citation2020). Our choice of the control variables is premised on monthly data (dimension) availability for the selected countries and largely borrows from literature. We acknowledge the modest deviation from the variables employed in the gravity models of trade but attribute this to the current focus of our study on the COVID-19 pandemic shock.
The reviewed empirical literature highlights the impact of the pandemic on trade flows in different jurisdictions as well as factoring in different types of commodities. It is noted that the period of investigation for these studies is relatively short and hence does not provide a concrete analysis of the pandemic’s impact on trade. This is also considering that much attention had been placed on the COVID-19 lockdown measures which have since been eased and in some cases dropped entirely by most governments globally. In the present study, we provide empirical evidence on the impact of the COVID-19 pandemic on the trade balance of a selected panel of countries within the East African Community region. While previous studies have covered different jurisdictions/regions, there is a clear lack of empirical evidence focusing exclusively on the EAC region. Although the analysis by Mold and Mveyange (Citation2020) attempts to examine the impact of the pandemic on regional trade in the EAC, it rather delves much into Kenya and only makes forecasts as opposed to the actual impact of the pandemic on trade using the confirmed number of COVID-19 cases. This study also deviates from the previous studies by analyzing the degree of differences in the impact of the COVID-19 pandemic on the aforementioned EAC countries using the PMG-ARDL model framework. Further, it separately explores the pandemic’s impact on the value of imports and exports for these countries for a more lengthened study period hence providing meaningful conclusions.
3. Methodology
3.1. Theoretical model
Trade balance is basically explained as the difference between the total value of exports and the total value of imports of commodities in an economy. To provide a simple theoretical foundation for our study, we rely on theoretical findings that essentially lend credence to the exchange rate-trade balance nexus (see Bahmani-Oskooee, Citation1985; Bahmani-Oskooee & Brooks, Citation1999; Magee, Citation1973; Narayan & Narayan, Citation2004; Rose & Yellen, Citation1989). In most of these models, the trade balance is expressed as a function of the bilateral exchange rate between two trading countries and both countries’ incomes. Precisely, the model is defined as:
(1)
(1)
Where TB is the trade balance, E is the bilateral exchange rate between the USD and the trading partner country i’s currency. I denotes the country i’s income.
This model has been augmented and modified empirically to assess the determinants of the trade balance. In our study, however, we partly draw from this theoretical background but with some modifications to incorporate other key drivers of trade balance as propounded by the monetarist approach (see Mundell, Citation1972; Polak, Citation1957) and the elasticity approach (see Lerner, Citation1944; Marshall, Citation1923).
3.2. Analytical model
This study sought to analyze the impact of the COVID-19 pandemic on the trade balance among three economies in the EAC region. More precisely, we sought to assess whether the trade deficit increased or decreased across the countries in the pandemic era. We cover the period commencing March 2020 up to December 2022 (for Kenya, Rwanda, and Uganda) but exclude other countries within the EAC region due to the (monthly) frame data availability limitations as well as a lack of meaningful statistics on COVID-19 for some countries such as Tanzania.
Vast empirical studies analyzing bilateral trade flows have employed the gravity model of trade independently developed by Tinbergen (Citation1962) and Poyhonen (Citation1963) and advanced by Anderson (Citation1979) and Anderson and Van Wincoop (Citation2003) among others. The model assumed that the amount of trade between the two countries increased in their sizes, as measured by their national incomes, and decreased in the cost of transport between them, as measured by the distance between their economic centers. Empirically, the gravity models have been widely employed (see for instance Abreo et al., Citation2022; Álvarez et al., Citation2018; Barbero et al., Citation2021; Liu et al., Citation2021).
However, considering the monthly time dimension of our dataset (T = 34) and multiple country-case dimension (N = 3), we employed the Pooled Mean Group (PMG)-Autoregressive Distributed Lag Model (ARDL) model developed by Pesaran et al. (Citation1999). This estimation approach is found more appropriate in the context of our broad study objective (which seeks to assess the degree of differences in the impact of the COVID-19 pandemic on trade balance among selected EAC countries) and the monthly time dimension of our data set (that’s March 2020–December 2022). Empirically, Keho (Citation2021) employed the PMG-ARDL model to analyze the drivers of trade balance in West African Monetary and Economic Union (WAEMU) countries. This study, therefore, specifies an analytical model that borrows from that of Keho (Citation2021) but with some modifications to incorporate the monthly-measured control variables as augmenting factors to the trade balance-COVID-19 model.
Under this methodology, we include the lagged value of the regressand as a regressor to capture the inertia of the trade balance. We begin by specifying the following model:
(2)
(2)
Where are the coefficients of lagged dependent variables,
are the (k × 1) coefficients’ vector,
denotes the trade deficit of a country i at time t and
is a (k × 1) vector of regressors. In EquationEquation 2
(2)
(2) , Trade Balance (TB) is substituted with Trade Deficit (TD) considering that across the EAC region, the trade balance is negative for the entire study period. The subscript
refers to the cross-sectional unit, i.e. country while
refers to the time or study period. The term
allows for cross-sectional fixed effects while
is the error term. The terms p and q are the optimal lag orders. The re-parameterized ARDL model (p, q)-Error Correction Model (ECM) can be shown in EquationEquation 3
(3)
(3) as follows:
(3)
(3)
where
denotes the group-specific speed of adjustment coefficient (with the expectation that
) and
is a vector of the long-run relationships. The Error Correction Term (ECT) is given by:
. Finally, the short-run dynamic coefficients are represented by
and
.
EquationEquation 3(3)
(3) shows both the short-run coefficients (with difference operators) and the long-run coefficients (without difference operators). For simplicity, we specify and estimate the following model:
(4)
(4)
where COV is the number of confirmed COVID-19 cases & CPI denotes the Consumer Price Index (proxy to inflation). E is a country’s exchange rate against the United States Dollar (USD). M2 refers to the broad money supply while LR denotes the average commercial banks’ lending rate. OILPR represents global oil prices in USD per barrel. Re-parametrizing EquationEquation 3
(3)
(3) in an ARDL-ECM framework yields EquationEquation 5
(5)
(5) :
(5)
(5)
Where EquationEquation 5(5)
(5) presents a summarized and simplified ARDL-ECM framework that captures the speed of adjustment term, the ECT component, the lag length, and both the short-run and long-run coefficients.
Further, this study also sought to examine the impact of the COVID-19 pandemic on imports and exports across the selected countries in the EAC region. To achieve this objective, we specified the following models:
(6a)
(6a)
(6b)
(6b)
where IMP and EXP denote the value of imports and exports respectively.
3.3. Variable definition and hypothesized relationships
3.3.1. Trade deficit (TD)
The difference between the total value of exports and the total value of imports of commodities in an economy (measured in USD million). Across the sample, the trade balance was reported as negative for the entire study period (March 2020–December 2022). The trade deficit variable is recorded monthly and is expressed in a natural log in our model. It’s our dependent variable in the main model.
3.3.2. Imports (IMP)
Measured by the total value of imported commodities by a given country. It is recorded monthly in USD million. It is expressed in a natural logarithm and acts as a dependent variable in our second model.
3.3.3. Exports (EXP)
The total value of commodities exported by a given country abroad. It is recorded monthly in USD million. It is expressed in a natural logarithm and is the regressand in our third model.
3.3.4. COVID-19 confirmed cases (COV)
The monthly number of confirmed COVID-19 cases in a country. It’s expressed in a natural logarithm. The pandemic acted as a negative shock by disrupting the normal trade flows due to the panic created in the business environment globally. Further, the closure of countries’ borders and international travel restrictions mired trade flows globally through delayed cross-border clearance. This consequently led to increased trade costs which culminated in widened trade deficits for the majority of developing countries (Banga et al., Citation2020; Barbero et al., Citation2021; De Lucio et al., Citation2020).
In this study, we also incorporated some control variables that directly or indirectly impact the trade balance of any given economy. These variables are drawn from both theoretical and empirical literature and are relevant in explaining the trade cycle/pattern. The intertwinement between them and the trade balance is also briefly explained.
3.3.5. Consumer price index (CPI)
Refers to an index measuring the changes in the price level of a weighted average market basket of consumer commodities. We express it in a natural log in our model(s) and it acts as a proxy for the rate of inflation in an economy. The higher the domestic CPI, the higher the cost of inputs. This increases the costs of domestic production hence favoring imports which translates into an increased trade deficit (Shawa & Shen, Citation2013).
3.3.6. Exchange rate (E)
The rate at which one country’s currency exchanges for another. This is recorded monthly and expressed in terms of USD. A weaker domestic currency (currency depreciation) fuels exports but makes imports more expensive. As such, domestic currency depreciation improves the trade balance, thus, lowering the trade deficit (Keho, Citation2021). The exchange rate variable is expressed in a natural log.
3.3.7. Broad money supply (M2)
This consists of all cash and coins in circulation, short-term bank deposits & money market short-term securities. Theoretically, higher M2 Money is expected to increase the inflation rate in an economy. Higher inflation rates in return raise the costs of inputs i.e. materials and labor. As a result, this can substantially impede the competitiveness of a given country’s exports in the international markets. Conversely, with cheaper imports, the trade deficit is likely to increase significantly (Mundell, Citation1972; Polak, Citation1957).
3.3.8. Lending rate (LR)
The average rate at which the majority of commercial banks lend to their credit-worthy clients. It is measured in percentage form and recorded monthly. The lower the lending rate, the higher the tendency for the domestic currency to depreciate. This increases the competitiveness of exports while making imports more expensive (Batra & Beladi, Citation2013).
3.3.9. Crude oil price (OILPR)
The Organization of the Petroleum Exporting Countries (OPEC) price of a basket of oil in USD. Higher global oil prices increase the distance elasticity of trade. This makes trade less global due to high import costs for the net oil-importing countries, thus, impacting negatively a country’s balance of trade (Varlik & Berument, Citation2020).
3.4. Data
This study utilized monthly panel data for the period covering March 2020–December 2022. The data covered three countries namely: Kenya, Rwanda, and Uganda. This study period was chosen since the first case of the COVID-19 disease was reported in the EAC region in March 2020. Data on the trade deficit, imports, exports, CPI, exchange rate, M2 money, and commercial banks’ average lending rate were obtained from country-specific Central Banks & the National Bureau of Statistics databases. The data on COVID-19 confirmed cases were sourced from WHO reports and country-specific ministries of health databases. Finally, data on crude oil prices was obtained from the OPEC database.
4. Analysis, estimation and results
4.1. Summary statistics
4.1.1. General summary statistics
shows the general summary statistics for the entire panel.
Table 1. Summary statistics of study variables.
The monthly trade deficit across the three countries averaged about 538.82 USD million. The highest recorded trade deficit amounted to 1498.83 USD million while the lowest amounted to 128.60 USD million over the study period. Further, the statistics reveal an average higher value of imports compared to exports over the same period. This further re-affirms a worsened balance of trade across the region that might have escalated in the wake of the COVID-19 disease outbreak. Concerning the COVID-19 pandemic, we found that the number of confirmed COVID-19 cases averaged about 6339 persons with the least number reported at 39 and the highest at 39,940 people respectively.
The mean CPI value across the panel was found to be approximately 125.82 points. The CPI variable varied within the intervals of 107 and 180.90. CPI acts as a proxy for inflation and is used as an indicator for commodity prices in an economy. A higher CPI, therefore, denotes inflationary pressure in an economy. In an extended view, the statistics showed that the crude oil prices averaged about 70.94 USD per barrel with the highest monthly price recorded at 117.72 and the lowest recorded at 17.66 USD per barrel respectively. An increase in oil price has a substantial implication on trade since fluctuations in global oil prices considerably increase the distance elasticity of trade. This trigger increased trade costs which impacts negatively the trade balance of oil-importing countries.
The average monthly exchange rate against the USD was recorded at 1589.37. Whereas the lowest rate at which the domestic currency was exchanged for the USD was 103.74, the highest rate was 3832.45 over the study period. The Broad Money (M2) across the panel averaged 14,267.63 USD million and varied within the intervals of 2001.61 USD million and 35,806.4 USD million respectively. On the other hand, the rate at which commercial banks lend out money to their credit-worthy clients averaged about 15.66% monthly. Whereas the lowest rate charged was 11.75%, the highest rate was 20.93%.
4.1.2. Country-specific panel statistics
We also provided a comprehensive summary of statistics for each country forming the panel (see ).
4.1.3. Extended summary statistics
To visualize the trends in trade value for exports, imports, and the resultant trade balance for the selected EAC countries over the study period, we plotted . and show the import and export values respectively while the trade balance is represented by .
In both and , we observe that the import and export value of commodities in the EAC region was highest for Kenya, followed by Uganda and lastly Rwanda. All the countries also imported more than they exported over the study period. The trends also revealed modest swings (increase and decrease) in the value of both imports and exports across the selected countries. This is, notwithstanding, the sharp rise in the value of imports for Kenya (in December 2021) and Uganda (in June 2021) and corresponding exports for Kenya (in March 2022) and Uganda (in August 2022) respectively.
Consequently, the trade deficit was computed by obtaining the difference between the export and import values (see ).
revealed a higher trade deficit for Kenya in comparison to Uganda and Rwanda. Further, we observe a steady rise in the trade deficit for Kenya but a generally modest trend for Uganda and Rwanda.
In light of the trade flow trends depicted in ; this study sought to investigate whether the COVID-19 pandemic indeed played a major role in explaining the trade flow trends in the EAC region.
4.2. Diagnostics and robustness checks
4.2.1. Pre-estimation tests
Several pre-estimation tests were conducted prior to the estimation of the PMG model. They include the correlation analysis, unit root test, cointegration test, and lag length selection criteria.
4.2.1.1. Correlation analysis
The pairwise correlation matrix was performed to ascertain the presence of multicollinearity. The results indicated a weak degree of association among the regressors (see Appendix ).
4.2.1.2. Unit root test
The IPS unit root test after Im et al. (Citation1997) was used to check for the stationarity level of the variables. The panel ARDL model requires that the variables be integrated of order 0 or 1 or a combination of both. The IPS unit root test assumes that slopes are heterogeneous across the panels. The null hypothesis states that all panels contain unit roots against the alternative hypothesis that posits that some panels are stationary. We reject the null hypothesis of non-stationarity if the probability value is found to be less than the 5% level of significance. shows the unit root test results.
Table 2. Panel unit root test results.
The stationarity test results presented in indicated that the variables were integrated of order 0 or 1 or a combination of both. Thus, we estimated a PMG-ARDL model.
The PMG estimator proposed by Pesaran et al. (Citation1999) assumes the homogeneity of long-run coefficients. It does allow the intercepts, short-run coefficients & error variances to differ freely across groups. Under the stated assumption of long-run slope homogeneity; the PMG estimator is, thus, regarded as consistent and efficient.
4.2.1.3. Cointegration test
To ascertain whether a long-run relationship exists between the trade deficit/imports/exports and the explanatory variables, we performed the Pedroni (Citation1999, Citation2004) cointegration tests. Under the null hypothesis of ‘No Cointegration’, all test statistics are distributed between 0 and 1 i.e. N (0, 1), and diverge to negative infinity (save for panel v). If all the test statistics (except v) are not distributed within the above-stated range, then the null hypothesis of no cointegration is rejected. The results (for the 3 models) indicated that not all the test statistics were distributed between 0 and 1 (see Appendix ). We, therefore, rejected the null hypothesis of ‘No Cointegration’ implying that both our panel and group (across the 3 models) indeed exhibited cointegration among the variables. Subsequently, we modeled the ECM within the panel ARDL-PMG framework to capture both the short-run and long-run relationships among the variables.
4.2.1.4. Lag selection criteria
The optimal lag length of the variables was determined using Schwarz’s Bayesian Information Criterion (SBIC). The criterion specified a lag selection of (1 0 0 0 0 0 0) which was common for each variable across all the three countries forming the panel.
4.3. Estimation results
4.3.1. The impact of the COVID-19 pandemic on trade balance in the EAC region
The main objective of this study was to analyze the degree of differences in the impact of the COVID-19 pandemic on the trade balance among selected EAC countries. Having established the presence of cointegration among the variables, we estimated the panel ARDL-PMG model. The full PMG trade deficit model estimates are presented in .
Table 3. Full pooled mean group model regression results-trade deficit estimates.
From the estimation results, we find that the ECT is significant for all three countries hence suggesting the presence of a long-run relationship between the COVID-19 pandemic and the trade deficit in the EAC region. The Error Correction Term (ECT) was negative and statistically significant at a 1% level of significance for Kenya, Rwanda, and Uganda. In the case of Rwanda, any deviations from the long-run equilibrium were corrected at an adjustment speed of 99.7%. However, in the case of Kenya and Uganda, the models overcorrected the dis-equilibrium at adjustment speeds of 107.1% and 125.4% respectively.
Surprisingly, the impact of the COVID-19 pandemic on the trade deficit was found to be statistically insignificant in the short run. This is contrary to our expectations considering that at the inception of the pandemic, governments globally instituted lockdown measures (port and border) which mired domestic and international trade flows hence reducing trade activity. However, considering the short time and the fact that both countries globally were also hit by the pandemic, then the expected positive short-run effect on the trade deficit in the EAC region might have been partially offset/neutralized altogether. In the long run, however, we found a positive and significant effect of the COVID-19 pandemic on trade deficit. More precisely, a 1% increase in the number of confirmed COVID-19 cases significantly (at 1% level) increased the trade deficit in the EAC region by 0.045% ceteris paribus. This is consistent with most of the empirical studies which attributed the reduced trade activity to the lockdown measures which severely restricted the mobility of both goods and people and consequently increased the trade costs (Banga et al., Citation2020; Barbero et al., Citation2021; De Lucio et al., Citation2020; Liu et al., Citation2021).
Holding other factors constant, a 1% increase in the Consumer Price Index (CPI) and the crude oil price significantly increased the trade deficit in the EAC region by 2.10% and 0.23% respectively. Both variables were significant at a 1% significance level. Consistent with previous empirical literature, a higher domestic CPI fuels the cost of production inputs. This increases the costs of domestic production hence making exports expensive. This in turn favors imports, thus, increasing the trade deficit (see Shawa & Shen, Citation2013). On the other hand, higher global oil prices increase the distance elasticity of trade which makes trade less global due to high import costs for the net oil-importing countries. As argued by Varlik and Berument (Citation2020), this negatively impacts a country’s balance of trade.
4.3.2. The impact of the COVID-19 pandemic on imports and exports in the EAC region
The study also sought to examine the impact of the COVID-19 pandemic on imports and exports across the selected countries in the EAC region. The full PMG estimates are presented in and respectively.
Table 4. Full pooled mean group model regression results-import estimates.
Table 5. Full pooled mean group model regression results-export estimates.
The import estimates in also revealed the presence of a long-run relationship between the COVID-19 pandemic and imports in the EAC region. The ECT was negative and statistically significant at a 1% level of significance across the three countries. For the case of Rwanda and Uganda, any deviations from the long-run equilibrium were corrected at an adjustment speed of 88.8% and 47.2% respectively. Nonetheless, in the case of Kenya, the model overcorrected itself at an adjustment speed of 105.7%. In the short run, we found a significant impact of the COVID-19 pandemic on Kenya’s and Rwanda’s imports (at a 10% significance level) and Uganda’s imports (at a 1% significance level). This short-run increase in imports could be attributed to the increase in the demand for essential goods such as food products and medical items which were sourced externally to help in the fight against the pandemic (Kassa, Citation2020). Further, unlike in the trade deficit model, COVID-19 did not significantly impact imports in the EAC region in the long run. This could perhaps be owed to the gradual economies’ re-opening and the relaxation of the COVID-19 stringent lockdown measures that were introduced by governments in the EAC region at the onset of the pandemic.
Contrary to expectations, a broad money supply was found to significantly reduce Kenyan imports in the short run. Theoretically, a higher M2 Money increases the inflation rate in an economy which in return raises the costs of inputs. This impedes the competitiveness of a given country’s exports in the international markets (see Mundell, Citation1972; Polak, Citation1957). Our results, therefore, contradict the theory (in the short run). However, in tandem with our expectations, an increase in crude oil prices significantly increased the value of Ugandan imports both in the short run and in the long run. This further reiterated the findings by Varlik and Berument (Citation2020). In the case of Rwanda, we found a significant positive impact of lending rate on imports in the short run. This finding is similar to that obtained by Batra and Beladi (Citation2013) for the case of the United States. In their study, the authors associated higher lending rates with increased domestic currency appreciation tendencies. This reduces the competitiveness of exports while making imports cheaper.
Furthermore, we found a significant (at a 10% level) but negative impact of the exchange rate on EAC imports in the long run. More succinctly, a 1% increase in exchange rate (currency depreciation) reduced imports by 1.22% in the EAC region in the long run ceteris paribus. It is expected that currency depreciation promotes exports but dampens imports by making them more expensive. Therefore, domestic currency depreciation improves the balance of trade. Our findings are similar to those obtained by Keho (Citation2021) in the case of WAEMU countries.
Moreover, the study also examined the impact of the COVID-19 pandemic on export value in the EAC region. The export estimates are presented in .
The export estimates in also revealed the presence of a long-run relationship between the COVID-19 pandemic and exports in the EAC region. The ECT was negative and statistically significant at a 1% level of significance for both Kenya and Uganda and a 10% significance level for Rwanda. More specifically, the results showed that any deviations from the long-run equilibrium were corrected at adjustment speeds of 86.2%, 26.0%, and 58.4% for Kenya, Rwanda, and Uganda respectively. Further, and focusing exclusively on exports, our study revealed no significant impact of the COVID-19 pandemic on exports both in the short-run and long run. In the case of Rwanda, contrary to our expectations, we found a significant positive impact of lending rate on exports in the short run. Moreover, our findings that an increase in crude oil price increases exports in the EAC region, in the long run, negate previous literature (see Varlik & Berument, Citation2020).
5. Conclusions and policy implications
This study examined the impact of the COVID-19 pandemic on trade balance in the EAC region using the PMG-ARDL model. Further, the study also separately explored the pandemic’s impact on the value of imports and exports in the EAC region. Evidence of a long-run relationship was established between the pandemic and the trade deficit. There was also evidence of a long-run relationship between the pandemic and both exports and imports in the region owing to the negative and statistical significance of the respective Error Correction Terms.
More concisely, while the COVID-19 pandemic significantly and positively determined imports in the short run, its impact was insignificant in the long run. Nevertheless, COVID-19 did not significantly impact exports both in the short run and in the long run. More importantly, we found an insignificant impact of the pandemic on the trade deficit in the short run. In the long run, however, the pandemic significantly increased the trade deficit in the EAC region. This suggested that despite the easing of the stringent lockdown measures (port and cross-border closures) that were instituted by most governments globally to contain the pandemic; countries in the EAC region are still feeling the effects of the pandemic. This could be attributed to the severely disrupted global production and supply chains. Although the recovery process is ongoing, it is rather slow and has been further curtailed by other global crises such as the Russia-Ukraine conflict and climate change crises that have emerged over the same period.
This study recommends as follows: First, while increased controls and surveillance on trade remain inevitable at the present time, such measures should be instigated in a manner that does not overly disrupt the normal trade flows. One notable policy roadmap would be the digitalization of trade activities given the rapidly rising mobile technology adoption and usage across countries in the EAC region. This would boost connectivity and, thus, substantially steer online businesses and transactions regardless of any economic shocks. Secondly, EAC countries need to bolster their production chains to ensure production continuity and self-reliance in the wake of any global pandemics. Thirdly, rapid implementation of the ongoing trade initiatives in the region such as TradeMark East Africa (TMEA)-Safe Trade Emergency Facility and the African Continental Free Trade Agreement (AfCFTA) is critical in ensuring that intraregional trade in the EAC region and Africa in its entirety remains buoyant in such challenging times of the COVID-19 pandemic as well as other emerging global crises.
Finally, there is a need for future research to analyze the bilateral trade balance of the EAC region and the rest of the world in both the current and post-COVID-19 pandemic era to inform robust global-based recovery policy actions.
Acknowledgements
The author is indeed thankful to the anonymous referees and the Editor for their constructive comments which substantially improved on the earlier version of this paper.
Disclosure statement
No potential conflict of interest was reported by the author(s).
Data availability statement
The data used for this study and the supporting Stata analyses do-files can be made available upon reasonable request from the author. The data is freely and readily accessible and was sourced from the country-specific Central Banks, the National Bureau of Statistics, Ministries of Health, and OPEC databases.
Additional information
Notes on contributors
Cyprian Amutabi
Cyprian Amutabi primary areas of research include Labor Economics, Financial Economics, and Econometric Modelling.
References
- Abreo, C., Bustillo, R., & Rodriguez, C. (2022). Trade agreement and trade specialization between Colombia and the EU. Investigación Económica, 81(321), 1–18. https://doi.org/10.22201/fe.01851667p.2022.321.79688
- Álvarez, I. C., Barbero, J., Rodríguez-Pose, A., & Zofío, J. L. (2018). Does institutional quality matter for trade? Institutional conditions in a sectoral trade framework. World Development, 103, 72–87. https://doi.org/10.1016/j.worlddev.2017.10.010
- Alexander, S. S. (1959). Effects of devaluation: A simplified synthesis of elasticities and absorption approaches. American Economic Review, 49(1), 22–42. https://www.jstor.org/stable/1808056
- Anderson, J. E. (1979). A theoretical foundation for the gravity equation. American Economic Review, 69(1), 106–116. https://www.jstor.org/stable/1802501
- Anderson, J. E., & Van Wincoop, E. (2003). Gravity with gravitas: A solution to the border puzzle. American Economic Review, 93(1), 170–192. https://doi.org/10.1257/000282803321455214
- Bahmani-Oskooee, M. (1985). Devaluation and the J-curve: Some evidence from LDCs. The Review of Economics and Statistics, 67(3), 500–504. https://doi.org/10.2307/1925980
- Bahmani-Oskooee, M., & Brooks, T. J. (1999). Bilateral J-curve between US and her trading partners. Weltwirtschaftliches Archiv, 135(1), 156–165. https://doi.org/10.1007/BF02708163
- Baldwin, R., & Tomiura, E. (2020). Thinking ahead about the trade impact of COVID-19. In R. Baldwin & B. W. di Mauro (Eds.), Economics in the time of COVID-19 (pp. 59–72). Centre for Economic Policy Research (CEPR).
- Banga, K., Keane, J., Mendez-Parra, M., Pettinotti, L., & Sommer, L. (2020). Africa trade and Covid 19: The supply chain dimension. Working paper 586. Addis Ababa, Ethiopia: African Trade Policy Centre.
- Barbero, J., de Lucio, J. J., & Rodríguez-Crespo, E. (2021). Effects of COVID-19 on trade flows: Measuring their impact through government policy responses. PloS One, 16(10), e0258356. https://doi.org/10.1371/journal.pone.0258356
- Batra, R., & Beladi, H. (2013). The US trade deficit and the rate of interest. Review of International Economics, 21(4), 614–626. https://doi.org/10.1111/roie.12059
- Bello, K. M., and Gidigbi, M. O. (2022). The pattern of trade flows in Nigeria during the pre- and post-era of Covid-19. Regional Economic Development Research, 2(3), 31–47. https://doi.org/10.37256/redr.232021925
- Bello, K. M., & Gidigbi, M. O. (2021). The effect of trade on economic growth in Nigeria: Does Covid-19 matters? African Journal of Economic Review, 9(3), 21–33.
- De Lucio, J., Minguez, R., Minondo, A., & Requena, A. F. (2020). The impact of COVID-19 containment measures on Trade. Working Paper 2101. Department of Applied Economics II, Universidad de Valencia.
- Espitia, A., Mattoo, A., Rocha, N., Ruta, M., & Winkler, D. (2021). Pandemic trade: COVID-19, remote work, and global value chains. The World Economy, 45(2), 561–589. https://doi.org/10.1111/twec.13117
- Hayakawa, K., & Kohei, I. (2021). Who sends me face masks? Evidence for the impacts of COVID-19 on international trade in medical goods. The World Economy, 45(2), 365–385. https://doi.org/10.1111/twec.13179
- Heckscher, E. (1919). The effect of foreign trade on the distribution of income. Ekonomisk Tidskrift, 21, 497–512.
- Im, K. S., Pesaran, M. H., & Shin, Y. (1997). Testing for unit roots in heterogeneous panels. Mimeo, Department of Applied Economics: University of Cambridge.
- Jones, R. W. (1956). Factor proportions and the Heckscher-Ohlin theorem. The Review of Economic Studies, 24(1), 1–10. https://doi.org/10.2307/2296232
- Kassa, W. (2020). COVID-19 and trade in SSA: Impacts and policy response (Issue 1, No.1). World Bank.
- Keho, Y. (2021). Determinants of trade balance in West African Economic and Monetary Union (WAEMU): Evidence from heterogeneous panel analysis. Cogent Economics & Finance, 9(1), 1970870. https://doi.org/10.1080/23322039.2021.1970870
- Kejžar, K. Z., Velić, A., & Damijan, J. P. (2022). Covid-19, trade collapse and GVC linkages: European experience. The World Economy, 45(11), 3475–3506. Epub ahead of print. https://doi.org/10.1111/twec.13314
- Lerner, A. P. (1944). The economics of control: Principles of welfare economics. Macmillan.
- Liu, X., Ornelas, E., & Shi, H. (2021). The trade impact of the Covid-19 pandemic. Center for Economic Performance (CEPR) Discussion Paper No. 1771: CEPR.
- Magee, S. P. (1973). Currency contracts, pass-through, and devaluation. Brookings Papers on Economic Activity, 1973(1), 303–325. https://doi.org/10.2307/2534091
- Marshall, A. (1923). Money, credit and commerce. Macmillan & Company.
- McKibbin, W., & Fernando, R. (2021). The global macroeconomic impacts of COVID-19: Seven scenarios. Asian Economic Papers, 20(2), 1–30. https://doi.org/10.1162/asep_a_00796
- Meade, J. E. (1951). The balance of payments. Oxford University Press.
- Mold, A., & Mveyange, A. (2020). The impact of the COVID-19 crisis on trade: Recent evidence from East Africa. Brookings Institution.
- Mundell, R. A. (1972). Monetary theory: Inflation, interest and growth in the world economy. The Economic Journal, 82(325), 259–261. https://doi.org/10.2307/2230240
- Narayan, P. K., & Narayan, S. (2004). The J-curve: Evidence from Fiji. International Review of Applied Economics, 18(3), 369–380. https://doi.org/10.1080/0269217042000227088
- Ohlin, B. (1933). Interregional and international trade. Harvard University Press. Revised edition, 1967. Excerpts are contained in W. R. Allen (Ed.), 1965, Chapter. 7
- Pedroni, P. (2004). Panel cointegration; asymptotic and finite sample properties of pooled time series tests, with an application to the PPP hypothesis. Econometric Theory, 20(03), 597–625. https://doi.org/10.1017/S0266466604203073
- Pedroni, P. (1999). Critical values for cointegration tests in heterogeneous panels with multiple regressors. Oxford Bulletin of Economics and Statistics, 61(S1), 653–670. https://doi.org/10.1111/1468-0084.0610s1653
- Pesaran, M. H., Shin, Y., & Smith, P. R. (1999). Pooled mean group estimation of dynamic heterogeneous panels. Journal of the American Statistical Association, 94(446), 621–634. https://doi.org/10.2307/2670182
- Polak, J. J. (1957). Monetary analysis on income formation and payments problems. Staff Papers - International Monetary Fund, 6(1), 1–50. https://doi.org/10.2307/3866128
- Poyhonen, P. (1963). A tentative model for the volume of trade between countries. Weltwirtschaftliches Archiv, 90, 93–100. https://www.jstor.org/stable/40436776
- Ricardo, D. (1817). The theory of comparative advantage. In D. Ricardo, P. Sraffa, & M. H. Dobb (Eds.), Principles of political economy and taxation (Vol. 1). Cambridge University Press.
- Rose, A. K., & Yellen, J. L. (1989). Is there a J-curve? Journal of Monetary Economics, 24(1), 53–68. https://doi.org/10.1016/0304-3932(89)90016-0
- Shawa, M. J., & Shen, Y. (2013). Analysis of the determinants of trade balance: Case study of Tanzania. International Journal of Business and Economics Research, 2(6), 134–141. https://doi.org/10.11648/j.ijber.20130206.13
- Smith, A. (1776). Inquiry into the nature and causes of wealth of the nations. Edited with an Introduction, Marginal Summary and an Enlarged Index by Edwin Canaan, 6th Edition, Vol. 2, London, 1950.
- Stolper, W. F., & Samuelson, P. A. (1941). Protection and real wages. The Review of Economic Studies, 9(1), 58–73. https://doi.org/10.2307/2967638
- Tinbergen, J. (1962). Shaping the world economy: Suggestions for an international economic policy. Twentieth Century Fund.
- Varlik, S., & Berument, M. H. (2020). Oil price shocks and the composition of current account balance. Central Bank Review, 20(1), 1–8. https://doi.org/10.1016/j.cbrev.2020.02.002
- Verma, S., & Gustafsson, A. (2020). Investigating the emerging COVID-19 research trends in the field of business and management: A bibliometric analysis approach. Journal of Business Research, 118(C), 253–261. https://doi.org/10.1016/j.jbusres.2020.06.057
- Verschuur, J., Koks, E. E., & Hall, J. W. (2021). Observed impacts of the COVID-19 pandemic on global trade. Nature Human Behaviour, 5(3), 305–307.https://doi.org/10.1038/s41562-020-0896-8
- World Bank. (2020). Global economic prospects, June 2020. https://doi.org/10.1596/978-1-4648-1553-9
- World Trade Organization. (2021). Trade cost index: Evolution, incidence and determinants: background note. WTO.
- World Trade Organization. (2020). Methodology for the WTO trade forecast of April 8, 2020. Economics Research and Statistics Division, WTO. https://www.wto.org/english/news_e/pres20_e/methodpr855_e
Appendix A
Table A1. Different summary statistics per panel.
Table A2. Correlation matrix.
Table A3. Pedroni cointegration test results.