
 ?Mathematical formulae have been encoded as MathML and are displayed in this HTML version using MathJax in order to improve their display. Uncheck the box to turn MathJax off. This feature requires Javascript. Click on a formula to zoom.
Abstract
Food insecurity remains persistent challenges in Ethiopia. This study analyzed secondary data to examine the prevalence and drivers of these issues. Food insecurity was assessed using 2014-2019 Gallup World Poll data and the Food Insecurity Experience Scale methodology. Logistic regression identified vulnerable subgroups. Qualitative interviews offered context on structural drivers. Analysis found 52.1% of Ethiopians experienced moderate or severe food insecurity in 2019, up from 47.7% in 2014. Severe food insecurity rose from 12.0% to 15.8%. Individuals aged 35-44 years and in the second lowest income quintile had higher likelihood of food insecurity. In 2019, 37% of children under 5 were stunted, indicating chronic malnutrition. Stunting was more prevalent in rural areas (40% vs 26% urban) and varied by region from 48.4% in Tigray to 15% in Addis Ababa. Stunting declined with mother’s education and household wealth. Wasting affected 7% of children. Interviews pointed to interconnected factors including poverty, agricultural underinvestment, gender inequality, climate vulnerability, and policy limitations driving food insecurity. Overall, the analysis demonstrates persistently high and worsening food insecurity despite economic growth, indicating the need for multi-sectoral strategies to strengthen rural agricultural livelihoods, social protection, women’s empowerment, and child nutrition. These findings can inform policy aimed at meeting SDG 2 in Ethiopia.
IMPACT statement
Our research uncovers the critical issue of food insecurity and malnutrition in Ethiopia, revealing that over half the population faced moderate to severe food insecurity between 2014 and 2019. The study delves into the socio-demographic factors influencing food insecurity, highlighting the disproportionate impact on children under five, with a significant number experiencing stunting due to chronic malnutrition. By integrating both quantitative data and qualitative interviews, the research provides a comprehensive understanding of the structural drivers behind this issue, including agricultural challenges, poverty, and policy gaps. The findings underscore the urgent need for targeted policy interventions that address the root causes of food insecurity and malnutrition, emphasizing the importance of supporting smallholder farmers, enhancing women’s empowerment, and prioritizing nutrition-sensitive agriculture. This study offers valuable insights for policymakers, stakeholders, and the international community, aiming to contribute to the global efforts in achieving Sustainable Development Goal 2: Zero Hunger in Ethiopia.
REVIEWING EDITOR:
1. Introduction
Food security is defined as a “situation when all people, at all times, have physical, social and economic access to sufficient, safe and nutritious food that meets their dietary needs and food preferences for an active and healthy life” (FAO, Citation2001). Globally, food insecurity is a growing public health problem predicted to continue increasing. Although rates of severe food insecurity are higher in low-income countries, food insecurity is nonetheless a public health concern globally, with an estimated prevalence of between 8% and 20% of the population in some high-income countries (FAO et al., Citation2017).
According to Sisha (Citation2020), Ethiopia has a long history of famines and food shortages, mostly due to climate shocks exacerbated by socio-economic and political factors. A significant proportion of the country’s population is highly vulnerable to food insecurity for any natural or man-made shocks. For example, the 2016 El Niño left about 10.2 million Ethiopians needing emergency food and nutrition assistance. Recent statistics show that, in the Somali National Region (one of the 9 National Regions of Ethiopia), more than half (58% or 3.7 million people) of the region’s population were aided by World Food Program’s emergency relief assistance due to a reduction in the amount of rainfall during one production season (Sisha, Citation2020).
Food security has six key dimensions: availability, access (economic, physical and social), utilization, stability, agency and sustainability. Food access means “having personal or household financial means to acquire food for an adequate diet at a level to ensure that satisfaction of other basic needs are not threatened or compromised; and that adequate food is accessible to everyone, including vulnerable individuals and groups” (HLPE, Citation2020). A portion of this paper will focus on measuring the access dimension of food insecurity.
Ballard et al. (Citation2014) group household food insecurity measurement indicators into experience-based, coping strategies, and dietary diversity, differing in conceptual content and construction. The experience-based category contains four main indicators: the 18-item Household Food Security Survey Module (HFSSM) focusing on meeting basic needs; the Latin American and Caribbean Food Security Scale (ELCSA) assessing availability and coping behaviors, adapted into the global Food Insecurity Experience Scale (FIES); the 9-item Household Food Insecurity Access Scale (HFIAS) on lack of food access frequency; and the Household Hunger Scale (HHS) derived from HFIAS to compare severe hunger occurrences cross-context. These experience-based indicators use questionnaires reflecting a range of food insecurity severity, with variations in aspects like length, domain focus, and reference period, to generate comparable estimates of household food access.
The Food Insecurity Experience-based Scale (FIES) measures the severity of food insecurity (i.e., inability to access adequate food due to lack of money or other resources normally devoted to it) based on conditions and behaviors reported by responding to an 8-item questionnaire, the Food Insecurity Experience Scale Survey Module. FIES methodology produces vital innovations such as making food insecurity prevalence estimates in which validity and reliability can be assessed formally and can be compared across countries (Ballard et al., Citation2014). On whichever scale it is measured, it is known that food insecurity may increase the risk of malnutrition.
This paper aims to assess the prevalence of food insecurity in Ethiopia from 2014-2019 using the Food Insecurity Experience Scale (FIES) and explore the impact of socio-demographic risk factors on food insecurity in 2019. The research also reviewed related literature and consider interviews with key informants in Ethiopia. The key research questions addressed are: 1) What is the prevalence of food insecurity in Ethiopia from 2014-2019?; 2) What is the impact of key socio-demographic risk factors on food security in 2019?; and 3) What is the prevalence of malnutrition among children under five years of age and its associated factors?
The food insecurity analysis based on the FIES reveals that food insecurity has increased from 2014 to 2019. In particular, the prevalence of moderate and severe food insecurity in Ethiopia raises from 47.7% in 2014 to 52.1% in 2019. On the other hand, the prevalence of severe food insecurity raises from 12.0% in 2014 to 15.8% in 2019. The analysis of socio-demographic factors shows a higher probability of food insecurity for individuals aged 35-44 years and for people in the second lowest income quintile.
While existing studies analyze food insecurity and malnutrition in Ethiopia, analyses of national level trends using globally standardized tools like FIES are limited. Most research focuses on specific population groups, years, or regions. This study will apply FIES methodology to assess national food insecurity prevalence over time in Ethiopia. The analysis of demographic determinants and linkages to malnutrition will provide novel evidence to guide policy. Overall, this study will make a key contribution by evaluating the scale and drivers of food and nutrition insecurity at the national level in Ethiopia using globally comparable methods.
The rest of the paper is structured as follows: Section 2 presents the literature review, while Section 3 presents the data and methodology. Section 4 contains the empirical analysis, and Section 5 concludes the paper.
2. Literature review
The State of Food Security and Nutrition 2021 report reveals alarming global statistics - an estimated 2.37 billion people lacked adequate food access in 2020, an increase of 320 million versus 2019. Severe food insecurity affected 12% of the population, up 148 million. Gender disparities were evident, with 4% higher moderate/severe food insecurity among women. Child malnutrition also persists, with 22% stunted, 6.7% wasted, and 5.7% overweight globally in 2020 (WHO, Citation2020). A study in East Africa applying the HFIAS found 52% of sampled households were food secure. However, 26% were moderately and 7% were severely food insecure. Larger families, female-headed households, and less education significantly predicted food insecurity (Gezimua & others, 2021). Research in Iran using HFIAS determined larger households, unemployment, marriage, and less education associated with higher food insecurity likelihood (Tabrizi et al., Citation2018).
An analysis of UK data using the FIES revealed 6.6% of respondents reported moderate and 3% severe food insecurity. Younger, lower income, and renters disproportionately experienced food insecurity (Pool & Dooris, Citation2021). In Nigeria, household food insecurity prevalence was 61.8% measured with HFIAS. Higher rates occurred among younger, female-led, larger, and poorer households (Omuemu et al., Citation2012).
Recent literature examining localized determinants of household food security in Ethiopia find multi-faceted factors at play. (Gebissa & Geremew, Citation2022) determined larger family size, older household heads, and lack of off-farm income drive food insecurity, while education, livestock farming, and credit access promote security in Oromia. Similarly, (Mebrie & Ashagrie, Citation2023) identified links between poverty, limited employment, and constrained agricultural productivity as underlying hunger in Libokemkem. They propose human capital development, increased cereal production, and rural job opportunities as priority resiliency areas. Together, these two context-specific cases highlight complex interactions of demographic, socioeconomic, political and environmental elements across Ethiopia intersect to trap families in cycles of food shortage. The studies converge on recommendations to boost smallholder capabilities, diversify income, and spur equitable growth - aligning with our national-level findings. Targeted support to enable rural farmers and at-risk groups is imperative.
3. Data and methodology
To measure the 2019 severity of food insecurity in Ethiopia, we analyzed the data collected by Gallup World Poll (GWP). We also considered the GWP data from 2014 to 2018 for comparison and explanation. The Gallup World Poll (GWP), created in 2005, is a survey of individuals 15 years of age and older conducted annually in over 150 countries, areas, or territories. The GWP includes core questions applied in most countries worldwide and the FIES Survey Module (FIES-SM). The FIES Survey Module (FIES-SM) consists of eight questions regarding people’s access to adequate food ().
Table 1. FIES- survey module questions (FIES-SM).
Drawing upon the Gallup World Poll dataset, the methodological framework of the present study is partially inspired by the work of Pool and Dooris (Citation2021). Their research extensively investigates the prevalence of food insecurity within the UK, incorporating the Food Insecurity Experience Scale (FIES) approach as a benchmark for contrasting various food insecurity measurement techniques. Notably, their study delineates the influence of socio-demographic determinants on food insecurity via logistic regression analysis.
In the scope of our research, the evaluation of food insecurity prevalence adopts the FIES methodology, in alignment with the guidelines proposed by the United Nations Food and Agriculture Organization (UNFAO). The analytical strategy for interpreting FIES data is grounded in Item Response Theory (IRT). IRT is a specialized domain within statistics that facilitates the quantification of latent traits through a meticulous assessment of survey and test responses. Given that food security is, in essence, an intangible construct akin to attributes like attitude or intelligence, it necessitates measurement through its palpable manifestations.
Within the ambit of IRT, the FIES data is subjected to the Rasch model, as detailed by Cafiero et al. (Citation2018). Characteristically, the Rasch model is employed to scrutinize dichotomous data stemming from questionnaire responses (typified by binary answers such as “Yes” or “No”). The essence of this model lies in its capacity to gauge the equilibrium between (a) the proclivity, disposition, or innate traits of respondents, and (b) the inherent difficulty or stringency of the questionnaire items, as delineated in seminal works by Viviani (Citation2016) and Gustafsson (Citation1980).
The theoretical framework of the model posits that the likelihood of a respondent affirming a specific experience is contingent upon a logistic function delineating the disparity on the continuum between the intensity of the respondent’s circumstances and the stringency of the given item. Consequently, as the gravity of a respondent’s food insecurity escalates, so does the probability of a confirmative response. Intrinsically, the Rasch model predicates that both the respondent’s position and the item’s placement can be harmoniously mapped onto a singular unidimensional scale. This model theorizes that the logit (log-odds) of respondent ‘r’ affirming item ‘i’ linearly correlates with the variance between the acuteness of the food insecurity experienced by respondent ‘r’ and the rigor of item ‘i’. When quantifying the response, let X{r,i} represent the response of respondent ‘r’ to item ‘i’. This is encoded as 1 for an affirmative (“yes”) and 0 for a negative (“no”) reply.
(1)
(1)
where αr is the position of the respondent and βi that of the item on the same scale.
Within the ambit of the Rasch model, diagnostic statistics are proffered to critically assess the alignment of the data with the foundational postulates of the measurement paradigm, specifically: item discrimination equivalence, unidimensional representation, and conditional item independence. Should these assumptions be unanimously satisfied, the aggregate score (the cumulative tally of affirmative responses) can be aptly regarded as a comprehensive statistic, thereby rendering it a valid ordinal gauge of food insecurity. Conversely, the parameters quantifying respondents’ severity can be perceived as an interval metric for food insecurity. Consistent with the guidelines prescribed by the United Nations Food and Agriculture Organization (UNFAO), Rasch model estimations were meticulously computed utilizing the “Voices of the Hungry” R software (Viviani, Citation2016). Subsequently, an extensive Rasch analysis output was procured via a publicly accessible Excel template.
In a bid to derive globally congruent estimates of food insecurity prevalence, respondents are systematically categorized into delineated classes of food security (or its converse, insecurity), steered by canonical thresholds demarcating the severity scale. Pertinently, two globalized benchmarks are anchored to the severity attributed to two specific FIES indicators: ATELESS and WHLDAY, which typify the classifications of moderate and severe food insecurity, respectively. An equating protocol ensures the congruent transposition of these benchmarks onto national scales, post which respondents are probabilistically segmented into universally accepted food insecurity strata, contingent upon their aggregate scores. The subsequent prevalence of food insecurity within the populace is derived from the weighted aggregation of the score-specific probabilities. Herein, the weighted distributions of individual scores across the demographic serve as pivotal coefficients.
The ensuing phase of analysis deploys an econometric framework to discern the influence of socio-demographic determinants on food insecurity prevalence. This endeavor is orchestrated through a logistic regression model, where the dichotomized index of food insecurity is the dependent variable, juxtaposed against a suite of geographical and socio-demographic predictors—namely, age, educational background, rural-urban dichotomy, gender, and income—as the independent variables.
To complement the quantitative data, semi-structured interviews were conducted with key experts in food security and policy in Ethiopia. Two experts representing major institutions – one from the UN Food and Agriculture Organization (FAO) Ethiopia office and one from the local non-profit Homegrown Vision – were interviewed. The key informants have 10+ years of experience each in food security research, programming, and policy engagement in Ethiopia.
A questionnaire covering determinants, challenges, opportunities and policy gaps related to food and nutrition security was utilized to guide the interviews. Specific questions probed perspectives on drivers of food insecurity, regional disparities, gender dimensions, links with political context, and gaps in food policy. Detailed handwritten notes were taken during these remote video interviews lasting 30-45 minutes each. The interview data was analyzed using an inductive qualitative approach to identify prominent themes related to structural and systemic factors underlying food insecurity in Ethiopia.
4. Results
4.1. Results on FIES analysis and logistics regression
4.1.1. FIES results
provides the results obtained from the Rasch model output analysis. Adhering to the parameters set forth by Nord et al. (Citation2016), all values associated with lnfit, Outfit, and Rasch reliability statistics are deemed appropriate, indicating the high fidelity and quality of the data. The data garnered from the Rasch model analysis was subsequently inputted into a standardized Excel template, formulated by the United Nations Food and Agriculture Organization (FAO), for the purpose of estimating the prevalence of both moderate or severe and exclusively severe food insecurity within the population.
Table 2. Item severities, standard errors, infits and outfits from Rasch analysis.
displays the prevalence of food insecurity from 2014 to 2019. Data from 2019 suggests that 52.07% of the respondents experienced moderate or severe food insecurity, while 15.83% of the Ethiopian adult population faced severe food insecurity. In a comparative analysis with the findings of Pool and Dooris (Citation2021), which also utilizes the FIES methodology, it is observed that only 5.6% of the surveyed individuals reported moderate or severe food insecurity, and a mere 1.8% indicated severe food insecurity experiences. This pronounced disparity accentuates the significant variance in food insecurity prevalence between Ethiopia and the study by Pool and Dooris. This contrast potentially underscores the inherent discrepancies in food insecurity rates between developed and developing nations, as exemplified by the UK and Ethiopia in this context. Furthermore, the significantly higher rates of food insecurity in Ethiopia compared to Pool & Dooris’ UK study aligns with research showing higher rates of food insecurity in low-income nations versus more developed countries (FAO et al., Citation2017).
Table 3. The food insecurity prevalence rate, 2014–2019.
In the current research, when assessing the prevalence of food insecurity for the year 2019 and contrasting it with data from the preceding quintet of years (2014-2018), all of which utilize the FIES methodology, a discernible escalation in severe food insecurity within the Ethiopian demographic was identified. Interestingly, the data from 2016 indicated heightened levels for both categories—moderate or severe and solely severe food insecurity—compared to 2019. On the contrary, 2015 registered the minimal prevalence for both these categories. As presented in , the trajectory of food insecurity in Ethiopia demonstrates a cyclical pattern. Several determinants, including desert locust invasions, sociopolitical unrest, climatic-induced displacements, inflationary trends in food prices, extended drought periods in the northeastern pastoral zones, and a dependency on rain-dependent agriculture, contribute to this challenge. The analysis indicates that, over the examined duration, the growth rate of severe food insecurity substantially exceeded the incremental trend in the broader category of moderate or severe food insecurity.
4.1.2. Descriptive analysis
This section delineates the descriptive statistics corresponding to the primary determinants, notably Age and Income, which are postulated to influence the degree of food insecurity within a given economic framework. The food security status is elaborated upon in and and . Analyzing the age cohorts and the associated participant numbers over the sampled years, it becomes evident that younger age demographics consistently exhibit higher vulnerability to food insecurity relative to their older counterparts. Concurrent with established academic literature (Omuemu et al., Citation2012; Pool & Dooris, Citation2021), the income quintile termed “poorest_20%” persistently manifested the highest incidence of food insecurity from 2014 to 2019. In stark contrast, the “fifth_20%” quintile consistently recorded the most minimal prevalence. Focusing on the 2019 data, individuals within the 35–44 age range reported the most acute food insecurity levels, with 86% identifying as food insecure.
Figure 1. A descriptive analysis of food security by age and income; Contingency table, 2019.
(a) A descriptive analysis of food security by (b) A descriptive analysis of food security by age, 2019 income, 2019.
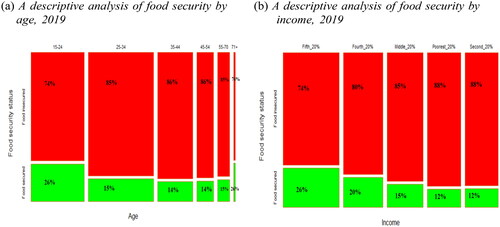
Table 4. Descriptive analysis of food insecurity by age (%), 2014–2019.
Table 5. Descriptive analysis of food insecurity by income (%), 2014–2019.
This contrasts with the 74% in the age group of 71 years and above and those within the 15-24 age bracket. underscores that the lower income echelons (specifically the 1st quintile) consistently indicate heightened food insecurity across the surveyed years, a pattern consistent with scholarly findings, as corroborated by studies such as that of Pool and Dooris (Citation2021).
4.1.3. Logistics regression results
Utilizing a logistic regression model in R studio, this study sought to investigate the influence of five demographic determinants (namely, Age, Education, Rurality, Gender, and Income) on manifestations of food insecurity experiences. In alignment with the methodology adopted by Pool and Dooris (Citation2021), food insecurity was conceptualized as a dichotomous variable, classifying respondents into ‘food secure’ and ‘food insecure’ categories. The scope of this analysis was confined to the data from 2019. The classification of food insecurity was contingent upon affirmative responses to any of the eight constituent questions of the FIES. The motivation for this inquiry into even minimal manifestations of food insecurity stems from a policy-oriented perspective, emphasizing the imperative to discern the determinants concomitant with varying degrees of food insecurity, thereby fostering a comprehensive strategy to enhance food security universally.
Of the predictor variables analyzed, age, rurality, and income were statistically significant (P ≤ 0.10), as detailed in . In the 2019 dataset, the age bracket of 35 to 44 years exhibited a pronounced Odds Ratio (OR) of 5.21, with a 95% confidence interval (CI) spanning from 2.82 to 9.98, underscoring its robustness as a predictor of food insecurity. This observation harmonizes with the descriptive findings articulated in . Specifically, the 35–44 age cohort consistently registered the highest levels of food insecurity, with 86% signaling food insecurity, in contrast to the 74% observed in the demographic aged above 71 years and the 15–24 age segment. The marginal effects associated with this determinant suggest a 16% escalation in the likelihood of experiencing food insecurity for each unitary increment in the variable.
Table 6. Logistics regression analysis of the food insecurity experience by socio-demographic variables, 2019.
Correspondingly, within the income group, the “second_20%” segment manifested the most prominent association with food insecurity, evidenced by an Odds Ratio (OR) of 2.29 and a 95% confidence interval (CI) ranging from 1.55 to 3.44. This outcome aligns coherently with the descriptive statistics illustrated in . Over the years under consideration, the lower-income strata, especially the 2nd quintile, consistently demonstrated heightened levels of food insecurity, corroborating findings in academic literature, such as those presented by Pool and Dooris (Citation2021). Additionally, the marginal effect analysis related to the income bracket “second_20%” reveals that a one-unit increase in income increases the likelihood of experiencing food insecurity by 9%. The identification of a higher likelihood of food insecurity among lower-income groups is consistent with previous studies by Omuemu et al. (Citation2012) and (Pool & Dooris, Citation2021), which observed elevated rates of food insecurity in economically disadvantaged households. However, contrary to the findings of Gezimua and others (2021), who identified larger households as more susceptible to food insecurity, our national-level analysis did not identify household size as a significant risk factor.
In general, the marginal effects for education & urban/suburbs suggest that a unit change on them would reduce the probability of being food insecured. While for age, gender and income, a unit change would increase the probability of being food insecured.
4.2. Key informants and stakeholders analysis
This paper examines expert perspectives on food security in Ethiopia through interviews with key informants. The interviews focused on understanding the current coverage, challenges, prospects and opportunities related to food security in the country. The experts interviewed represent two organizations - FAO-Ethiopia and the NGO Homegrown Vision based in Addis Ababa. The specific questions raised are as follows and succeeded by a condensed synthesis of the interview outcomes.
What do you think is the driver of food insecurity and malnutrition in Ethiopia?
Which region has a high rate of food insecurity and malnutrition? What is the reason behind it?
Do you think gender discrimination impacts food insecurity and malnutrition in Ethiopia? How?
Is there a link between the political context and food insecurity? If yes, what is that?
Do you think there is a gap in food policy preparation and interventions?
The determinants of food insecurity in Ethiopia are multifaceted, stemming from issues in the agricultural sector, environmental shocks, poverty, political instability, and gender inequality. Agriculture in Ethiopia is dominated by smallholder systems with challenges in mechanization, land, inputs, and post-harvest handling, limiting productivity. Environmental shocks like drought, floods, and locust infestations exacerbate food shortages. Poverty and inflation reduce food affordability. Political conflicts and ethnic violence also disrupt livelihoods and food security.
Regions with more rainfall and fewer droughts tend to have better food security outcomes. But recurrent challenges in regions like Tigray, Afar, and Somali leave many smallholder households vulnerable. Women bear a disproportionate burden during food shortages, compromising their own intake and engaging in risky activities to secure food.
Historically, the ruling party in Ethiopia imposed top-down agricultural policies that politically controlled farmers. The push for large factories over smallholder support deepened hunger. Disconnection between policy and reality has led to focus on limited cereal crops over nutritious traditional crops like enset.
Overall, complex interactions of agricultural productivity, climate shocks, poverty, gender equity, and political control over farmers underpin the determinants of food insecurity in Ethiopia. A more holistic, context-specific approach is needed to strengthen the resilience of smallholder livelihoods and the food system. Regional variations, women’s empowerment, traditional crops and political reforms should be considered in designing integrated solutions.
5. Conclusion and recommendations
Utilizing a mixed methods approach encompassing quantitative and qualitative techniques, this study investigated the prevalence and determinants of food insecurity and malnutrition among children in Ethiopia.
The quantitative findings revealed alarming rates of moderate to severe food insecurity afflicting over half the population in recent years, with socioeconomic factors like income, age and rural residency constituting key predictors.
While quantitative techniques identified vulnerable groups and associations, qualitative data provided crucial context on structural drivers including agricultural underperformance, environmental shocks, poverty, and political marginalization of smallholder farmers. Additionally, women and girls experienced disproportionate impacts of food scarcity. Geospatial heterogeneity was evident, with higher food security in regions with lower drought risk. The study also highlighted disconnects between policy and implementation, plus inadequate prioritization of nutritious traditional crops.
In summary, this mixed methods investigation revealed complex interactions between socioeconomic, political, environmental and spatial factors in perpetuating food insecurity and malnutrition in Ethiopia. While the quantitative component identified vulnerable groups, the qualitative dimension explicated structural determinants necessary to inform context-specific and sustainable policy solutions. An integrated approach encompassing gender perspectives, traditional crops and smallholder empowerment is imperative.
Based on our analysis and conclusions, we recommend the following steps to enhance Ethiopia’s food security. It requires a multi-pronged approach focused on supporting smallholder farmers, strengthening policy, and empowering women. To start, agricultural training and assistance for smallholder farmers could significantly improve productivity and household food security. Programs tailored to local contexts and needs would enable farmers to implement more resilient and nutritious cropping strategies.
Concurrently, a revamped policy process should encourage collaboration across sectors and enhance links between research and implementation. Policies should create an enabling environment and build adequate capacity for roll-out. Special policy attention could be granted to the most vulnerable regions and socioeconomic segments, like pastoralist communities and low-income youth. Research and policies for traditional nutritious crops ought to be prioritized as well. Furthermore, women’s education, financial security and involvement in agriculture, food security dialogues and programming should be amplified. This not only bolsters household food security but also improves child nutrition.
In summary, a three-pronged approach of smallholder support, multi-sectoral policy reforms, and women’s empowerment is imperative. Focusing on these areas can promote a more secure and nutritious future for Ethiopia. Sustained efforts that take local nuances into account will be key to creating systemic change.
Compliance with ethical standards
Oral informed consent was obtained from each interviewed expert prior to conducting the remote video interview.
Disclosure statement
No potential conflict of interest was reported by the author(s).
Additional information
Notes on contributors

Henok Fasil Telila
Henok Fasil Telila’s work is noteworthy for its depth and breadth in addressing critical macro-financial and socio-economic challenges through innovative research methodologies, including machine learning. His analytical skill spans across various domains such as economic policy, financial markets, and econometrics, reflecting his valued roles in prestigious international institutions like the World Bank and UNDP. His recent studies, notably on the quantification of food insecurity in Ethiopia, support wider efforts toward sustainable development and poverty reduction, showcasing his commitment to using detailed analysis for meaningful policy impact and promoting economic growth globally.
Elsa Abebe Sima
Elsa Abebe Sima has emerged as a proficient professional, navigating the complex terrains of health and human development. Her academic journey mirrors her deep-rooted interest in nutritional challenges, developmental strategies and evaluation of developmental projects. With a solid background at UNIFAD, Elsa has demonstrated an unwavering commitment to tackling developmental challenges. Elsa’s research endeavors, particularly in nutrition and food security, showcase her dedication to addressing developmental hurdles and her alignment with global sustainable development objectives.
References
- Ballard, T. J., Kepple, A. W., Cafiero, C., & Schmidhuber, J. (2014). Better measurement of food insecurity in the context of enhancing nutrition. Ernahrungs Umsch, 61, 1–10.
- Cafiero, C., Viviani, S., & Nord, M. (2018). Food security measurement in a global context: The food insecurity experience scale. Measurement, 116, 146-152.
- FAO, IFAD, WW, UNICEF, others. (2017). The state of food security and nutrition in the world. Food and Agriculture Organization of the United Nations.
- FAO. (2001). The state of food and agriculture 2001. Food & Agriculture Org.
- Gebissa, B., & Geremew, W. (2022). Determinants of food insecurity and the choice of livelihood strategies: The case of Abay Chomen District, Oromia Regional State, Ethiopia. TheScientificWorldJournal, 2022, 1316409–1316415. https://doi.org/10.1155/2022/1316409
- Gezimua, G., others. (2021). Prevalence of household food insecurity in East Africa: Linking food access with climate vulnerability. Climate Risk Management, 33, 100333.
- Gustafsson, J.‐E. (1980). Testing and obtaining fit of data to the Rasch model. British Journal of Mathematical and Statistical Psychology, 33(2), 205-233.
- HLPE (2020). Agroecological and other innovative approaches for sustainable agriculture and food systems that enhance food security and nutrition. A report by the High Level Panel of Experts on Food Security and Nutrition of the Committee on World Food Security.
- Mebrie, T., & Ashagrie, E. (2023). Rural household food security status and its determinants in Libokemkem woreda of the Amhara region, North Western Ethiopia. Journal of Poverty and Social Justice, 31(1), 1–24. https://doi.org/10.1332/175982721x16760300561102
- Nord, M., Cafiero, C., & Viviani, S. (2016). Methods for estimating comparable prevalence rates of food insecurity experienced by adults in 147 countries and areas. Journal of Physics: Conference Series, 772, 012060. https://doi.org/10.1088/1742-6596/772/1/012060
- Omuemu, V. O., Otasowie, E. M., & Onyiriuka, U., others. (2012). Prevalence of food insecurity in Egor local government area of Edo State, Nigeria. Annals of African Medicine, 11(3), 139–145. https://doi.org/10.4103/1596-3519.96862
- Pool, U., & Dooris, M. (2021). Prevalence of food security in the UK measured by the food insecurity experience scale. Journal of Public Health (Oxford, England), 44(3), 634–641.
- Sisha, T. A. (2020). Household level food insecurity assessment: Evidence from panel data, Ethiopia. Scientific African, 7, e00262. https://doi.org/10.1016/j.sciaf.2019.e00262
- Tabrizi, J. S., Nikniaz, L., Sadeghi-Bazargani, H., Farahbakhsh, M., & Nikniaz, Z. (2018). Socio-demographic determinants of household food insecurity among Iranian: a population-based study from northwest of Iran. Iranian Journal of Public Health, 47, 893–900.
- Viviani, S. (2016). Manual for the implementation of the FAO voices of the hungry methods to estimate food insecurity: RM. weights package in R. FAO.
- WHO. (2020). The state of food security and nutrition in the world 2020: transforming food systems for affordable healthy diets. Food & Agriculture Org.