
Abstract
Sharing economy has emerged as an influential concept, shaping the way and manner businesses are transacted. Of particular interest is the transport industry, where a combination of GPS and the development of software have resulted in the creation of an e-hailing transportation system. Issues such as the provision of quality services persist; giving rise to further investigations. The study, therefore, delved into service quality, satisfaction and loyalty of users of e-hailing transport services. Using a cross-sectional descriptive survey, a convenience sample was employed to intercept 436 users of e-hailing vehicles at pick-up and drop-off points in Accra, Ghana. A structural equation model was used to test the relationships between service quality, satisfaction and loyalty among users of e-hailing vehicles. Results show assurance (β = 0.149; p = .022); tangibles (β = 0.140; p = .045), responsiveness (β = 0.040; p = .008); reliability (β = 0.014; p = .015); empathy (β = 0.062; p = .000); system information (β = 0.013; p = .005) and price (β = 0.001; p = .008) significantly influence user satisfaction. Similarly, customer satisfaction was found to influence the loyalty of users of e-hailing vehicles. The study concludes that both individual service quality dimensions and the composite service quality model influence users’ satisfaction which in turn influences users’ willingness to re-use and recommend e-hailing services to others. Implications for theory and practice are discussed.
Reviewing Editor:
Subjects:
Introduction
In recent years, sharing economy has emerged as an influential concept (Bremser & Alonso-Almeida, Citation2017), shaping the way and manner businesses are transacted. Of particular interest is the transport industry, where a combination of the Global Position System (GPS) and the development of software have resulted in the creation of e-hailing transportation system (Azudin et al., Citation2018). This has further been enhanced by the advancement and increasing ownership of handheld devices including smart phones and tablets (Phuong & Trang, Citation2018), making it easier for people to access online sharing economy transport services. From its inception, sharing economy was conceptualised as giving access to people to make use of unused or underused assets with the aim of making financial gains (Botsman & Rogers, Citation2011; PwC, Citation2015; Schor, Citation2014).
However, recent conceptualisation of the concept has moved from just accessing unused or underutilised assets to the application of business models such as business-to-person and peer-to-peer to mobility such as ridesharing, car sharing or bike sharing (Bremser & Alonso-Almeida, Citation2017). Sharing economy is defined by Dalberg (Citation2016, p. 2) as ‘sharing assets – physical, financial and/or human capital, between many without transferring ownership, via a digital platform to create value for at least two parties’. This has enabled people to travel or commute more cheaply than using the traditional forms of transport (Barnes & Mattsson, Citation2016) leading to a reform in the traditional consumption patterns of transport services (Olmstead & Smith, Citation2016).
Sharing economy businesses provide numerous benefits to all stakeholders in the sharing economy value chain. For instance, PwC (Citation2015) observed that sharing economy ‘allows individuals and groups to make money from underused assets by sharing physical assets as services’ (p. 5); thereby giving opportunities for riders to supplement their income (Azudin et al., Citation2018). It has also been found that e-hailing transport services have the potential of bringing to the barest minimum, the incidence of drunk driving accidents and fatalities (Dills & Mulholland, Citation2018; Greenwood & Wattal, Citation2017; Lim, Citation2016; Peck, Citation2017). Due to this, countries such as Malaysia have taken keen interest in supporting sharing economy transport companies (Sammy, Citation2016). Aside this, research on sharing economy has increased in recent years. Majority of these studies (Chen & Sheldon, Citation2015; Greenwood & Wattal, Citation2017; Hall et al., Citation2018; Stalmašeková et al., Citation2017) have delved into the service quality-satisfaction nexus of sharing economy companies/vehicles.
However, Azudin et al. (Citation2018) intimated that several issues such as the provision of quality services by e-hailing vehicles still persist. Further to this, Bismo et al. (Citation2018) opined that e-hailing transport services should pay critical attention to service quality issues; giving rise for further investigation into service quality and customer satisfaction of e-hailing transportation services.
Theoretically, studies on e-hailing service quality have used the SERVQUAL model (Parasuraman et al., Citation1985), to the neglect of using other models in measuring service quality of e-hailing transport services. Another observation from the literature relates to the fact that little conceptual and empirical studies have been done on e-hailing transport service quality, satisfaction and loyalty in Africa in general and in Ghana, specifically. Much of the focus has been on safety and security, impacts of ride-sharing/hailing services on traditional taxi services, profiling of users of e-hailing transport services and lived experiences of ‘disabled’ users of Uber (see Acheampong, Citation2020; Acheampong & Siiba, Citation2019; Acheampong et al., Citation2020; Agyeman et al., Citation2019; Agyemang, Citation2020; Odame et al., Citation2023).
However, e-hailing transport services have been in operation in Ghana for six years now. Uber and Bolt (formerly Taxify) entered the Ghanaian market on 11 June 2016 and 23 December 2017, respectively. Both companies operate e-hailing transport services in the capital city of Accra and Kumasi, the second largest city after Accra. Other e-hailing transport services such as Yango and Lyft also provide services in Accra.
In view of the forgoing, the current study is set out to investigate service quality, satisfaction and loyalty among users of sharing economy vehicles in Ghana. The study is significant in a number of ways. First, insights from the study will serve as a baseline for further investigations into the services of these sharing economy companies. Furthermore, findings from the study will provide valuable insights into the dimensions of service quality that are important to users, thereby providing management of these companies the opportunity to provide services that will meet the needs of their customers. Finally, the findings can aid policy makers, particularly within the transport sector in developing strategic policies regarding the operations of sharing economy businesses.
The remaining section of the paper is structured as follows: a literature review on service quality, satisfaction and the relationship between these two concepts. Literature on customer loyalty and influence of satisfaction on loyalty was reviewed. This is followed by details on materials and methods, results and discussions on the key findings. Conclusion and implications of the study is presented in the last section.
Sharing economy vehicle service quality
Service quality has received considerable attention in both traditional and sharing economy transport literature (see Bismo et al., Citation2018; Mensah & Ankamah, Citation2018; Nutsugbodo, Citation2013; Pasharibu et al., Citation2018; Phuong & Trang, Citation2018; Sharma & Das, Citation2017; Suhaimi et al., Citation2018). Service quality is an expression of customers’ overall perception of the service provided (Culiberg, Citation2010; DeMoranville & Bienstock, Citation2003). It can also be conceptualised as the difference between expected service and experienced service. If the services provided falls below the expectations of consumers, they will be dissatisfied. However, if the services provided are the same as expected or exceeds expectation, consumer will be satisfied or delighted respectively (Parasuraman et al., Citation1985). For this reason, service providers aim at either meeting or exceeding the expectations of customers.
A plethora of dimensions have been used in assessing service quality. One of such dimensions is the one proposed by Parasuraman et al. (Citation1985); which has become one of the most influential measurements for evaluating service quality. According to Parasuraman et al. (Citation1985), service quality is evaluated with the following dimensions: tangibles, reliability, responsiveness, assurance and empathy. From the perspective of Fitzsimmons and Fitzsimmons (Citation2011), customers’ evaluation of the quality of services provided will be based on availability, convenience, dependability, personalisation, price, quality, reputation, safety and speed. Other dimensions such as website design, information quality and interface interactivity have been found to be critical to the evaluation of service quality (Hahn et al., Citation2017; Ku & Chen, Citation2015; Xu et al., Citation2013). Notwithstanding, Silvestro (Citation2005) observed that, the best criteria for assessing service quality are the ones defined by the customer. In essence, these dimensions only serve as a guide, whilst the customer defines what constitute service quality based on their expectations and experiences.
A study by Sharma and Das (Citation2017) on service quality of online cab in India found tangibles, responsiveness and empathy as the three most important dimensions in relation to service quality ratings of online cabs by consumers. Specifically, the study revealed that physical facilities, equipment, personnel, printed and visual materials play a critical role in customers’ assessment of service quality when travelling or commuting with online cabs. The study further identified cabs driver’s willingness to help customers, provide prompt service as well as their physical appearance as issues that need to be addressed by management of online cab services. Suhaimi et al. (Citation2018) assessed service attributes of sharing economy vehicles that contribute to customers’ assessment of service quality. They found that safety, price, convenience and the use of the internet as customers’ perception of service quality. Pasharibu et al. (Citation2018) observed that issues such paying attention to cleanliness and tidiness of sharing economy vehicles, provision of responsive services as well as improvement of driver capabilities were important dimensions of service quality that sharing economy vehicle owners should pay attention to. Theses, according to them, go a long way in ensuring customers’ comfort and maintain customers’ trust in the service providers.
Customer satisfaction with sharing economy vehicles
Satisfaction relates to instant assessment of service after consumption (Culiberg, Citation2010) and has been studied in almost every sector of the hospitality and tourism industry (Adam et al., Citation2017; Amissah, Citation2013; van Lierop et al., Citation2018). According to Oliver (Citation1997), satisfaction is the completion and fulfilment of needs. In essence, customers compare their expectations prior to patronising the service with their experience in determining their satisfaction (Morfoulaki et al., Citation2010). Satisfaction is very critical as it gives service providers an understanding as to whether the needs and wants of customers are fulfilled or otherwise (Phuong & Trang, Citation2018).
Empirical research has revealed that users of sharing economy vehicles are mostly satisfied with the convenience, price, app, opportunity of knowing the driver ahead of time and the ability to know how much the trip will cost them to utilising the service (Chen & Sheldon, Citation2015; Greenwood & Wattal, Citation2017; Hall et al., Citation2018; Stalmašeková et al., Citation2017). For instance, Uber services have been found to charge about 20–30% lower than what traditional taxis charge. This has been seen as a disincentive to operators of traditional or regular taxis and even buses. In Malaysia, this created a brawl between sharing economy vehicles (Uber and GrabCar) when people switched from using traditional taxis to sharing economy vehicles due to their relatively cheaper prices (Kaur et al., Citation2016; Lee, Citation2016).
Azmi et al. (Citation2019) reported that user satisfaction from using sharing economy vehicles emanates from users’ ability to use several modes of payments either before or after the trip. Specifically, users’ can make payment by using their credit cards or through direct transfer from bank accounts. The implication is that, the user can avoid making cash payments, hence, ease and safety of payment (Hughes & MacKenzie, Citation2016). Additionally, reduction in waiting time when using sharing economy vehicles has been found to influence users’ satisfaction (Caranza et al., Citation2016; Hughes & MacKenzie, Citation2016; Rayle et al., Citation2016). Compared to traditional taxis and other forms of transport; sharing economy vehicles offer flexible itinerary as the customer has the flexibility of deciding when to use the vehicle. This is different from taxis, buses and trains which have fixed itinerary (Azmi et al., Citation2019)
Service quality and customer satisfaction nexus
The relationship between service quality and customer satisfaction has been widely discussed in the literature. The literate on service quality and customer service posit three types of relationship between these two constructs. Whilst service quality has been described as an antecedent to customer satisfaction, some others propose that either customer service causes service quality or none of the concepts is antecedent to the other (Bitner, Citation1990; Brady et al., Citation2002; Dabholkar et al., Citation2000; Naik et al., Citation2010).
A number of studies have found that service quality influences customer satisfaction (Bismo et al., Citation2018; Pasharibu et al., Citation2018; Soleh et al., Citation2018; Susilo et al., Citation2018). Empirically, Bismo et al. (Citation2018) found that all the five attributes of the SERVQUAL model positively affect customer satisfaction for using Grabcar services in Jakarta, Indonesia. Other studies (Chao & Kao, Citation2009; Deneke et al., Citation2016; Yao & Ding, Citation2011) allude to the influence of all the dimensions of service quality on customer satisfaction. Further to this, Hamenda (Citation2018) found that all attributes of service quality significantly influence the satisfaction derived by users of ride-sharing services in Indonesia. A study by Horsu and Yeboah (Citation2015) among taxi cab users in Cape Coast, Ghana found that service quality attributes used in the study – continuous service, reasonable price, comfort, constituency and driver’s conduct – positively influences the satisfaction derived by users.
Moreover, specific service quality attributes have also been found to influence customer satisfaction. In a study to examine the influence of service quality attributes on satisfaction of online cab users in India, Sharma and Das (Citation2017) observed that empathy, responsiveness and tangible significantly influence customer satisfaction. Balachandran and Hamzah (Citation2017) as well as Alemi et al. (Citation2018) also found attributes related to empathy and tangibles as having significant influence on the satisfaction of ride sharing users in Malaysia and Uber users in California respectively. Whilst the former identified drivers’ attitude, the later indicated that Uber cabs comfort contributed to users’ satisfaction. Inbalakshmi and Krishnamoorthy (Citation2015) as well Horsu and Yeboah (Citation2015) confirmed the relationship between service quality and customer satisfaction, though not all the SERVQUAL dimensions were found to influence customer satisfaction. Tangibles, reliability and assurance were found to be antecedent of customer satisfaction.
In an earlier study, Noor et al. (Citation2014) intimated that service quality attributes of tangibility, reliability, responsiveness and assurance were responsible for the satisfaction of users of express bus services in Malaysia. Reliability, assurance and tangibility were found to be significant factors influencing customer satisfaction (Morton et al., Citation2016). Whilst Man et al. (Citation2019) observed that tangibles, empathy and reliability had significant relationship with satisfaction of ride-hailing service users in Kuala Lumpur, Malaysia, Ziyad et al. (Citation2020) study on users Uber and Careem in Pakistan found assurance, empathy and responsiveness as attributes of service quality that contributes to customer satisfaction. Further to this, Mensah and Ankamah (Citation2018) opined that service quality has a significant influence on customer satisfaction. Specifically, their study on taxi service quality and customer satisfaction among commuters in Accra found that, service quality attributes of assurance, reliability and tangibles contribute significantly to satisfaction derived from by taxi users in the Accra Metropolis, Ghana. In terms of other shared mobility services in Ghana, Ojo et al. (Citation2014) revealed that service quality of public transport on Cape-Coast route influences satisfaction of customers who patronised these public transports. Accordingly, they concluded that whilst empathy, responsiveness and assurance have a direct positive influence, tangibles and reliability had a negative influence on customer satisfaction. In another study, Birago et al. (Citation2017) found that passengers using the Metro Mass Transit in Accra bemoaned that over-crowding, delays, poor/unavailability of seats and long waiting times as the source of poor service delivery, hence, their non-preference or dissatisfaction for using Metro Mass Transit buses in Accra.
The forgoing indicates that a bundle of service quality attributes can combine to create the necessary satisfaction derived by customers. Despite this trend, some studies (Jun, Citation2012; Murad et al., Citation2019) have found single attributes of service quality contributing to customer satisfaction. For instance, Jun (Citation2012) identified tangibility as the only service quality attribute that influences customer satisfaction. In their study of Uber and Careem users in Jordan, Murad et al. (Citation2019) found reliability as the most influencing service quality dimension in terms of satisfaction derived from using Uber and Careem services. In a recent study, Kumar et al. (Citation2022) confirmed the finding of Murad et al. (Citation2019) that reliability significantly influences customer satisfaction. Kumar et al. (Citation2022) further indicated that specific reliability items such as availability of ride-hailing services, picking of passengers at the right location and timely arrival ride-hailing cabs. Based on the following, it is expected that specific service quality attributes or dimensions will influence customer satisfaction. The study therefore proposes the following:
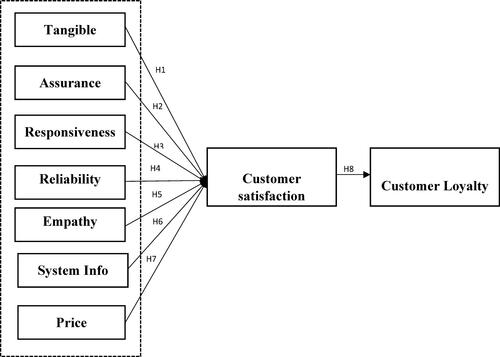
Hypothesis 1 (H1): Tangibles positively and significantly influences customer satisfaction
Hypothesis 2 (H2): Assurance positively and significantly influences customer satisfaction
Hypothesis 3 (H3): Reliability positively and significantly influences customer satisfaction
Hypothesis 4 (H4): System and Information Quality positively and significantly influences customer satisfaction
Hypothesis 5 (H5): Empathy positively and significantly influences customer satisfaction
Hypothesis 6 (H6): Responsiveness positively and significantly influences customer satisfaction
Customer loyalty
Customer loyalty has been studied extensively, especially, in the service industry and has been viewed as a resultant of customer satisfaction (Khuong & Dai, Citation2016). The concept has been defined from many perspectives. Oliver (Citation1997) conceptualise customer loyalty as ‘a deeply held guarantee to re-buy or re-patronise a favoured product or service consistently in the future, despite issue influences and marketing efficiency having the potential to cause changing behaviours’. In essence, loyalty connotes the intention of a customer to reuse or purchase a service/product in the future to the actual use or purchase (Hume et al., Citation2007). Authors such as Gede and Sumaedi (Citation2013) believe that customers willingness to repurchase a product or service emanates from the customers’ psychological bond built during the initial purchase. Such customers mostly exhibit favourable attitudes for the products or services, hence, the decision to make purchase the product or service again. Literature posits that customer loyalty has two main dimensions, that is, attitudinal and behavioural loyalty (Phuong & Trang, Citation2018). Whilst attitudinal loyalty is concern with customers’ willingness to recommend or engage in positive word-of-mouth promotion of the service or product, behavioural loyalty deals with the customer making regularly purchases after the initial purchase (Gronholdt et al., Citation2000; Khuong & Dai, Citation2016; Phuong & Trang, Citation2018).
Influence of satisfaction on customer loyalty
The relationship between customer satisfaction and customer loyalty has received considerable attention in the literature (see Huang et al., Citation2019; Khuong & Dai, Citation2016; Kuswanto et al., Citation2019; Slack et al., Citation2022). In fact, a customer becoming loyal to a service or product is preceded by the level of satisfaction such customer derives from using the said service or product. In essence, the antecedent of customer loyalty is customer satisfaction (Khuong & Dai, Citation2016). The conclusion is that customer satisfaction drives customer loyalty (Casidy & Wymer, Citation2015; Srivastava & Kaul, Citation2016) both in terms of attitude and behaviour (Schijns et al., Citation2016).
A study by Slack et al. (Citation2022) which examined the influence of customer satisfaction on customer loyalty and disloyalty dimensions revealed that customer satisfaction has a direct and positive influence on the repurchase intention of customers and customer positive word-of-mouth. By extension, when the customer is satisfied, the customer becomes repeat customer and also speaks well of the services or products to other, hence, becoming a loyal customer. Kuswanto et al. (Citation2019) investigations into the influence of online and offline services of ride-sharing motorbikes in Indonesia found that satisfaction has a significant relationship with customer loyalty. The more customers were satisfied with the services provided by ride-sharing motorbikes, the more customers were inclined to be loyal by recommending the services to others. In an earlier study, Huang et al. (Citation2019) concluded that satisfaction derived from local taxi services in Vietnam significantly influences customer loyalty as well as the two sub-dimensions of loyalty – attitudinal and behavioural. In view of this, the study proposes that:
Hypothesis 7 (H7): Customer satisfaction positively and significantly influences customer loyalty.
Figure 1. Conceptual model and hypotheses.
Theoretical underpinning
The service performance (SERVPERF) model developed by Cronin and Taylor (Citation1992, Citation1994) was adapted for the study. The model evaluates quality service by assessing the actual service instead of comparing expectation and experiences of customers. Accordingly, customers mostly evaluate the quality of service by examining the performance of the services they receive. Since the study measured service quality from the performance of sharing economy vehicles, the SERVPERF model was deemed appropriate. However, since the current study was on the sharing economy (online) transport services, two additional dimensions, system and information quality and price were introduced to the existing measures of the SERVPERF model, that is, tangibles, assurance, responsiveness, reliability and empathy. This was done in order to capture keys issues on the online component of the sharing economy vehicles and pricing of sharing economy vehicles.
Materials and methods
Study setting
The study was set out to investigate service quality, satisfaction and loyalty among users of sharing economy vehicles in Ghana. Specifically, the study sought to influence of service quality attributes (tangibles, assurance, responsiveness, reliability, empathy, system information quality and price) on customer satisfaction as well as determine the relationship between customer satisfaction and loyalty among users of sharing economy vehicles in Ghana.
The study was conducted Accra, Ghana. Accra is both the capital city of Greater Accra Region and Ghana. The city is the most densely populated and commercial city in Ghana. Due to increasing population, the city is faces massive vehicular traffic, especially during the peak hours of the day. It is estimated that about 70% of the city’s inhabitants rely on informal minibuses (often called ‘trotro’) and taxis on a daily basis. In terms of long haul journeys, residents of the city utilise the private-owned buses and the government-private owned Metro Mass Transit (MMT)and State Transport Corporation (STC) buses. Whilst trotros and taxis can be patronised almost everywhere in the city, transport companies operating buses are mostly found in the city’s largest bus terminal at ‘Kwame Nkrumah Circle’, popularly known as ‘Circle’. The MMT, in addition to the bus terminal at ‘Circle’, has three other terminals at Achimota, Madina and Keneshi, all in Accra.
However, the advent of e-hailing transport services has shifted attention from the use of trotros and taxis for daily commutation among residents of Accra. This trend could possibly be blamed on the poor turn around transport system in the city (Amoako et al., Citation2021). Studies indicate patrons of e-hailing services are mostly young males with at least a tertiary education (eg Acheampong, Citation2021). Accra has a composite of all the e-hailing transport services operating in the country. In fact, the first two e-hailing transport services that entered the country started their operations in Accra before commencing business in other cities such as Kumasi, Takoradi and recently, Sunyani. After the initial entry of Uber and Bolt (formerly Taxify) in Accra in 11 June 2016 and 23 December 2017 respectively; other e-hailing transport services (eg Yango, Accra Cab, Yenko, Fameko, Enshika, First Class and Uru) later joined the e-hailing transport market in Accra, though some could not survive. Currently, Uber, Bolt and Yango are considered as the ‘big three’ e-hailing transport services in Ghana (Pasquali et al., Citation2022). Accra is the only city in Ghana having all three in operations. This makes Accra the preferred choice for the study.
Sampling procedure and participants
Due to the absence a sampling frame, the study adopted a convenience sampling method (Reynolds et al., Citation2003). The adoption of the convenience sampling affirms of the use of this sampling method in similar studies (see Birago et al., Citation2017; Horsu & Yeboah, Citation2015; Mensah & Ankamah, Citation2018). Specifically, a public intercept survey was used (see Slack et al., Citation2022). Respondents were intercepted at the premises of the University of Ghana, Accra Mall, West Hills Mall, Ministries and Ghana Institute of Management and Public Administration. Anecdotal evidence suggests that these facilities served a ‘dual purpose’ of being both a pick-up and drop-off points for users of e-hailing vehicles. In essence, users of e-hailing transport services served as the participants of the study. Out of 750 users of e-hailing transport service users intercepted, 436 agreed and participated in the study, representing 58.1% response rate. The consent of respondents was sought before the questionnaires were administered on them. Again, respondents were assured of anonymity and confidentiality.
Questionnaire design
The study questionnaire consisted of four (4) sections. The first session focused on eliciting information on participants’ socio-demographics and travel characteristics of participants. Items from the SERVPERF model (Cronin & Taylor, Citation1992) were adapted for the second section which measured service quality. However, the items were reworded to suit the current study setting (). Again, two additional dimensions – price and system and information quality – were added to the existing five dimensions (tangibles, assurance, responsiveness, reliability and empathy). Two questions on price were adapted from Zhou and Zhang (Citation2019) whilst items on system information and quality were sourced from Anderson et al. (Citation2013). The third and fourth sections examined customer satisfaction and loyalty respectively. Whilst items on the former were taken from Rust and Oliver (Citation1994), items on the later were adopted from Slack et al. (Citation2022). With the exception of items measuring socio-demographics and travel characteristics, the remaining sections of the study instrument were measured using a five-point Likert scale ranging from 1 (strongly disagree) to 5 (strongly agree).
Table 1. Questionnaire items.
Results
Background of participants
Majority of the participants () were males (60.1%) and were mostly single (65.4%). In terms of age, participants aged below 26 years (34.2%) slightly dominated participants aged between 26 and 30 years (33.5%) and those above 30 years (32.3%). Participants were well educated with majority of them (45%) having obtained a bachelor degree and were largely self-employed (37.2%).
Table 2. Socio-demographic characteristics.
Descriptive statistics
As seen from , users of e-hailing transport services had high scores for the following statements: REL 1 (m = 4.11), EMP 2 (m = 4.08), ASS 2 (m = 4.06), SIQ 1 (m = 4.06), REL 3 (m = 4.06), TAN 3 (m = 4.05), SIQ 2 (m = 4.04), SIQ 3 (m = 4.03) and REL 2 (m = 4.01). However, the mean ratings by users of e-hailing transport services of the following were the lowest: LOYAL 1 (m = 2.04), LOYAL 2 (m = 2.21), SATIS 1 (m = 3.03), SATIS 3 (m = 3.050) and SATIS 2 (m = 3.08). It can also be observed from that the standard deviation scores for the statements used in assessing the various constructs ranged from 0.420 to 0.960.
Table 3. Descriptive statistics.
Reliability analysis
To ensure that the study questionnaire measured what it intended to measure, the Cronbach’s alpha was computed for the items measuring service quality, customer satisfaction and customer loyalty. As seen from , the Cronbach’s alpha coefficients for these constructs from 0.733 to 0.971. This indicates that the study questionnaire was internally consistent as suggested by Hair et al. (Citation2006). AMOS Graphics (version 24) was employed for the confirmatory factor analysis (CFA) () and subsequently for the Structural Equation Modelling (SEM). The composite reliability (CR) values of between 0.756 and 0.829 as well as the average variance extracted (AVE) values of 0.510 and 0.601 indicates the data was adequately reliable (see Fornell & Larcker, Citation1981; Hair et al., Citation2006) for the analysis ().
Table 4. Confirmatory factor analysis.
Table 5. Model fit indices for the model.
Structural equation model fit indices
Further to the reliability analysis, the proposed model was checked for adequacy by using the fit indices recommended by Byrne (Citation2001) and Hu and Bentler (Citation1998). The model fit indices (IFI = 0.925; TLI = 0.907; CFI = 0.924; and RMSEA = 0.067) met the cut-off values and thus, satisfactory (). Furthermore, the square root of AVE () was higher than the squared correlation of factors under consideration, confirming the assumption of discriminant validity (Fornell & Larcker, Citation1981).
Table 6. Inter-construct correlation and square root of AVE.
Hypotheses testing
In all, the study tested eight (8) hypotheses (see and and ). As presented in , all the tested hypotheses were supported. All the seven (7) dimensions used in measuring service quality were significantly related to customer satisfaction. Specifically, Assurance (β = 0.149; p = .022); tangibles (β = 0.140; p = .045), responsiveness (β = 0.040; p = .008); reliability (β = 0.014; p = .015); empathy (β = 0.062; p = .000); system information (β = 0.013; p = .005) and price (β = 0.001; p = .008) were significantly related to customer satisfaction. Further to this, customer satisfaction was found to significantly influence customer loyalty (β = 0.663; p = .000).
Figure 2. Validated research model.
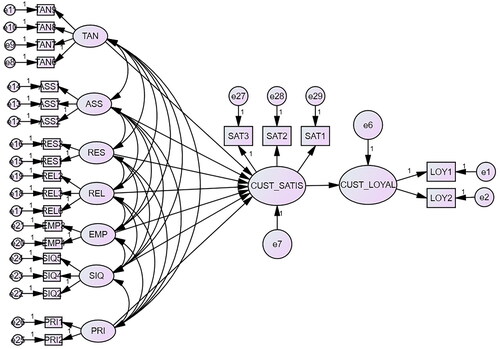
Figure 3. Simplified validated research model.
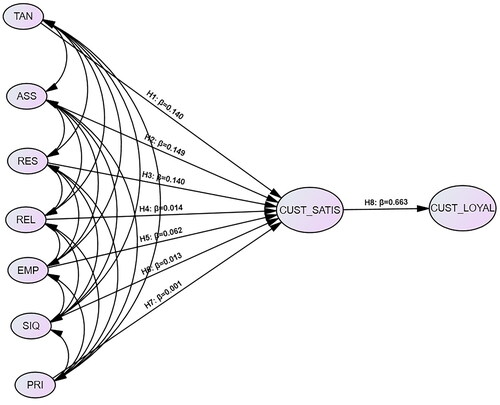
Table 7. Path coefficient of the structural equation model.
Discussion
In achieving the objectives of the study, the study employed the SERVPERF model and used the structural equation modelling technique to test the influence of service quality dimensions on customer satisfaction and the influence of customer satisfaction on customer loyalty among users of e-hailing transport services in a developing country context. All seven dimensions used in measuring service quality were significantly related to customer satisfaction, an indication of how important these dimensions are when it come the measurement customer satisfaction through the lens of service quality. This phenomenon alludes to previous research (Bismo et al., Citation2018; Pasharibu et al., Citation2018; Soleh et al., Citation2018; Susilo et al., Citation2018) on the practicality of users’ satisfaction of sharing economy transport in relation to service quality. It is an established fact that customers are most likely to rate their satisfaction from using sharing economy transport services when they perceive the service quality attributes to be positive (Bismo et al., Citation2018; Deneke et al., Citation2016). Whilst affirming the findings of Hamenda (Citation2018) that all attributes of service quality significantly influence satisfaction, the findings of the current study is at variance with studies that indicate that either a single construct of service quality (Murad et al., Citation2019; Jun, Citation2012) or a bundle of service quality attributes (Alemi et al., Citation2019; Balachandran & Hamzah, Citation2017; Sharma & Das, Citation2017) rather influence customer satisfaction.
In relation to specific attributes of service quality influencing satisfaction, the study found that ‘tangibles’ was directly related to the satisfaction users derive from using sharing economy transportation. In fact, ‘tangibles’ was found to be the most significant and dominant service quality dimension influencing users of Uber and Careem in Jordan (Jun, Citation2012). By extension, users of sharing economy transport services use ‘tangibles’ such as how clean, comfortable, modern vehicles are as well as how well dressed drivers are as a measure of their satisfaction in relation to ‘tangibles’. Users also measure their level of satisfaction from using sharing economy vehicles depending on whether they are able to see vehicle information displayed on the ‘app’ during the trip. Alemi et al.’s (Citation2018) study finding that ‘comfort’ is a determinant of users’ satisfaction of Uber cabs in California is a clear indication of the role ‘tangibles’ contribute to customer satisfaction for using sharing economy vehicles. However, the finding contradicts other studies (Kumar et al., Citation2022; Murad et al., Citation2019) that suggest that reliability is the most significant attribute that influences customer satisfaction of sharing economy vehicles.
Aside ‘tangibles’, assurance, responsiveness, reliability, empathy, system information quality and price also influence customer satisfaction in descending order. This finding collaborates findings from other studies (Alemi et al., Citation2018; Balachandran & Hamzah, Citation2017; Horsu & Yeboah, Citation2015; Inbalakshmi & Krishnamoorthy, Citation2015; Sharma & Das, Citation2017). For instance, users of sharing economy vehicles may be satisfied when they believe that drivers have knowledge of route, responds to complaints promptly, detour route on their own, have good attitude and prices are moderate. The implication is that; these service quality attributes contribute significantly to users’ satisfaction with sharing economy vehicles. As noted by Balachandran and Hamzah (Citation2017), cab drivers’ attitude towards Uber users significantly relates to users’ satisfaction.
As already alluded to, the study finding confirms previous studies. However, the order in which service quality attributes influence sharing economy vehicles users’ satisfaction as found in the current study contradicts previous research. In the current study, tangibles, assurance and responsiveness were found to be the first three service quality dimensions that influence customer satisfaction of users of sharing economy vehicles. However, empathy, responsiveness and tangibles (Sharma & Das, Citation2017), empathy and tangibles (Alemi et al., Citation2018; Balachandran & Hamzah, Citation2017) were the antecedents of customer satisfaction. These variations could be contextual. Findings from these studies may not necessarily apply to the context of this study. The domain within which sharing economy vehicles operate may have an influence on which service quality attributes users perceive to influence their satisfaction from sharing economy vehicles. The socio-cultural as well as technological differences between these two economies are likely to account for the varied perception of the influence of service quality attributes on the satisfaction they derived from using e-hailing vehicles. Interestingly, whilst empathy was cited as the most important service quality attribute influencing satisfaction in studies in developed economies (eg Alemi et al., Citation2019), tangibles (physical features of vehicles) was cited in the current study (developing economy). This is further confirmed by the study of Horsu and Yeboah (Citation2015) in Ghana in which tangibles was cited as the most important service quality attribute influencing customer satisfaction.
The study further established the influence of customer satisfaction on customer loyalty; affirming previous findings (Huang et al., Citation2019; Khuong & Dai, Citation2016; Kuswanto et al., Citation2019; Slack et al., Citation2022) that customer satisfaction is a precursor to customer loyalty. The implication is that, users’ will be inclined to use the services of sharing economy vehicles again, whilst recommending same to others if they are satisfied. Such customers exhibit both ‘attitudinal’ and ‘behaviour’ elements of loyal customers (Phuong & Trang, Citation2018).
Conclusion
The study examined the influence of service quality attributes on the satisfaction of using sharing economy vehicles and how satisfaction determines whether users will be loyal in terms of reuse and recommendation of sharing economy transport services to others. This is of greater importance from a developing economy perspective where the influx of sharing economy vehicles is on the ascendancy. The study employed the ‘performance only measure’ – SERVPERF Model developed by Cronin and Taylor (Citation1992) to measure perceived service quality of sharing economy vehicles. Findings from the study suggest that individual service quality dimensions as well as the composite service quality model both influence customer satisfaction in relation to usage of the services of sharing economy transport vehicles. Findings from the study further suggest that users of sharing economy vehicles are more inclined to reuse the services again and will recommend others to do same when they are perceived sharing economy transport services provide quality service. This draws attention to the important role of service quality in evaluating customer satisfaction and loyalty.
Implications
Theoretical implications
The study extends the applicability of the SERVPERF Model in measuring service quality of sharing economy vehicles in a developing economy’s context. Previous studies (see Azudin et al., Citation2018; Khuong & Dai, Citation2016; Kuswanto et al., Citation2019; Man et al., Citation2019; Murad et al., Citation2019; Sharma & Das, Citation2017; Siagian, Citation2019) explored sharing economy vehicle’s service quality from the SERVQUAL Model perspective to the neglect of SERVPERF Model. However, SERVPERF and SERVQUAL scale have been found to be adequate and can be used to predict overall service quality (Carrillat et al., Citation2007). Findings from the current study show the utility of the SERVPERF Model as a measure of sharing economy vehicles service quality. The study also contributes to the existing literature by validating the view that service quality of sharing economy vehicles could be measured either by unpacking the dimensions of service quality or by using the composite service quality construct, especially from the perspectives of users from a developing economy.
Furthermore, findings from the study could serve as baseline data for further investigations into service quality, customer satisfaction and loyalty within the sharing economy transportation domain. This is imperative considering the fact that these concepts are largely unexplored with Ghana and the sub-region. A cursory look at current literature points to a growing interest in governance, factors influencing the adoption of as well as the travel characteristics of users of ride-hailing services in Ghana and sub-Saharan Africa, safety and security of users of ride-hailing services and unionisation of ride-hailing drivers (Acheampong, Citation2021; Acheampong & Cugurullo, Citation2019; Acheampong & Siiba, Citation2019; Agyemang, Citation2020; Akorsu et al., Citation2022; Dzisi et al., Citation2020; Giddy, Citation2019).
Practical implications
Findings from the study have implications for management and drivers of sharing economy vehicles. Service providers strive to provide services that are consistent in order to enhance the satisfaction levels of their customers. To be able to do this, management of sharing economy vehicles should have a fair idea of who their clientele is and what attributes of service quality brings satisfaction to them. The study highlights the fact that every dimension of service quality contributes to the satisfaction of sharing economy users. Nonetheless, the study shows that the most critical dimension of service quality that produces significant satisfaction and users’ loyalty tendencies is ‘tangibles’. It is therefore imperative for operators of sharing economy transport services to ensure that the vehicles used for e-hailing services are in good condition, clean and comfortable as well as having their vehicles driven by drivers who are neat and clean (Nguyen-Phuoc et al., Citation2020; Sharma & Das, Citation2017; Ziyad et al., Citation2020). Combined with other dimensions, the physical attributes of sharing economy vehicles and physical appearance of drivers will continue to serve as the basis of users’ satisfaction which has implication for users becoming loyal. In essence, operators of sharing economy vehicles could use ‘tangibles’ as a bait to attract customers and leverage on professionalism of drivers, picking passengers at the appropriate time and location, avoiding detours during trips, adoption of empathetic behaviours by drivers towards passengers, continuously providing timely and up-to-date information on ‘Apps’ and charging relatively cheaper prices (Acheampong et al., Citation2020; Bahadur et al., Citation2018; Islam et al., Citation2019; Sharma & Das, Citation2017). These will ensure that users’ get the necessary satisfaction from patronising sharing economy vehicles which eventually lead to users becoming loyal by way re-using the services and recommending same to friends and family members.
Limitations
The study was conducted in the capital city of Ghana, to the neglect of other cities (such as Kumasi, Takoradi and Sunyani) which have sharing economy vehicles in operation. In view of this, generalisation of the study findings to cover the entire country should be done with caution. Future research should consider users of sharing economy vehicles in Takoradi, Kumasi and Sunyani. Results from such studies could give a clear picture of what dimensions of service quality contributes to users’ satisfaction and loyalty tendencies within the country at large.
Acknowledgement
The authors are grateful to all who participated in the study by providing valuation information during the data collection.
Disclosure statement
No potential conflict of interest was reported by the author(s).
Data availability statement
The data used to support the findings of this study are available from the corresponding author upon request.
Additional information
Notes on contributors
Sampson Wireko-Gyebi
Sampson Wireko-Gyebi (PhD) is a full time lecturer at the Department of Ecotourism, Recreation and Hospitality at University of Energy and Natural Resources, Sunyani, Ghana. His research interests include hospitality and tourism education, customer satisfaction, waste management at tourism sites and work-related stress among hotel employees.
Nancy Grace Baah
Nancy Grace Baah is a full time lecturer at the Department of Ecotourism, Recreation and Hospitality at University of Energy and Natural Resources, Sunyani, Ghana. Currently, she is pursuing her PhD at the Hong Kong Polytechnic University. She specialises in food and entrepreneurship in the hospitality and tourism industry.
Ricky Yao Nustugbodo
Ricky Yao Nustugbodo (PhD) is a senior lecturer in the Department of Ecotourism, Recreation and Hospitality at the University of Energy and Natural Resources, Sunyani Ghana. His research focuses on hospitality and tourism education, and women participation in ecotourism destinations, and tourism transportation, waste management in tourism sites and water, sanitation and hygiene practices among tourists.
Perpetual Zaazie
Perpetual Zaazie, a full time lecturer at the Department of Ecotourism, Recreation and Hospitality at the University of Energy and Natural Resources, Sunyani, Ghana. She is interested in research related to hospitality human resources, food production and product development.
Elizabeth Kafui Senya
Elizabeth Kafui Senya is a lecturer at Accra Technical University and currently a PhD student with research interest in employee safety in the hospitality industry.
Vida Bosomefi
Vida Bosomefi holds a Bachelor of Science in Hospitality Management from the University of Energy and Natural Resources, Sunyani, Ghana. Her research interest is related to e-hailing transport service quality and events management in the hospitality industry.
Sarah Amankona
Sarah Amankona holds a Bachelor of Science in Hospitality Management from the University of Energy and Natural Resources, Sunyani, Ghana. She is interested in service quality in the hospitality industry and food related research.
References
- Acheampong, R. A. (2020). Spatial structure, intra-urban commuting patterns and travel mode choice: Analyses of relationships in the Kumasi Metropolis, Ghana. Cities, 96, 1. https://doi.org/10.1016/j.cities.2019.102432
- Acheampong, R. A. (2021). Societal impacts of smart, digital platform mobility services—An empirical study and policy implications of passenger safety and security in ride-hailing. Case Studies on Transport Policy, 9(1), 302–19. https://doi.org/10.1016/j.cstp.2021.01.008
- Acheampong, R. A., & Cugurullo, F. (2019). Capturing the behavioural determinants behind the adoption of autonomous vehicles: Conceptual frameworks and measurement models to predict public transport, sharing and ownership trends of self-driving cars. Transportation Research Part F: Traffic Psychology and Behaviour, 62, 349–375. https://doi.org/10.1016/j.trf.2019.01.009
- Acheampong, R. A., & Siiba, A. (2019). Modelling the determinants of car-sharing adoption intentions among young adults: The role of attitude, perceived benefits, travel expectations and socio-demographic factors. Transportation, 47(5), 2557–2580. https://doi.org/10.1007/s11116-019-10029-3
- Acheampong, R. A., Siiba, A., Okyere, D. K., & Tuffour, J. P. (2020). Mobility-on-demand: An empirical study of internet-based ride-hailing adoption factors, travel characteristics and mode substitution effects. Transportation Research Part C: Emerging Technologies, 115, 102638. https://doi.org/10.1016/j.trc.2020.102638
- Adam, I., Adongo, C. A., & Amuquandoh, F. E. (2017). A structural decompositional analysis of eco-visitors’ motivations, satisfaction and post-purchase behaviour. Journal of Ecotourism, 18(1), 60–81. https://doi.org/10.1080/14724049.2017.1380657
- Agyeman, S., Kwarteng, R. A., & Zurkalnaine, S. (2019). Principal component analysis of driver challenges in the shared taxi market in Ghana. Case Studies in Transport Policy, 7(1), 73–86. https://doi.org/10.1016/j.cstp.2018.12.001
- Agyemang, E. (2020). Uber is here to stay: Exploring the policy implications of the Uber-Local Taxis turf war in Accra, Ghana. Case Studies on Transport Policy, 8(1), 59–66. https://doi.org/10.1016/j.cstp.2019.12.005
- Akorsu, A. D., Britwum, A. O., Bukari, S., Tachie, B. Y., & Dankwah, M. (2022). Online ride-hailing drivers’ organising to interest representation in Ghana. Employee Relations: The International Journal, 45(1), 243–256. https://doi.org/10.1108/ER-08-2021-0337
- Alemi, F., Circella, G., Handy, S., & Mokhtarian, P. (2018). What influences travelers to use Uber? Exploring the factors affecting the adoption of on-demand ride services in California. Travel Behaviour and Society, 13, 88–104. https://doi.org/10.1016/j.tbs.2018.06.002
- Alemi, F., Circella, G., Mokhtarian, P., & Handy, S. (2019). What drives the use of ridehailing in California? Ordered probit models of the usage frequency of Uber and Lyft. Transportation Research Part C: Emerging Technologies, 102, 233–248. https://doi.org/10.7708/ijtte.2020.10(4).06
- Amissah, E. F. (2013). Tourist satisfaction with hotel services in Cape Coast and Elmina, Ghana. American Journal of Tourism Management, 2(1), 26–33. https://doi.org/10.5923/s.tourism.201304.03
- Amoako, G. K., Dzogbenuku, R. K., & Kumi, D. K. (2021). Service recovery and loyalty of Uber sharing economy: The mediating effect of trust. Research in Transportation Business & Management, 41, 100647. https://doi.org/10.1016/j.rtbm.2021.100647
- Anderson, L., Ostrom, A. L., Corus, C., Fisk, R. P., Gallan, A. S., Giraldo, M., Mende, M., Mulder, M., Rayburn, S. W., Rosenbaum, M. S., Shirahada, K., & Williams, J. D. (2013). Transformative service research: An agenda for the future. Journal of Business Research, 66(8), 1203–1210. https://doi.org/10.1016/j.jbusres.2012.08.013
- Azmi, A., Ahmad, M. A., Abdullah, A., & Shaw G. (2019). Shopping in Malaysi: A study of international tourists’ expectation and experience. International Journal of Innovation, Creativity and Change, 8(4), 199–212.
- Azudin, N., Norhashim, M., & Nachiappan, G. (2018). Service quality of Uber in a small city: A case of Ipoh Uber drivers. Journal of Advanced Research in Business, Marketing, and Supply Chain Management, 2(1), 19–25. https://doi.org/10.1018/j.jarims.2018.10.018
- Bahadur, W., Aziz, S., & Zulfiqar, S. (2018). Effect of employee empathy on customer satisfaction and loyalty during employee–customer interactions: The mediating role of customer affective commitment and perceived service quality. Cogent Business & Management, 5(1), 1491780. https://doi.org/10.1080/23311975.2018.1491780
- Balachandran, I., & Hamzah, I. B. (2017). The influence of customer satisfaction on ride-sharing services in Malaysia. International Journal of Accounting & Business Management, 5(2), 184–196.
- Barnes, S. J., & Mattsson, J. (2016). Understanding current and future issues in collaborative consumption: A four-stage Delphi study. Technological Forecasting and Social Change, 104, 200–211. https://doi.org/10.1016/j.techfore.2016.01.006
- Birago, D., Mensah, S. O., & Sharma, S. (2017). Level of service delivery of public transport and mode choice in Accra, Ghana. Transportation Research Part F: Traffic Psychology and Behaviour, 46, 284–300. https://doi.org/10.1016/j.trf.2016.09.033
- Bismo, A., Sarjono, H., & Ferian, A. (2018). The effect of service quality and customer satisfaction on customer loyalty: A study of Grabcar services in Jakarta. Pertanika Journal of Social Sciences & Humanities, 26(T), 33–48.
- Bitner, M. J. (1990). Evaluating service encounters: The effects of physical surroundings and employee response. Journal of Marketing, 54(2), 69–82. https://doi.org/10.2307/1251871
- Botsman, R., & Rogers, R. (2011). What’s mine is yours: How collaborative consumption is changing the way we live. Harper Collins.
- Brady, M. K., Cronin, J. J., & Brand, R. R. (2002). Performance-only measurement of service quality: A replication and extension. Journal of Business Research, 55(1), 17–31. https://doi.org/10.1016/S0148-2963(00)00171-5
- Bremser, K., & Alonso-Almeida, M. M. (2017). Sharing economy and tourism: Lights and shadows. In S. Laporšek, S. Suzana, & D. Gomezelj (Eds.), Management International Conference, Monastier de Treviso, Italy (pp. 24–27). University of Primorska Press.
- Byrne, B. M. (2001). Structural equation modeling with AMOS, EQS, and LISREL: Comparative approaches to testing for the factorial validity of a measuring instrument. International Journal of Testing, 1(1), 55–86. https://doi.org/10.1207/S15327574IJT0101_4
- Caranza, V., Chow, K., Pham, H., Roswell, E., & Sun, P. (2016). Life cycle analysis: Uber vs car ownership. Environment, 159, 1–19.
- Carrillat, F. A., Jaramillo, F., & Mulki, J. P. (2007). The validity of the SERVQUAL and SERVPERF scales: A meta‐analytic view of 17 years of research across five continents. International Journal of Service Industry Management, 18(5), 472–490. https://doi.org/10.1108/09564230710826250
- Casidy, R., & Wymer, W. (2015). The impact of brand strength on satisfaction, loyalty and WOM: An empirical examination in the higher education sector. Journal of Brand Management, 22(2), 117–135. https://doi.org/10.1057/bm.2015.6
- Chao, V., & Kao, Y. (2009). Bridge over troubled water or long and winding road? Gap-5 in airline service quality performance measures. Managing Service Quality, 19(1), 114–134.
- Chen, M. K., & Sheldon, M. (2015). Dynamic pricing in a labor market: Surge pricing and the supply of Uber driver-partners. University of California (Los Angeles) Working Paper. http://citeseerx. ist. psu. edu/viewdoc/download
- Cronin, J., & Taylor, S. A. (1992). Measuring service quality: A re-examination and extension. Journal of Marketing, 56(3), 55–68. https://doi.org/10.1177/002224299205600304
- Cronin, J., & Taylor, S. A (1994). SERVPERF versus SERVQUAL: Reconciling performance-based and perceptions-minus-expectations measurements of service quality. Journal of Marketing, 58(1), 125–131. https://doi.org/10.1177/002224299405800110
- Culiberg, B. (2010). Identifying service quality dimensions as antecedents to customer satisfaction in retail banking. Economic and Business Review, 12(3), 151–166.
- Dabholkar, P. A., Shepherd, C. D., & Thorpe, D. I. (2000). A comprehensive framework for service quality: An investigation of critical conceptual and measurement issues through a longitudinal study. Journal of Retailing, 76(2), 139–173. https://doi.org/10.1016/S0022-4359(00)00029-4
- Dalberg. (2016). Digital sharing for global growth: Sharing resources, building economies. Dalberg Global Development Advisers. https://www.digitalsharingeconomy.com/
- DeMoranville, C. W., & Bienstock, C. C. (2003). Question order effects in measuring service quality. International Journal of Research in Marketing, 20(3), 217–231. https://doi.org/10.1108/08876040310482775
- Deneke, D., Million, N., Mebratu, B., Teshome, E., & Teferi, L. (2016). A survey of passengers’ satisfaction on service quality of public transport sector: The case of SNNPR, Ethiopia. British View, 1(1), 2309–3218.
- Dills, A. K., & Mulholland, S. E. (2018). Ride-sharing, fatal crashes, and crime. Southern Economic Journal, 84(4), 965–991. https://doi.org/10.1002/soej.12255
- Dzisi, E. K., Ackaah, W., Aprimah, B. A., & Adjei, E. (2020). Understanding demographics of ride-sourcing and the factors that underline its use among young people. Scientific African, 7, e00288. https://doi.org/10.1016/j.sciaf.2020.e00288
- Fitzsimmons, J. A., & Fitzsimmons, M. J. (2011). Service management: Operations, strategy, information technology (7th ed.). McGraw-Hill Education.
- Fornell, C., & Larcker, D. F. (1981). Evaluating structural equation models with unobservable variables and measurement error. Journal of Marketing Research, 18(1), 39–50. https://doi.org/10.1177/002224378101800104
- Gede, M. Y. B. I., & Sumaedi, S. (2013). An analysis of library customer loyalty: The role of service quality and customer satisfaction, a case study in Indonesia. Library Management, 34(6/7), 397–414. https://doi.org/10.1108/LM-05-2012-0025
- Giddy, J. K. (2019). The influence of e-hailing apps on urban mobilities in South Africa. African Geographical Review, 16, 1–13. https://doi.org/10.1080/19376812.2019.1589732
- Greenwood, B. N., & Wattal, S. (2017). Show me the way to go home: An empirical investigation of ride sharing and alcohol related motor vehicle homicide. MIS Quarterly, 41(1), 163–187. https://doi.org/10.25300/MISQ/2017/41.1.08
- Gronholdt, L., Martensen, A., & Kristensen, K. (2000). The relationship between customer satisfaction and loyalty: Cross-industry differences. Total Quality Management, 11(4-6), 509–514. https://doi.org/10.1080/09544120050007823
- Hahn, S. E., Sparks, B., Wilkins, H., & Jin, X. (2017). E-service quality management of a hotel website: A scale and implications for management. Journal of Hospitality Marketing & Management, 26(7), 694–716. https://doi.org/10.1080/19368623.2017.1309612
- Hair, J. F., Black, W. C., Babin, B. J., Anderson, R. E., & Tatham, R. L. (2006). Multivariate data analysis. Pearson Prentice Hall.
- Hall, J. D., Palsson, C., & Price, J. (2018). Is Uber a substitute or complement for public transit.? Journal of Urban Economics, 108, 36–50. https://doi.org/10.1016/j.jue.2018.09.003
- Hamenda, A. (2018). An integrated model of service quality, price fairness, ethical practice and customer perceived values for customer satisfaction of sharing economy platform. International Journal of Business & Society, 19(3), 709–724.
- Horsu, E. N., & Yeboah, S. T. (2015). Influence of service quality on customer satisfaction: A study of minicab taxi services in Cape Coast, Ghana. International Journal of Economics, Commerce and Management, 3(5), 1451–1464. https://doi.org/10.1080/14724049.2017.1380657
- Hu, L. T., & Bentler, P. M. (1998). Fit indices in covariance structure modeling: Sensitivity to underparameterized model misspecification. Psychological Methods, 3(4), 424–453. https://doi.org/10.1037/1082-989X.3.4.424
- Huang, P.-L., Lee, B. C. Y., & Chen, C.-C. (2019). The influence of service quality on customer satisfaction and loyalty in B2B technology service industry. Total Quality Management & Business Excellence, 30(13-14), 1449–1465. https://doi.org/10.1080/14783363.2017.1372184
- Hughes, R., & MacKenzie, D. (2016). Transportation network company wait times in Greater Seattle, and relationship to socioeconomic indicators. Journal of Transport Geography, 56, 36–44. https://doi.org/10.1016/j.jtrangeo.2016.08.014
- Hume, M., Mort, G. S., & Winzar, H. (2007). Exploring repurchase intention in a performing arts context: Who comes? and why do they come back? International Journal of Nonprofit and Voluntary Sector Marketing, 12(2), 135–148. https://doi.org/10.1002/nvsm.284
- Inbalakshmi, M., & Krishnamoorthy, V. (2015). Assessing the influence of call taxi service quality and passenger satisfaction. Asian Journal of Research in Marketing, 4(6), 18–33.
- Islam, S., Huda, E., Nasrin, F., & Freelanch Researcher, M. B. A. (2019). Ride-sharing service in Bangladesh: Contemporary states and prospects. International Journal of Business and Management, 14(9), 65–75. https://doi.org/10.5539/ijbm.v14n9p65
- Jun, T. W. (2012). Customer satisfaction towards services quality of public transportation in Kuching Area.
- Kaur, S., Tan, N., & Dutta, M. J. (2016). Media, migration and politics: The coverage of the little India riot in The Straits Times in Singapore. Journal of Creative Communications, 11(1), 27–43. https://doi.org/10.1177/0973258616630214
- Khuong, M. N., & Dai, N. Q. (2016). The factors affecting customer satisfaction and customer loyalty – A study of local taxi companies in Ho Chi Minh City, Vietnam. International Journal of Innovation, Management and Technology, 7(5), 228–233. https://doi.org/10.18178/ijimt.2016.7.5.678
- Ku, E. C., & Chen, C. D. (2015). Cultivating travellers’ revisit intention to e-tourism service: The moderating effect of website interactivity. Behaviour & Information Technology, 34(5), 465–478. https://doi.org/10.1080/0144929X.2014.978376
- Kumar, A., Gupta, A., Parida, M., & Chauhan, V. (2022). Service quality assessment of ride-sourcing services: A distinction between ride-hailing and ride-sharing services. Transport Policy, 127, 61–79. https://doi.org/10.1016/j.tranpol.2022.08.013
- Kuswanto, A., Sundari, S., Harmadi, A., & Hariyanti, D. A. (2019). The determinants of customer loyalty in the Indonesian ride-sharing services: Offline vs online. Innovation & Management Review, 17(1), 75–85. https://doi.org/10.1108/INMR-05-2019-0063
- Lee, C. (2016). To Uberize or not to Uberize? Opportunities and challenges in Southern Asia’s sharing economy. ISEAS, 2016(33), 1–17.
- Lim, R. (2016). The fourth industrial revolution. Jones Lang LaSalle IP.
- Man, C. K., Ahmad, R., Kiong, T. P., & Rashid, T. A. (2019). Evaluation of service quality dimensions towards customer’s satisfaction of ride-hailing services in Kuala Lumpur, Malaysia. International Journal of Recent Technology and Engineering, 7(5), 102–109.
- Mensah, I., & Ankamah, P. (2018). Taxi service quality and satisfaction among commuters in the Accra Metropolitan Area. Aussie-Sino Studies, 4(4), 1–9.
- Morfoulaki, M., Tyrinopoulos, Y., & Aifadopoulou, G. (2010). Estimation of satisfied customers in public transport systems: A new methodological approach. Journal of the Transportation Research Forum, 46(1), 63–72. https://doi.org/10.5399/osu/jtrf.46.1.981
- Morton, C., Caulfield, B., & Anable, J. (2016). Customer perceptions of quality of service in public transport: Evidence for bus transit in Scotland. Case Studies on Transport Policy, 4(3), 199–207. https://doi.org/10.1016/j.cstp.2016.03.002
- Murad, S., Al-Kayem, A., Manasrah, A., Halemah, N. A., & Qusef, A. (2019). The correlation between customer satisfaction and service quality in Jordanian Uber & Careem. International Journal of Innovative Technology and Exploring Engineering, 8(12), 5186–5192. https://doi.org/10.35940/ijitee.L2777.1081219
- Naik, C. N. K., Gantasala, S. B., & Prabhakar, G. V. (2010). SERVQUAL, customer satisfaction and behavioural intentions in retailing. European Journal of Social Sciences, 17(2), 200–213.
- Nguyen-Phuoc, D. Q., Su, D. N., Tran, P. T. K., Le, D.-T T., & Johnson, L. W. (2020). Factors influencing customer’s loyalty towards ride-hailing taxi services – A case study of Vietnam. Transportation Research Part A: Policy and Practice, 134, 96–112. https://doi.org/10.1016/j.tra.2020.02.008
- Noor, H. M., Nasrudin, N., & Foo, J. (2014). Determinants of customer satisfaction of service quality: City bus service in Kota Kinabalu, Malaysia. Procedia - Social and Behavioral Sciences, 153, 595–605. https://doi.org/10.1016/j.sbspro.2014.10.092
- Nutsugbodo, R. Y. (2013). Tourists’ perceptions of the quality of public transportation services in the Accra Metropolis: A SERVQUAL Approach. African Journal of Hospitality, Tourism and Leisure, 2(4), 1–8.
- Odame, P. K., Amoako-Sakyi, R. O., Abane, A., & Mensah, M. N. M. (2023). Alternative travel mode for commuters with disability in Accra: The lived experiences of Uber and taxi users. Case Studies on Transport Policy, 11, 100968. https://doi.org/10.1016/j.cstp.2023.100968
- Ojo, T. K., Okoree, D., & Mireku, S. D. (2014). Service quality and customer satisfaction of public transport on Cape Coast-Accra Route, Ghana. Developing Country Studies, 4(18), 142–149.
- Oliver, R. L. (1997). Satisfaction: A behavioural perspective on the consumer. McGraw-Hill.
- Olmstead, K., & Smith, A. (2016). How Americans define the sharing economy. Fact Tank.
- Parasuraman, A., Zeithaml, V. A., & Berry, L. L. (1985). A conceptual model of service quality and its implications for future research. Journal of Marketing, 49(4), 41–50. https://doi.org/10.1177/002224298504900403
- Pasharibu, Y., Paramita, E. L., & Febrianto, S. (2018). Price, service quality and trust on online transportation towards customer satisfaction. Jurnal Ekonomi Dan Bisnis, 21(2), 241–266. https://doi.org/10.24914/jeb.v21i2.1965
- Pasquali, P., Commenges, H., & Louail, T. (2022). It’s a three-way ring: E-hailing platforms, drivers and riders reshaping Accra’s mobility landscape. Case Studies on Transport Policy, 10(3), 1743–1753. https://doi.org/10.1016/j.cstp.2022.07.005
- Peck, J. L. (2017). New York City drunk driving after Uber (Working Paper). City University of New York (CUNY) Graduate Centre.
- Phuong, N. N. D., & Trang, T. T. D. (2018). Repurchase intention: The effect of service quality, system quality, information quality, and customer satisfaction as mediating role: A PLS approach of m-commerce ride hailing service in Vietnam. Marketing and Branding Research, 5, 78–91.
- PwC. (2015). Consumer intelligence series: The sharing economy. PwC.
- Rayle, L., Dai, D., Chan, N., Cervero, R., & Shaheen, S. (2016). Just a better taxi? A survey-based comparison of taxis, transit, and ridesourcing services in San Francisco. Transport Policy, 45, 168–178. https://doi.org/10.1016/j.tranpol.2015.10.004
- Reynolds, N. L., Simintiras, A. C., & Diamantopoulos, A. (2003). Theoretical justification of sampling choices in international marketing research: Key issues and guidelines for researchers. Journal of International Business Studies, 34(1), 80–89. https://doi.org/10.1057/palgrave.jibs.8400000
- Rust, R., & Oliver, R. L. (1994). Service quality: New directions in theory and practice. Sage.
- Sammy, J. (2016). Malaysian government ok to ride hailing services. Malaysian Digest. https://motiondigest.com/2016/08/11/malaysian-government-ok-to-ride-hailing-services/
- Schijns, J. M., Caniëls, M. C., & Le Conté, J. (2016). The impact of perceived service quality on customer loyalty in sports clubs. International Journal of Sport Management Recreation and Tourism, 24(C), 43–75.
- Schor, J. (2014, October). Debating the sharing economy. Great Transition Initiative.
- Sharma, K., & Das, S. (2017). Service quality and customer satisfaction-with special focus on the online cab industry in India. International Journal of Business and Management, 12(7), 192–200. https://doi.org/10.5539/ijbm.v12n7p192
- Siagian, V. (2019, December). Reviewing service quality of Uber: Between customer satisfaction and customer expectation [Paper presentation]. In S. M. Simanjuntak (Ed), Abstract Proceedings International Scholars Conference (Vol. 7, No. 1, pp. 1283–1292). International Scholars Conference. https://doi.org/10.35974/isc.v7i1.1976
- Silvestro, R. (2005). Applying gap analysis in the health services to inform the service improvement agenda. International Journal of Quality & Reliability Management, 22(3), 215–233. https://doi.org/10.1108/02656710510582462
- Slack, N., Singh, G., & Sharma, S. (2022). The effect of supermarket service quality dimensions and customer satisfaction on customer loyalty and disloyalty dimensions. International Journal of Quality and Service Sciences, 12(3), 297–318. https://doi.org/10.1108/IJQSS-10-2019-0114
- Soleh, A. N., Harini, C., & Djamaludin, D. (2018). The effect of service quality, price and trust to customer satisfaction users of transportation service online ojek (study on customers of Gojek in Semarang City). Journal of Management, 4(4), 1–7.
- Srivastava, M., & Kaul, D. (2016). Exploring the link between customer experience–loyalty–consumer spend. Journal of Retailing and Consumer Services, 31, 277–286. https://doi.org/10.1016/j.jretconser.2016.04.009
- Stalmašeková, N., Genzorová, T., Čorejová, T., & Gašperová, L. (2017). The impact of using the digital environment in transport. Procedia Engineering, 192, 231–236. https://doi.org/10.1016/j.proeng.2017.06.040
- Suhaimi, M. Z. A., Talib, S. A., Bachok, S., & Saleh, M. M. (2018). Service attributes, customer satisfaction and return usage: A case of Uber Malaysia. Journal of Tourism, Hospitality & Culinary Arts, 10(2), 81–103.
- Susilo, H., Haryono, A. T., & Mukeri, M. (2018). Analysis of the influence of price, service quality, promotion and trust on consumer satisfaction with the decision to visit as an intervening variable at Amanda Hills Hotel Bandungan. Journal of Management, 4(4), 1–20.
- van Lierop, D., Badami, M. G., & El-Geneidy, A. M. (2018). What influences satisfaction and loyalty in public transport? A review of the literature. Transport Reviews, 38(1), 52–72. https://doi.org/10.1080/01441647.2017.1298683
- Xu, J. D., Benbasat, I., & Cenfetelli, R. T. (2013). Integrating service quality with system and information quality: An empirical test in the e-service context. MIS Quarterly, 37(3), 777–794. https://doi.org/10.25300/MISQ/2013/37.3.05
- Yao, Z. G., & Ding, X. D. (2011). Measuring passenger’s perceptions of taxi service quality with weighted SERVPERF. Applied Mechanics and Materials, 97–98, 1181–1184. https://doi.org/10.4028/www.scientific.net/AMM.97-98.1181
- Zhou, Z., & Zhang, Z. (2019). Customer satisfaction of bicycle sharing: Studying perceived service quality with SEM model. International Journal of Logistics Research and Applications, 22(5), 437–448. https://doi.org/10.1080/13675567.2018.1513468
- Ziyad, A., Rehman, Z.-U., Batool, Z., & Khan, A. H. (2020). Influence of service excellence on consumer satisfaction of ridesharing industry. International Journal for Traffic and Transport Engineering, 10(4), 468–448. https://doi.org/10.7708/ijtte.2020.10(4).06