
 ?Mathematical formulae have been encoded as MathML and are displayed in this HTML version using MathJax in order to improve their display. Uncheck the box to turn MathJax off. This feature requires Javascript. Click on a formula to zoom.
Abstract
Using the gravity model as a theoretical framework and the two-step system generalized moment method (GMM) as an analytical model, this article investigated the drivers of Ethiopian sesame and coffee exports to its key trading partners for the period 2005–2021. The descriptive results revealed that few price, and income inelastic agricultural commodities, such as coffee, oilseeds, and pulses, account for more than half of Ethiopia’s export revenues. On average, 33.7, 36.9, and 19.4% of Ethiopia’s total exports were channeled to European, Asian, and African nations, respectively, in the period 2010–2021. The regression results of the two steps GMM showed that the foreign direct investment of Ethiopia, the gross domestic product of Ethiopia, and partner countries are positively and significantly related to the volume of Ethiopian sesame export. However, the official exchange rate, trade openness, and population of Ethiopia are negatively and significantly related to the volume of Ethiopian sesame and coffee exports. The weighted distance and the volume of Ethiopian sesame exports are negatively and significantly related in this study. The findings support the prediction of the gravity model. Ethiopian agricultural exports will be increased through encouraging domestic output growth, foreign direct investment, population control, and diversification of export destinations.
IMPACT STATEMENT
Though international trade is the engine of economic growth, the percentage share of Africa in international trade has remained below 3%. The majority of trade theories, including the absolute advantage theory, the comparative trade theory, the Heckscher-Ohlin theory, the preference similarity theory, and the new trade theory have focused on the factors that influence the volume of international trade between exporting and importing partner countries. However, the gravity model explains the variables influencing the volume of trade flows between countries. This study, therefore, aimed to identify the determinants of Ethiopian sesame and coffee exports using the gravity model as a theoretical framework and the two steps system generalized moment method as an analytical model.
1. Introduction
Countries in this world differ in terms of resource endowment and technological level in the production of products and services (Allaro, Citation2015). Differences in resource endowments and production processes, on the other hand, would result in a difference in factor prices between nations, and the difference in factor prices would result in a difference in product prices. As a result, as anticipated by classical trade theories (Smith, Citation1776), pricing differences generate international commerce. More crucially, international commerce improves resource allocation efficiency and promotes global output and welfare through specialization (Narayan & Bhattacharya, Citation2019; Victoria & Samuel, Citation2017). Recent experiences in some Asian countries have shown that increasing exports by specializing in highly productive agricultural products at the beginning of economic development, then in labor-intensive products, and finally in capital-intensive export products is critical for changing comparative advantage and structural transformation in developing countries (Cheffo, Citation2020).
Although the percentage share of developing nations in total international commerce climbed from 25% to 33% during the period from 2010 to 2020, Africa’s average contribution to worldwide trade remained below 3%. Similarly, even though Ethiopia has a relatively big potential for agricultural and horticultural products due to its broad geographical areas with varying climates and temperatures, Ethiopia’s average contribution to foreign commerce has remained below 0.03% (World Bank, Citation2020).
Furthermore, Ethiopian agricultural exports are dominated by a few commodities, with coffee, oilseeds, and pulses accounting for more than half of overall export values. This suggests that Ethiopian exports will be more commodity-concentrated. Similarly, Ethiopia’s export value to import value ratio was 35% in 2000, but it has since dropped to 23% in 2021 (National Bank of Ethiopia, Citation2022).
The Ethiopian government is now taking many steps to enhance the performance of the export industry. For instance, from 2010 and 2021, the currency rate for Ethiopia grew from 8 to 44 birr per US dollar. Other policy initiatives include the streamlining of export licensing, the preferential interest rate scheme with an interest rate that is 3.5% lower than the interest rate on loans for non-export activities, and foreign exchange retention at 10% of their revenues (Bekele & Mersha, Citation2019). The difference between Ethiopia’s import and export values has grown over the past three decades, although policy steps have been taken to improve the performance of the external sector. For instance, from 2000 and 2021, exports rose in value from 3 to 128 billion Ethiopian Birr. Nevertheless, between 2000 and 2021, the value of imports rose from 12 billion to 559 billion Ethiopian Birr (NBE, Citation2022). This suggests that the major reason for the worsening of Ethiopia’s trade balance is the lesser increase in export value when compared to the rise in import value (NBE, Citation2022). Ethiopia is now in a challenging situation in terms of earning foreign currency. A significant amount of foreign exchange shortages and debt load have resulted from the ongoing trade imbalance over the past three decades and the necessity to borrow to finance this gap. This demonstrates that despite government efforts to diversify Ethiopian export destinations and product lineups (Sawore, Citation2015), the export industry has not been able to meet the demands of the nation in terms of foreign exchange.
Finding the demand-side and supply-side factors that influence exports is crucial for scholars, policymakers, and practitioners since it is the sector that drives economic growth in emerging nations like Ethiopia. According to Aragie (Citation2013), Bereket (Citation2020), Geda and Seid (Citation2015), Hutchinson (Citation2019), Karamuriro and Karukuz (Citation2015), Kebede (Citation2016), and Siyakiya (Citation2016), the currency rate, gross domestic product, population, labor force, institutional quality, and trade policies all have an impact on Ethiopian exports. Trade openness, foreign direct investment, and infrastructure have all been named as factors influencing Ethiopian exports by some previous studies (Amoro & Shen, Citation2012; Gebrehiwot & Gebru, Citation2015; Geda & Seid, Citation2015; Gururaj et al, Citation2016; Zeray & Gachen, Citation2014). Most previous studies examined the determinants of Ethiopian exports by applying static panel data, time series data, and single commodity or total exports. However previous on the determinants of Ethiopian exports using the gravity model as a theoretical framework and the generalized moment method or the dynamic panel data model as an analytical model are quite limited. This study, therefore, identified the determinants of Ethiopian coffee and sesame exports, the two leading exports of Ethiopia, using the gravity model as the theoretical framework and the two-step system GMM as an analytical framework. Compared to the static panel data model, the dynamic panel data model or the system generalized moment method can better solve the problem of endogeneity, heteroscedasticity, autocorrelation, and multicollinearity in empirical analysis.
The study has two main objectives: (a) to evaluate the composition, trend, and important foreign markets of Ethiopian exports; and (b) to investigate the factors that influence the exports of coffee and sesame from Ethiopia by using the two steps system generalized moment method (GMM) of estimation. The rest of this article is structured as follows. The stylized facts about Ethiopian exports are presented in the second section. Materials and methods utilized in this investigation are covered in the third part. The results and discussion are presented in the fourth part, and the study’s conclusions are discussed in the last section.
2. Stylized facts of Ethiopian exports
2.1. Coffee and sesame exports of Ethiopia
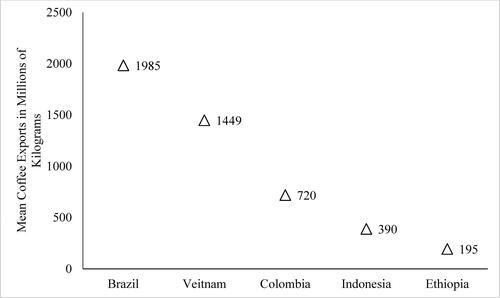
displays the average coffee exports of the top five nations between 2000 and 2021 in millions of kg. Brazil is the top-ranked country in the world for both coffee exports and production, while Ethiopia comes in fifth place overall. Between 2000 and 2021, the average coffee export of Brazil was 10 times more than the average coffee export of Ethiopia, while the average coffee export of Indonesia was twice as high as the average coffee export of Ethiopia.
Figure 1. Mean coffee export in millions of kilograms in the period 2000 and 2021.
Source: Author Computation using Data From FAO, 2022.
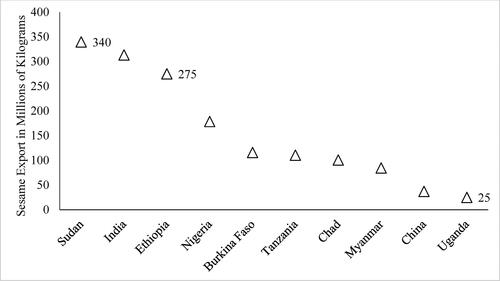
The top sesame exporting nations’ average annual sesame export volume from 2000 through 2021, expressed in millions of kilograms. Ethiopia, behind Sudan, is the world’s second-largest exporter of sesame, as seen in . Only 20% more sesame is exported from Sudan on average than is exported from Ethiopia on average. The ability of emerging nations to import capital goods and services is crucial to their ability to experience economic development and structural change. The ability to import is reliant on export revenue generated in foreign currency. Ethiopian exports, however, are heavily concentrated in a small number of main agricultural items that are subject to rapid changes in both internal and external causes.
Figure 2. Mean sesame export in millions of kilograms between 2000 and 2021.
Source: Author Computation using Data from FAO, 2022.
The composition and commodity concentration of Ethiopian exports, like that of other developing countries, have been blamed for the country’s short-run ups and downs in the export sector. For example, coffee has remained the leading export commodity in Ethiopia over the last three decades, followed by oilseeds and pulses. Although the share of coffee exports in Ethiopia’s total exports has been declining over time, the mean share of coffee exports in Ethiopia’s total exports was higher compared to the mean share of another export commodity in the period under consideration. As a result, only a few key agricultural goods, including coffee, oilseeds, and pulses, dominate Ethiopia’s export market, as seen in . For instance, the average percentage of the value of coffee, oilseeds, and pulse exports has maintained over 50% from 2010 to 2021. In addition, over the years 2010 to 2021, the average percentage of Ethiopia’s total exports that were in the form of coffee, oilseeds, pulses, gold, and khat was 70.72%. This demonstrates how little Ethiopian exports have changed from mostly agricultural goods to secondary manufactured goods, which may point to a high level of susceptibility of Ethiopian export revenues to internal and external shocks.
Table 1. Mean percentage composition of Ethiopian major exports in the period 2010–2021.
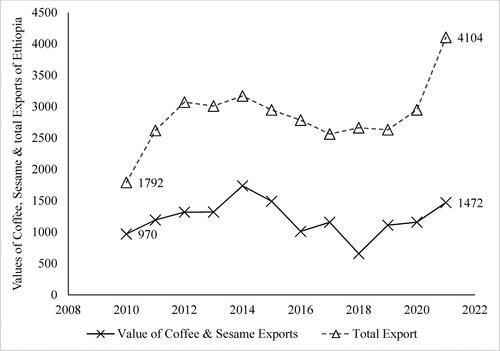
The contribution of non-agricultural sectors to Ethiopia’s export profits is seen in and has been extremely low over the past ten years. Sesame and coffee continue to be the main sources of Ethiopia’s foreign exchange profits, even if their proportion of the country’s overall exports declined from 54 to 36 percent between 2010 and 2021. As seen in , the trend of Ethiopia’s overall export value mirrors the value of sesame and coffee. Additionally, between 2010 and 2021, the difference between Ethiopia’s overall export value and that of its coffee and sesame shipments remained mostly stable. The implication is a limited diversification of Ethiopian exports from primary agricultural commodities to secondary and more robust industrial exports over time.
Figure 3. Values of sesame, coffee, and total exports of Ethiopia for the period 2010–2021.
Source: Author Computation using Data from NBE, 2023.
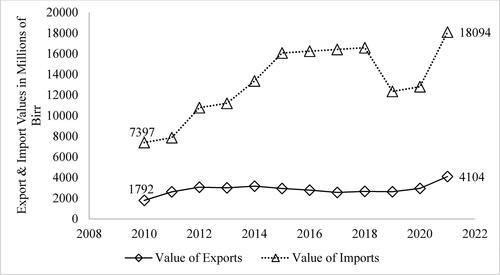
The gap between the total value of exports and imports has grown over time despite the ongoing devaluation of the Ethiopian currency. For instance, between 2010 and 2021, the trade imbalance rose from 5605 to 13,990 million Ethiopian Birr, despite a rise in the country’s currency rate from 14 to 44 Birr per US dollar. illustrates how between 2010 and 2021, the difference between Ethiopia’s export and import amounts widened. The consequence is that even while the value of Ethiopian currency has been steadily declining, import prices have been increasing faster than export prices. This could be influenced by how Ethiopian imports and exports are made up. While primary, price- and income-inelastic agricultural items make up the majority of Ethiopia’s exports, capital goods, semi-finished goods, petroleum, and consumer goods make up the majority of Ethiopia’s imports. Accordingly, it is possible that small import-dependent nations like Ethiopia’s trade balance will not be improved by devaluing the home currency in the absence of an exportable surplus and domestic manufacturing that can replace imported goods.
Figure 4. Trend of Ethiopian export and import values for the period 2010–2021.
Regarding the destination of Ethiopian exports, on average, 33.7% of Ethiopia’s total exports of Ethiopia were directed to European countries between the period 2015 and 2021, as it is shown in .
Figure 5. Mean share of Ethiopian exports by destinations for the period 2015–2021.
Source: Author Computation, 2023.
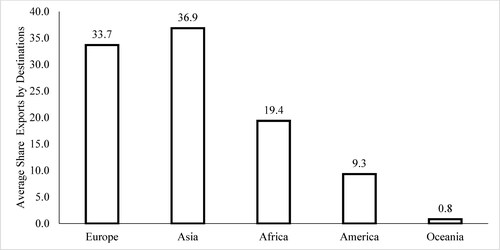
Additionally, during the same period, 36.7 and 19.4% of Ethiopia’s total exports went to Asian and African countries, respectively. Consequently, Ethiopian exports to Asian countries were higher than those to European countries between 2015 and 2021. In contrast, between 2015 and 2021, just 6% of Ethiopian exports were made to the United States.
The top ten major importers of Ethiopian coffee and sesame between 2005 and 2021 are presented in . As evidenced by , Germany, Saudi Arabia, and Japan are the first, second, and third major importers of Ethiopian coffee in the period under consideration. Similarly, China, Israel, and Turkiye are the leading importers of Ethiopian sesame between 2005 and 2021. The implication is that most Ethiopian coffee importers were European countries in the last 17 years. However, the majority of Ethiopian sesame importers are Asian countries as indicated in .
Table 2. Mean exports of Ethiopian coffee and sesame to major trade partners in 2010–2021.
3. Materials and methods
3.1. Data sources and variables
To fulfill the study’s research goals, secondary data were gathered from a variety of national and international organizations. Secondary data were gathered from the World Development Indicators (WDI), the Food and Agricultural Organization (FAO), and yearly reports from the National Bank of Ethiopia. The Food and Agricultural Organization (FAO) provided information on the export values of the country’s main agricultural exports, the exchange rate, the gross domestic product, and the labor force, while the National Bank of Ethiopia’s annual report provided information on the overall value of exports and imports. The World Development Indicator (WDI) was used to gather information about the consumer price index, foreign direct investment, and openness. This study employed panel data ranging from 2005 to 2021. Depending on the availability of data, this study included a sample of 17 major sesame trade partners and 31 major coffee trade partners from Asia, Europe, America, Africa, and Oceania. However, data between 2010 and 2021 were used for descriptive analysis to increase the visibility of the results.
3.2. Theoretical framework and analytical model
The majority of trade theories, including the absolute advantage theory (Smith, Citation1776), the comparative trade theory (Ricardo, Citation1951), the Heckscher-Ohlin theory (Heckscher, Citation1919), the preference similarity theory (Linder, Citation1961), and the new trade theory (Krugman, Citation1983), have focused on the factors that influence international trade. However, the gravity model describes the elements that affect the magnitude of international trade flows (Goldstein & Khan, Citation1978; Isaac, Citation2013). To address the shortcomings of both traditional and contemporary trade theories, Tinbergen (Citation1962) coined the Gravity model of international trade to explain the variables influencing the volume of trade flows between countries. The Gravity model is based on the hypothesis that the volume of international trade that takes place between two countries depends on the total national outputs of reporting country and partner countries and the physical distances from one another (Majeed & Ahmad, Citation2006). Consequently, the original gravity model may be stated as follows:
(1)
(1)
where
,
and
refer to the volume of Ethiopia’s coffee or sesame exports to each partner country, the gross domestic product of Ethiopia, and the gross domestic product of partner countries, respectively. In EquationEquation (1)
(1)
(1) , A refers to the constant term of the gravity equation. The parameters α, β, and γ refer to the elasticity of the exporting country’s GDP, the elasticity of the partner country’s GDP, and the elasticity of physical distance, respectively. The ability to import is measured by the partner country’s gross domestic product, whereas the ability to export is determined by the exporting nation’s gross domestic product. Similar to this, the distance between the exporting and importing partner nations serves as a stand-in for a variety of elements, including the expense of transportation, the cultural gap, the cost of communication, and the length of the shipping process. The imperfect substitutes model of global commerce also presupposes that the value or volume of a nation’s exports is influenced by the exchange rate and local price level. Finally, a dynamic gravity model for dynamic panel data can be specified by taking the natural log of equation # 2 and augmenting it with other independent variables that are assumed to affect the volume of Ethiopian coffee or sesame exports to its major trading partners.
(2)
(2)
EquationEquation (2)(2)
(2) shows a dynamic panel data model in which the lagged value of the outcome variable is included as one independent variable on the right-hand side of the equation. In this equation,
stands for the number of observations or partner nations, and
is for time, which spans from 2005 to 2021. Due to the association between the explanatory variables and the disturbance term, if Equationequation (2)
(2)
(2) is estimated using OLS, the estimation results will be skewed and inconsistent. Besides, the estimation of Equationequation (2)
(2)
(2) using the fixed effects model separates the individual fixed effects from the disturbance term. But still, the assumption of exogeneity is violated since the lagged value of the dependent variable exhibits a correlation with the disturbance component. The application of the 2SLS in Equationequation (2)
(2)
(2) resolves the endogeneity issue, but it only offers a reliable estimate when the number of instruments is lower than or equal to the number of regressors.
The generalized moment method (GMM) of estimation may enable the use of additional instruments and produce estimates of the population parameters that are objective, comprehensive, and effective. The advantage of GMM over 2SLS estimation is that additional instruments may be used by the GMM estimator to boost the accuracy of the estimates. The generalized moment method of estimation yields accurate results when there is a linear functional relationship, measurement errors, lagged dependent variables acting as regressors, omission of variables, independent variables that are not strictly exogenous, fixed individual effects, heteroscedasticity, and autocorrelation (Roodman, Citation2009).
First difference and system GMM estimators are the two different categories of GMM estimators. Arellano and Bond (Citation1991), who employed first differencing to get rid of the individual fixed effect from the dynamic panel data model, created the first-difference GMM estimator. To avoid the correlation between and
, they used two- and three-period lagged values of the outcome variables as instrumental variables for
in EquationEquation (2)
(2)
(2) .
(3)
(3)
However, in empirical research, the lagged level of regressors might occasionally be a poor instrument for first-differenced regressors, especially for small panels of data. The findings from the first-difference GMM estimators might not be effective in this situation for small-sample attributes. Additionally, the initial difference GMM estimators change data by deducting the variable’s historical value from its current value, which results in the loss of information (Blundell and Bond, Citation1998). As a result, we may employ the system GMM, which is an augmented difference-GMM estimation. As it changes the data by deducting the average value of all upcoming accessible observations of the variable, the system GMM estimator aids in recovering the information ignored by the first-difference GMM. Two equations, one at level and the other at the first difference, are used by the GMM system to acquire extra instruments. This results in greater efficiency of the estimates since the level value is utilized as an instrument for the differenced equation while the first difference is used as an instrument for the level equation. The system GMM estimators may be stated using a system of equations as follows, according to Arellano and Bover (Citation1995) and Blundell and Bond (Citation1998):
(4)
(4)
(5)
(5)
(6)
(6)
Thus, system GMM estimation involves the estimation of the system of equations in Equationequations (5)(5)
(5) and Equation(6)
(6)
(6) using two sets of instruments,
=
where,
stands for instruments for the model in the first difference, and
stands for instruments for the model at the level. The above system GMM estimator assumes that the instruments as a group are exogenous, and can be stated as follows:
(7)
(7)
The weighted average of the difference and level coefficients is what makes up the system GMM estimator. While the level equation is calculated using the lagged differences of the endogenous variables as instruments, the first difference equation uses the lagged level value as an instrumental variable. According to Blundell and Bond (Citation1998), the instruments in the level equation continue to be effective predictors of the endogenous variable, making the system GMM estimator perform better than the difference GMM estimator. A two-step process in the typical system GMM estimation may also be used to produce an asymptotically efficient estimator, according to Arellano and Bover (Citation1995). The parameters are consistently estimated in the first stage using a weight matrix of instrumental variables. A weight matrix that is consistent with the efficient weight matrix, which is utilized for the asymptotically efficient two-step estimates, may be created using these consistent first-step estimates. To produce consistent and asymptotically effective estimates for the parameters of the Gravity Model of Ethiopian coffee and sesame exports, this work calculated a two-step system GMM.
3.3. Variable description and expected sign
refers to the annual volume of sesame or coffee exports of Ethiopia to its major trade partners, which is measured in kilograms, while
stands for the one-period lagged volume of sesame or coffee exports to each country. Some previous studies, such as Teshome and Gelaw (Citation2019) and Gebrehiwot and Gebru (Citation2015), used the value of coffee exports as an outcome variable and found that the coefficient of
is positive and statistically significant. This means that the value of Ethiopian coffee exports has increased over time. It is crucial to determine if the amount of Ethiopian sesame or coffee exports to its partner nations is rising or falling when Ethiopian export revenues are insufficient to provide an economy with the foreign currency needed to purchase capital goods and services. To determine if the volume of Ethiopian sesame or coffee exports to each partner nation is increasing or decreasing, this study employed the volume of sesame or coffee exports in kilograms as outcome variables and the lagged volume of sesame or coffee exports as covariates. Additionally, Egger (Citation2002) advised against looking for the ideal lag length and instead simply utilizing the initial lag of the outcome variable as a covariate.
refers to the nominal exchange rate of Ethiopia, which is measured in birr per US dollar. The coefficient of this variable is expected to be positive because currency devaluation is assumed to improve the competitiveness of the devaluating country (Maugu, Citation2013; Mengistu, Citation2014). Moreover, the coefficient of foreign direct investment in Ethiopia,
, is also expected to be positive, because economic theory predicts that foreign direct investment increases the export capacity of a nation by supplying capital goods and services (Sisay, Citation2010).
The variables and
refer to the gross domestic product of Ethiopia and its major trade partners, respectively, and are measured in United States dollars. Trade theory predicts that the GDP of exporting and importing countries has a positive effect on the volume of trade flows among them (Head, Citation2003; Sertoglu & Dogan, Citation2016). Ethiopia’s GDP is on the supply side of trade, and it measures the capacity of the country to produce and export more output, whereas the GDP of the partner country measures the ability of the country to import and is on the demand side of trade.
The sign of the coefficients of the population size of the exporting country and the population size of the partner country
depend on the relative strength of the absorption effect and economies of scale of the large population. A country that exports can either export more due to economies of scale (increased production capacity) or export less due to higher consuming capacity (absorption impact) if it has a big population. Similar to the last example, a partner nation with a sizable population can produce more owing to economies of scale and decrease imports, or consume more and raise imports. Because of this, there are conflicting findings in the empirical literature about the direction of the link between export volume and the population size of exporting and partner countries. Studies by Teshome and Gelaw (Citation2019), and Gebrehiwot and Gebru (Citation2015) both found a positive coefficient for the population size of the exporting nation and a negative sign for the population size of partner countries.
As predicted by the gravity model, the coefficient of the weighted distance between the exporting country and partner country, is expected to be negative, and it is a proxy for many variables, such as transportation cost, communication cost, time cost, cultural distance, and other factors. Because the distance between exporting and partner countries is fixed, the method developed by Karagoz and Saray (Citation2008) is used to change the distance into a time-varying variable. According to this method, a weighted distance is obtained by multiplying the GDP of the exporting country by the physical distance and dividing it by the sum of the GDP of the exporting country over the period under consideration. The trade openness of Ethiopia (
) measures the degree of trade liberalization and the participation of a nation in international trade (Haitho, Citation2013; Hatab et al., Citation2010). In other words, trade openness measures the degree of government control over the free flow of goods and services across the nation’s boundaries. This variable is measured as the ratio of the sum of export and import values to gross domestic, and the coefficient of this variable is expected to be positive in the gravity equation.
3.4. Some specification tests of system GMM
There are two post-estimation tests for the one- and two-step system GMM estimation models. The first specification test is the test for the existence of second-order serial autocorrelation, which helps to identify whether the residual data at the level are auto-correlated. The presence of autocorrelation in the disturbance term may make some lags invalid instruments for endogenous covariates. The test for the existence of autocorrelation in the system GMM estimation uses the Arellano-Bond test for autocorrelation, which has a null hypothesis of no autocorrelation. There are two tests in the Arellano-Bond test: the first-order autocorrelation test and the second-order autocorrelation test. Accordingly, the first-order autocorrelation test is used to determine if autocorrelation exists for the differenced equation, and the second-order autocorrelation test is used to determine whether autocorrelation exists for the level equation (Arellano & Bond, Citation1991). Hansen and Sargan created a test statistic for the second specification test in system GMM estimation, in which the null hypothesis is that all the instruments collectively are exogenous or valid. As a result, a larger test statistical probability value favors the null hypothesis and denotes superior system GMM estimation results.
4. Results and discussion
Panel data include both cross-sectional and time-series features; therefore, the data were evaluated for stationarity; the test results are shown in . The population of partner nations, foreign direct investment, and the gross domestic product of Ethiopia are integrated into order one, I (1) variables based on the Harris-Tzavalis panel data unit root test technique. The following eight variables are integrated in the I (0) variable order, which is the order of zero. As a result, the amount of sesame exports, coffee exports, currency rates, weighted distances, consumer price indices, trade openness of Ethiopia, GDP of partner nations, and the population of Ethiopia are all static at the same level. Before being used in the regression analysis, non-stationary variables were converted into a stationary series since the presence of non-stationarity might result in erroneous regression. To estimate the generalized moment technique, all non-stationary variables were converted into stationarity using first differencing.
Table 3. The Harris-Tzavalis unit root test results for all variables in the model.
Applying the two-step system generalized moment technique, the factors that influence Ethiopian coffee and sesame exports were calculated, and the findings are shown in . For the exports of sesame and coffee, the coefficient of Ethiopian GDP is positive and significant at 1% and 10%, respectively. This is because a country’s ability to export would expand if its domestic output increased. Put differently, the finding supports the prediction of the gravity theory which assumes that the domestic product of the exporting country positively affects the volume of exports to partner countries. By applying the generalized moment method of estimation, studies conducted by Bekele and Mersha (Citation2019), Cheffo (Citation2020), and Hutchinson (Citation2019) showed that gross domestic product is positively and significantly related to the volume of exports. In the same vein, the coefficient of gross domestic product of the partner country is positive and significant in affecting the volume of Ethiopian sesame exports. Yet, a study conducted by Henry and Wilfred (Citation2015) using the generalized moment method of estimation found that the gross domestic products of partner countries and exporting countries positively and significantly affect the volume of exports in Uganda. This is also in agreement with the hypothesis of the gravity model which postulates that the output of a partner country positively affects the volume of international trade.
Table 4. Regression results of the system generalized moment method.
For coffee exports, the foreign direct investment coefficient is positive and significant at the 1% level (). In other words, the volume of coffee exports rises by 0.59% (ceteris paribus) on average for every 1% growth in foreign direct investment in Ethiopia. The implication is that foreign direct investment, by lowering the foreign exchange constraints of developing countries like Ethiopia, improves the production of exportable commodities. Negussie and Dessalegn (Citation2014) and Bonuedi (Citation2013) also obtained a positive and significant association between foreign direct investment and the volume of exports in developing nations. Still, by applying the generalized moment method of estimation, studies conducted by Cabral and Alvarado (Citation2019) and Bashir (Citation2023) also found a positive and significant association between foreign direct investment and the volume of exports in developing countries.
The official exchange rate and the volume of Ethiopian coffee exports are negatively and significantly related as indicated in . There are dichotomous views in the theoretical and empirical literature regarding the link between exchange rate and the volume of exports. Currency devaluation gives with one hand and takes with the other hand. That means currency devaluation is assumed to decrease the level of imports and increase the level of exports. As indicated in , the exchange rate negatively and significantly decreases the volume of Ethiopian coffee exports at a 1% level of significance. In particular, for ceteris paribus, a one percent change in the exchange rate causes an 8.2% fall in the volume of coffee exports. Many authors argue that currency devaluation is less likely to promote exports in small supply-constrained agrarian economies. Therefore, the effect of currency devaluation on the volume of exports depends on the income and price elasticities of the commodity.
Most of Ethiopia’s exports are price and income-inelastic agricultural products with longer gestation periods. With the help of time-series data and an autoregressive distributed lag model, Thuy and Thuy (Citation2019) investigated the effect of the exchange rate on exports in Vietnam and discovered that a depreciation of the national currency sharply reduces export volume. Agricultural exports from Vietnam are shown to be negatively and significantly impacted by the currency rate, according to Nguyen (2013). Moreover, a study conducted by Bostan et al. (Citation2018) in Romania found a negative and significant association between exchange rate devaluation and Romanian exports using OLS estimations.
The coefficient of one period-lagged volume of Ethiopian sesame export is positive and statistically significant as evidenced from . At a 1% level of significance, as one period lagged volume of sesame export increases by 1%, the volume of current sesame export increases, on average, by 0.714% in Ethiopia, ceteris paribus. However, the coefficient of one period lagged volume of Ethiopian coffee export is negative and statistically significant at the 1% level. This difference may be due to the difference in the gestation period of sesame and coffee production. When Ethiopian coffee exports are broken down by key partners, it becomes clear that the volume of coffee exports to each partner nation has been falling while the value of coffee exports to each partner nation has been growing. A study conducted by Bashir (Citation2023) using the gravity model as a theoretical framework and the generalized moment method as an analytical framework also found that the lagged value of Nigerian exports negatively and significantly impacted the current value of exports.
Ethiopian population is negatively and significantly associated with the volume of coffee and sesame exports as shown in . On the one hand, economic theory predicts that a large population will lower the cost of labor, which will increase the demand for labor and, in turn, increase the level of output in the nation. On the other hand, it is assumed that a large population may increase the domestic demand for the product and will lower the volume of exports. This finding suggests that Ethiopia does not gain from its large labor force in terms of increasing agricultural export production. A study conducted by Hsieh et al. (Citation2022) on the impact of China’s foreign direct investment along with The Belt and Road countries on trade flows using the gravity model found that the labor force population has a negative and significant effect on the volume of trade flow between importing and exporting countries.
As predicted by economic theory, the weighted distance between Ethiopia and the partner countries is negatively and significantly related to the volume of Ethiopian sesame exports. In other words, the volume of Ethiopian sesame exports to each partner nation declines, on average, by 0.62% for every percentage point increase in the weighted distance between Ethiopia and its trading partners. This is so because the cost of transportation, communication expenses, and cultural distance are all proxied by the distance between an exporting nation and its trade partners. A negative and substantial association between distance and export level has also been shown in earlier research by Gebrehiwot and Gebru (Citation2015) and Teshome and Gelaw (Citation2019). Since the probability of chi-square is larger than 5%, the Arellano-Bond test for second-order autocorrelation failed to reject the null hypothesis that there was no autocorrelation in the residual data at the level. In a similar vein, the null hypothesis that all instruments are exogenous as a group was not rejected by the Hansen test for the validity of all instruments as a group.
5. Conclusion
Though international trade is the engine of economic growth, the percentage share of Africa in international trade has remained below 3%. This study examined the factors affecting the volume of Ethiopian coffee and sesame exports by applying the gravity model as a theoretical framework and the two-step system generalized moment method as an analytical framework for the period 2005-2021. Panel data on the dependent and independent variables were gathered for 17 and 31 partner countries of sesame and coffee exports of Ethiopia, respectively.
The descriptive results revealed that few price, and income inelastic agricultural commodities, such as coffee, oilseeds, and pulses, account for more than half of Ethiopia’s export revenues. On average, 33.7, 36.9, and 19.4% of Ethiopia’s total exports were channeled to European, Asian, and African nations, respectively in the period 2010–2021. The regression results of the two steps GMM showed that the foreign direct investment of Ethiopia, the gross domestic product of Ethiopia, and partner countries are positively and significantly related to the volume of Ethiopian sesame export. However, the official exchange rate, trade openness, and population of Ethiopia are negatively and significantly related to the volume of Ethiopian sesame and coffee exports. The weighted distance and the volume of Ethiopian sesame exports are negatively and significantly related in this study. This implies that more domestic production growth and foreign direct investment inflow will boost the export surplus and enhance the external sector’s performance.
The findings support the prediction of the gravity model which assumes that the gross domestic products of the exporting country and partner countries are positively related to the volume of exports but the distance between exporting and partner countries is negatively related to the volume of trade flow. Ethiopian agricultural exports will be increased through encouraging domestic output growth, foreign direct investment, population control, and diversification of export destinations. Further, Ethiopian exports must be diversified away from primary, income, and price inelastic agricultural products towards secondary, and less susceptible export goods.
Disclosure statement
No potential conflict of interest was reported by the author(s).
Additional information
Funding
Notes on contributors

Fassil Eshetu
The author has good experience in teaching postgraduate students, conducting quantitative research, and developing community projects at Arba Minch University, one of the leading higher educations in Ethiopia. The research areas of the author include international trade, rural poverty, migration, vulnerability, climate-smart agriculture, livelihood diversification, efficiency, food insecurity, and resilience of rural households. The author published different articles in reputable international journals. Besides, the author provides different training on statistical software such as STATA, EVIEWS, SPSS, AMOS, and R software.
References
- Allaro, H. B. (2015). Export performance of oilseed and its determinants in Ethiopia. American Journal of Economics, 1(1), 1–15. https://doi.org/10.5923/j.economics.20110101.01
- Amoro, G., & Shen, Y. (2012). The determinants of agricultural export: Cocoa and rubber in Cote d’Ivoire. International Journal of Economics and Finance, 5(1), 228–233. https://doi.org/10.5539/ijef.v5n1p228
- Aragie, A. (2013). Evaluation of Ethiopia’s bilateral and potential exports in the Middle East: A gravity model approach. Journal of Emerging Trends in Educational Research and Policy Studies, 4(1), 198–204.
- Arellano, M., & Bond, S. (1991). Some tests of specification for panel data: Monte Carlo evidence and application to employment equations. The Review of Economic Studies, 58(2), 277–297., & https://doi.org/10.2307/2297968
- Arellano, M., & Bover, O. (1995). Another look at the instrumental variable estimation of error components models. Journal of Econometrics, 68(1), 29–51. https://doi.org/10.1016/0304-4076(94)01642-D
- Bashir, A. W. (2023). Drivers of manufacturing export performance in Nigeria: An application of the GMM estimation approach. Saudi Journal of Economics and Finance, 7(11), 548–560. https://doi.org/10.36348/sjef.2023.v07i11.010
- Bekele, W. T., & Mersha, F. G. (2019). A dynamic panel gravity model application on the determinant factors of Ethiopia’s coffee export performance. Annals of Data Science., Springer, Dire Dawa University. https://doi.org/10.1007/s40745-019-00198-4
- Bereket, I. (2020). The determinants of agricultural export in Ethiopia : An error correction modle and cointegration approach. Journal of Economics and Sustainable Development, 11(3), 51–57. https://doi.org/10.7176/JESD/11-3-05
- Blundell, R., & Bond, S. (1998). Initial conditions and moment restrictions in dynamic panel data models. Journal of Econometrics, 87(1), 115–143. https://doi.org/10.1016/S0304-4076(98)00009-8
- Bonuedi, I. (2013). Determinants of Ghana’s bilateral trade flows: A gravity model approach [MSc thesis]. University of Science and Technology.
- Bostan, I., Toderașcu, C., & Firtescu, B. N. (2018). Exchange rate effects on international commercial trade competitiveness. Journal of Risk and Financial Management, 11(2), 19. https://doi.org/10.3390/jrfm11020019
- Cabral, R., & Alvarado, J. A. (2019). Manufacturing export determinants across Mexican states, 2007- 2015. Banco de México, Documentos de Investigación, Working Papers NO. 2019 11.
- Cheffo, A. (2020). Export performance of spice crops and its determinants in Ethiopia : VECM analysis. Journal of Economics and Sustainable Development, 11(3), 58–67. https://doi.org/10.7176/JESD/11-3-06
- Egger, P. (2002). An econometric view on the estimation of gravity models and calculation of trade potentials. The World Economy, 25(2), 297–312. https://doi.org/10.1111/1467-9701.00432
- Gebrehiwot, G., & Gebru, B. (2015). Ethiopia’s foreign trade potential: inferences from a dynamic gravity approach. International Journal of Economics and Business Research, 9(4), 355–375. https://doi.org/10.1504/IJEBR.2015.069667
- Geda, A., & Seid, E. H. (2015). The potential for internal trade and regional integration in Africa. Journal of African Trade, 2(1-2), 19–50. https://doi.org/10.1016/j.joat.2015.04.001
- Goldstein, M., & Khan, M. S. (1978). The supply and demand for exports: A simultaneous approach. The Review of Economics and Statistics, 60(2), 275–286. https://doi.org/10.2307/1924981
- Gururaj, B., Satishkumar, M., & Kumar, A. (2016). Analysis of factors affecting the performance of exports in India. International Journal of Agriculture, Environment and Biotechnology, 9(4), 613–616. https://doi.org/10.5958/2230-732X.2016.00079.6
- Haitho, N. (2013). Determinants of Vietnam’s Exports: A Gravity Model Approach. [Thesis, Martin De Tours School of Management and Economics]. University of Bangkok.
- Hatab, A. A., Romstad, E., & Huo, X. (2010). Determinants of Egyptian agricultural exports: A gravity model approach. Modern Economy, 01(03), 134–143. https://doi.org/10.4236/me.2010.13015
- Head, K. (2003). Gravity for beginners, Lecture Note. University of British Columbia.
- Heckscher, E. (1919). The effect of foreign trade on the distribution of income. (pp. 497–512.) Ekonomisk Tidskrift.
- Henry, T., & Wilfred, N. (2015). Determinants of Uganda’s export performance: A gravity model analysis . International Journal of Business and Economics Research , 4(2 ), 45 –54 . https://doi.org/10.11648/j.ijber.20150402.14
- Hsieh, T.-H., Zhu, Y.-B., & Huang, K.-L. (2022). Using the gravitational mixed models to analyze the impact of China’s foreign direct investment along with The Belt and Road countries on trade flows. Frontiers in Psychology, 13, 960722. https://doi.org/10.3389/fpsyg.2022.960722
- Hutchinson, W. K. (2019). Linguistic distance as a determinant of bilateral trade. Southern Economic Journal, 72(1), 1–15. https://doi.org/10.2307/20062091
- Isaac, B. (2013). Determinants of Ghana’s Bilateral Trade Flow: A Gravity Model Approach. [MSc Thesis]. University of Science and Technology.
- Karagoz, K., & Saray, M. (2008). Trade potential of Turkey with Asia Pacific countries: Evidence from panel gravity model [Paper presentation]. 7th International Conference on East and West Asia Economic Relations, University of Esfahan, Iran.
- Karamuriro, H. T., & Karukuza, W. N. (2015). Determinants of Uganda’s export performance. International Journal of Business and Economics Research, 4(2), 45–54.
- Kebede, A. (2016). Determinants and potentials of foreign trade in Ethiopia: A gravity model analysis. Munich Personal RePEc Archive, 74509(13), 19.
- Kingu, J. (2014). Determinants of Tanzanian agricultural export: A case of cotton lint. Developing Country Studies, 4(1), 91–104.
- Krugman, P. (1983). New theories of trade among industrial countries. American Economic Review, 73(2), 343–347.
- Linder, S. (1961). An essay on trade and transformation. Wiley.
- Majeed, M. T., & Ahmad, E. (2006). Determinants of exports in developing countries. The Pakistan Development Review, 45(4II), 1265–1276. https://doi.org/10.30541/v45i4IIpp.1265-1276
- Maugu, L. K. (2013). Determinants of supply of Kenya’s major agricultural crop exports. International Journal of Business, Humanities, and Technology, 3(5), 54–62.
- Mengistu, A. A. (2014). Ethiopia’s export performance with major trade partners: A gravity model spproach. Journal of Natural Sciences Research, 4(20), 21–28.
- Narayan, S., & Bhattacharya, P. (2019). Relative export competitiveness of agricultural commodities and its determinants : Some evidence from India. World Development, 117, 29–47. https://doi.org/10.1016/j.worlddev.2018.12.013
- National Bank of Ethiopia (NBE). (2022). Annual Report on the Ethiopian Economy.
- Negussie , Z. , & Dessalegn , G. (2014). Determinants of bilateral trade between Ethiopia and its major trading partners: A gravity model approach . Journal of Economics and Sustainable Development , 5 (15 ), 2222–2855.
- Ricardo, D. (1951). The works and correspondence of David Ricardo. Piero Sraffa (Ed.) with the collaboration of M. H. Dobb. Cambridge University Press.
- Roodman, D. (2009). How to do xtabond2: An introduction to difference and system GMM in Stata. The Stata Journal: Promoting Communications on Statistics and Stata, 9(1), 86–136. https://doi.org/10.1177/1536867X0900900106
- Sawore, A. M. (2015). Determinants of export trade in econometric study with special reference to Ethiopia. International Journal of Science and Research, 5(12), 132–137.
- Sertoglu, K., & Dogan, N. (2016). Agricultural trade and its determinants: Evidence from bounds testing approach for Turkey. International Journal of Economics and Financial Issues, 6(2), 450–455.
- Sisay, M. (2010). Export performance and determinants in Ethiopia. Munich Personal RePEc Archive, Paper Number. 29427.
- Siyakiya, P. (2016). An econometric analysis of Zimbabwe’s export competitiveness. Maghreb Review of Economics and Management, 3, 1–14.
- Smith, A. (1776). An inquiry into the nature and causes of the wealth of nations. Oxford University Press.
- Teshome, W., & Gelaw, F. (2019). A dynamic panel gravity model application on the determinant factors of Ethiopia’s coffee export performance. Annals of Data Science, Springer, Dire Dawa University.
- Thuy, V. N. T., & Thuy, D. T. T. (2019). The impact of exchange rate volatility on exports in Vietnam: A bounds testing approach. Journal of Risk and Financial Management, 12(1), 6. https://www.mdpi.com/1911-8074/12/1/6/htm https://doi.org/10.3390/jrfm12010006
- Tinbergen, J. (1962). Shaping the World Economy: Suggestions for an International Economic Policy. The Twentieth Century Fund.,
- Victoria, E., & Samuel, J. (2017). Empirical determinants of agricultural exports in Nigeria. European Journal of Business and Management, 9(23), 14–20.
- World Bank. (2020). World Bank open data. World Bank Group.
- Zeray, N., & Gachen, D. (2014). Determinants of bilateral trade between Ethiopia and its major trading partners: A gravity model approach. Journal of Economics and Sustainable Development, 5(15), 82–88.