
Abstract
Political economy reforms have generated significant economic development in many countries in the last few decades. We explore the impact of changing political and economic freedoms on income inequality, and how different income groups were affected by this economic growth. Particular attention is paid to the income levels of middle class in response to expanding trade freedoms. Data from 248 countries over a period of 25 years is analyzed using OLS estimation after identifying middle and other classes using absolute and relative approaches. Models include interactions of different classes with levels of political and economic freedoms as well as the level of economic development. Results suggest a positive impact of trade freedom across all income groups. The impact was higher in percentages for lower incomes groups, but insufficient to reduce income inequality. The effects of other freedoms varied with level of development of a country and with its different income groups: For middle-income countries, free trade created large middle classes. Rule of law and regulatory efficiency resulted in positive and limited government in negative impacts across quintiles. Political freedom positively impacted the income of upper quintiles in middle-income and lower classes in high-income countries, and negatively for upper classes in high-income countries. Policy makers can consider the results in prioritization of the reforms to gauge political support from various income groups, and in devising approaches to remedy the negative implications on income levels for certain groups.
REVIEWING EDITOR:
1. Introduction
Globalization has always had its opponents, yet there appears to be growing popular sentiment towards protectionism. General Electric’s former CEO Jeff Immelt noted that populism and protectionism has been rising as witnessed not only with Brexit, but also in many other parts of the World. Efforts such as Trans Pacific Partnership, Transatlantic Trade and Investment Partnership and the EU-Canada Comprehensive Economic and Trade Agreement are met with protests across Europe and elsewhere (The Economist, Citation2016). These protectionist agendas everywhere are raising pessimism among managers (Kelvak et al., Citation2018). The rise of populist autocratic world leaders demonstrates popular resistance not only to trade liberalization among economic freedoms but also popular acceptance of limitations to political freedoms (Kurlantzick, Citation2016). These developments are harbingers of a reversal of expanding political and economic freedoms countries had been experiencing since 1980s, which was supported by the widely accepted belief that political and economic freedoms generate economic growth (Ashby & Sobel, Citation2008; Cebula, Citation2011, Compton et al., Citation2011; Hall & Lawson, Citation2014; Kešeljević & Spruk, Citation2013).
The idea of zero-sum economics from free trade is being embraced by some members of society (Ip, Citation2016). The debate then often turns to who gains and who loses. Generally speaking who benefits from changes in political and economic freedoms? How are various income groups affected? What is the impact of various freedom dimensions? Do countries with different levels of economic development experience different impacts of these changes? These are questions this paper addresses.
By seeking answers to these questions, this article contributes to the seemingly inconclusive research on globalization and income inequality, and more generally political economy freedoms and income inequality. This study expands on the literature by examining different dimensions of freedoms, as well as the level of economic development or income level. The Stopler-Samuelson theorem provides the theoretical foundation that globalization may worsen the income inequality, yet comprehensive empirical evidence is still lacking. Acemoglu and Ventura (Citation2002) examine the world income distribution depending on the degree of trade freedom. In subsequent analyses, while Zhou et al. (Citation2011) find evidence that globalization had a significant effect in reducing income inequality, Warner et al. (Citation2014) conclude that globalization does not contribute to inequality when measured in purchasing power parity. The evidence on the impact of other dimensions of economic and political freedoms than trade freedom is also inconclusive. This is considered an open question in the literature since the empirical evidence has been contradictory (Apergis et al., Citation2014; Bennett & Vedder, Citation2013; Bergh & Nilsson, Citation2010; Carter, Citation2007).
Several studies suggest that a comprehensive empirical analysis exploring the impact of various political and economic freedoms should consider differences in economic development across countries. Fadi et al. (Citation2014) found that income inequality was negatively related to economic growth in 55 low-income countries and positively in 56 high-income developing countries. Similarly, D’Elia and De Santis (Citation2018) focus on developed economies of OECD countries to examine the role of trade and financial freedom on income inequality. Using panel data of 78 developed and developing countries, Baek and Shi (Citation2016) found that income inequality would be reduced in developing countries and developed countries would see a worsening of income inequality.
Specific attention is given to the impact on middle classes. Middle class is an important group of consumers for multinational businesses. For many years, the business world was paying attention middle classes only in developed economies of North America, Western Europe, and Japan (Cavusgil & Kardes, Citation2013). However, the rise of middle class in emerging countries has been one of the most encouraging trends of the past few decades. Kandogan and Johnson (Citation2016) investigates the impact of changing political economy on middle classes in emerging countries through multinational business activities.
Different approaches are used in the literature to measure middle classes in international business such as the relativist method (Birdsall et al., Citation2000; Easterly, Citation2000) and the absolute approach (Banerjee & Duflo, Citation2007; Bhalla, Citation2009; Kharas, Citation2010). Considering the purpose of this study, in observing the changes in size of middle class across time, an absolute approach is taken. However, to observe how trade liberalization and changes in other dimensions of political economy affected the incomes of different classes, a relative approach is assumed. Following Sala-I-Martin (Citation2002), the World Bank’s micro household survey data is analyzed for 248 countries over 1988 to 2013. While most liberalization is in manufacturing sectors, its tariff rates have taken the main focus, all product tariff rates and trade freedom ratings, which include non-tariff trade barriers, are also considered in the analyses. Consideration is given to different levels of economic development to observe the impact of political and economic freedoms on various income levels.
2. Trade liberalization, political economy, economic growth and income inequality
Numerous studies have investigated the relationship between economic growth and economic freedom. A large body of this empirical research suggests a strong and positive impact of economic freedom on economic growth (Clark & Lawson, Citation2008; De Haan et al., Citation2006; Justesen, Citation2008; Scully, Citation2002; Williamson & Mathers, Citation2011). In particular, Gwartney et al. (Citation1999) argues that more market friendly institutions, more secure property rights, greater freedom of economic exchange and less government regulation facilitate innovation and entrepreneurship, which are the engines of economic growth. Similarly, Sachs and Warner (Citation1995) argue that efficient economic policies, open trade, and strong protection of property rights lead to higher-than-average growth rates. This widely accepted belief has shaped policies of many countries since 1980s.
The concept of economic freedom is not one dimensional. The reforms that countries implement for more economic freedom typically include establishing the rule of law, deregulation, privatization, and liberalization. The rule of law creates a business environment conducive to innovation and entrepreneurial activity with strong enforcement of property rights, and legal contracts without the hindrance of corruption and organized crime (Maskus, Citation2000; Murphy et al., Citation1993). Through deregulation, the goal is to achieve regulatory efficiency by removing legal restrictions to markets, normal business operations, and in the establishment of new ventures. Zahra et al. (Citation2000) shows that privatization transfers ownership from the state to private individuals, thus creates strong incentives for profits. The result is limited government through reduction in government spending and consequently less taxation. Liberalization reduces trade and investment barriers, resulting in open markets with cross border free flow of goods, services, and capital.
A key component of the political economy of a country is its political system. In contrast to economic freedom, the views in the literature on the role of political freedom on economic growth vary significantly. Sen (Citation1999) believes that economic development is a process of extending the real freedoms people enjoy, including political freedoms found in democracies. Consistently, Clague et al. (Citation1996) and Haggard (Citation1997) argue that democracies promote economic growth better than authoritarian ones since they create conditions conducive to growth through citizen participation. This contrasts with the popular Lee thesis, named after the former Prime Minister of Singapore, that authoritarianism helps rapid economic growth, based on the experiences of Singapore, South Korea, Taiwan, and most recently China. Consistently, Nelson and Singh (Citation1998) notes that political freedom could undermine the effectiveness of governments in maintaining law and order, hurting the economy.
Considering these opposite views, Barro (Citation1996, Citation1999) points out that the net effect of political freedom on economic growth is theoretically ambiguous. In particular, Barro (Citation1996) finds that a weak and slightly negative impact of democracy on economic growth that is conditional on the maintenance of the rule of law, free markets, small government consumption, and high human capital, which are typically generous political rights and civil liberties found in democracies.
Apart from economic growth, political economy of a country affects the income distribution within a country. However, there is even less clarity about its effects on income inequality. This is an open question with contradictory empirical evidence (Apergis et al., Citation2014; Bennett & Vedder, Citation2013; Bergh & Nilsson, Citation2010; Carter, Citation2007; Scully, Citation2002). There is also theoretical ambiguity concerning the effects of freedom on income distribution (De Soto, Citation2000). In addition, there are also questions about the direction of causality (Krieger & Meierrieks, Citation2016). Apergis et al. (Citation2014) suggest bi-directional causality between income inequality and freedom. They argue that high inequality decreases economic freedom through redistributive policies, and in turn, lower economic freedom increases inequality further.
Part of the ambiguity about this relationship can be resolved by recognizing the distinctiveness of the dimensions in political and economic freedoms. There is great awareness of the importance for economic growth of factors related to economic freedom, including the rule of law, security of property rights, openness of the political process, limitations on the power of the executive, monetary stability, liberal trade regimes, and civil liberties (Acemoglu et al., Citation2005). On political freedom side, Krieger and Meierrieks (Citation2016) find that autocratic regimes have no impact on income inequality, and argue that different societal groups, the rich, the middle class and the poor are interested in distinct levels of economic freedom. Specifically, they suggest that the rich are interested in less economic freedom to discourage competition from other societal groups.
When disintegrated, not all economic freedom dimensions seem to be related. Chu and Hoang (Citation2020) examines the relationship between this economic complexity and income inequality. Le Caous and Huarng (Citation2020) suggests that that economic complexity can be a negative predictor of income inequality. For example, Bergh and Nilsson (Citation2010) examine the impact of different dimensions on income inequality, and find a positive coefficient for freedom to trade, and regulation. The remaining dimensions do not seem to entail significant effects on income inequality. Consequently, Krieger and Meierrieks (Citation2016) suggests that the elite does not completely oppose economic freedom, as they are highly likely to benefit from certain economic freedoms such as sound protection of their property. In a slightly different conclusion, De Soto (Citation1989, Citation2000) argue that economic freedom removes legal barriers that protect politically favored groups and provides access to formal property rights necessary for the generation of capital and wealth. Hence, more economic freedom opens economic opportunities to less privileged and lower income individuals, thereby decreasing inequality. Gradstein (Citation2007) assesses the rule of law dimension of economic freedom, particularly the quality and integrity of the legal system and the protection of property rights. The results show a negative relationship, implying that a better legal system and protection of property rights are normally associated with lower income inequality. Economic freedom also means less redistribution via taxes and transfers. De Hann and Sturm (Citation2000), Sturm and De Haan (Citation2015) argue that less redistribution means limited government. To the extent that redistribution favors persons with lower incomes, economic freedom in this dimension decreases income inequality. Indeed, countries with larger welfare systems have lower income inequality as public sector transfers, and government services have a considerable redistributive nature (Esping-Anderson & Myles, Citation2011). Deregulation may also disproportionately benefit the talented middle class who can capitalize on the resulting opportunities (Sturm & De Haan, Citation2015). Muller (Citation2013) argues that inequality is an inevitable product of capitalist activity resulting from more economic freedom in the regulatory efficiency dimension since some are better able to exploit the opportunities. Hence, less regulation tends to increase income inequality. Kunawotor et al. (Citation2020) argue that quality of these economic freedom dimensions positively affect income inequality, particularly the rule of law.
Economic freedom further entails product markets open to international trade and labor markets open to equilibrium wages. Rajan and Zingales (Citation2003) argue that the rich may oppose liberal economic policies such as open markets through trade and financial liberalization because these would result in increased domestic and international competition, and thus threaten their market position. In respect to the financial side of open markets, Ang (Citation2010) highlights that financial liberalization seems to exacerbate income inequality. Baek and Shi (Citation2016) find that financial integration affects income inequality differently than trade intensity. The effect is in contrast across developed versus developing countries: Financial integration reduces inequality in developed countries yet increases it in developing countries. Within this context, Pillai (Citation2001) finds that freer cross-border investment created income inequality in low-income countries. Miller (Citation2001) has a similar result, and explains this by outsourcing, which is the main cause of decline of demand for unskilled workers. Alternatively, Jaumotte et al. (Citation2013) suggest that increase in inequality is due to technological changes while globalization plays a limited role. Considerable research has also been done on how open markets through trade liberalization affects income distribution. However, theoretical, and empirical literature on the effects of trade openness on inequality is inconclusive, as shown by Goldberg and Pavcnik (Citation2007) in their literature review. Basically, the theoretical foundation of the effect of trade liberalization on income inequality is based on the Stopler-Samuelson theorem. Accordingly, countries export products that use their abundant factors of production and import products that use the scarce factors. The rise in the relative price of an export good leads to a rise in the return to that factor which is used most intensively in the production of the good, and to a decrease in the return to the other factor. Consequently, trade freedom benefits the abundant factor owners, but hurts the scarce factor owners. Consequently, since labor and capital are abundant factors in developing and developed countries, respectively, trade freedom exacerbates income inequality in developed countries, but reduces it in developing countries.
The main distributive prediction of the theory depends on the relative weights and directions of trade flows. According to Davis (Citation1996), the distributive outcome of trade freedom can be the exact opposite of what Heckscher-Ohlin model predicts since a developing country may be abundant in unskilled labor in global terms, but this may not hold true in relation to other developing countries. This argument is particularly important for middle-income countries. International openness may facilitate technology diffusion from high-income countries to low- and middle-income countries; and it is also highly likely that the recent technologies are more skill intensive. If this is the case, then openness should imply a counter effect, namely an increase in demand for skilled labor, and thus an increase in income inequality (Lee & Vivarelli, Citation2004). Lastly, Heimberger (Citation2020) finds that open markets have a small-to-moderate inequality-increasing effect. However, while the effect of trade liberalization is small, financial liberalization shows a more sizeable and significantly stronger inequality-increasing impact.
3. Data and methodology
3.1. The middle and other classes
Cavusgil and Cavusgil (Citation2012) define the middle class as ‘salaried workers who do not own the means of production and whose major function in the social landscape is the reproduction of mainstay vitality of society, culture and capital’. In this way, middle class individuals typically have a comfortable lifestyle within their own country and have discretionary income above a level to meet their necessities. Several different approaches are used in the literature to measure this vague construct in international business.
A starting point is that the middle class is often considered in the middle of social stratification. Some researchers have taken a relativist method by defining people between 20th and 80th percentiles, or people with incomes between 0.75 and 1.25 times the median income as middle class (Birdsall et al., Citation2000; Easterly, Citation2000). Researchers taking an absolute approach tried to find an income range that applies across countries and time. Banerjee and Duflo (Citation2007) suggests daily incomes of $2–4 and $6–10 whereas Bhalla (Citation2009) sets a minimum of $3900 per year, which corresponds to approximately $11 per day. A World Bank study set the range between $10 and $50 per day. Kharas (Citation2010) defines the people with a daily income between $10 and $100 as middle class.
In building a construct, the purpose of the study should be central. Here, we are interested in both observing the changes in size of middle class across time, and to see how trade liberalization and changes in other dimensions of political economy affected the incomes of different classes. Accordingly, an absolute approach is taken for the first part of the analysis, and relative approach for the latter analysis. In studying the first, the lower and upper limits for incomes for middle class are those by Kharas (Citation2010). In studying the latter, 20th to 80th percentiles are divided further into three groups, as Cavusgil and Kardes (Citation2013) suggests that middle class is not homogeneous. Hence, the middle class is segmented to better identify the impact of political and economic freedoms. These are classified as low middle, mid middle, and upper middle classes. People in the bottom 20th percentile is considered as lower class, and those in the top 20th percentile as upper class.
The World Bank’s micro household survey is the source for data for the current study in computing size of middle class. Following Sala-I-Martin (Citation2002), household income distribution is obtained and inputted into PovCal software of the World Bank, which estimates the distributional parameters of a quadratic Lorenz curve. The proportion of the population in the middle class was obtained as the proportion of the population with expenditures below $100, and above $10 per day. These figures are in year 2005 constant US$ and therefore consider prices changes over the years and represent the same buying power during the period of analysis. These figures are also in purchasing power parity terms.
3.2. Average class income
To identify the impact on income inequality, numerous studies have used the Gini coefficient. However, Carter (Citation2007) points to some methodological weakness in the use of the Gini coefficient in these previous studies as well as considering the potential of a non-linear relationship. In the present article, the World Bank Poverty and Equity Database is used for average income levels for different classes. The database provides income share held by the lowest, 2nd, 3rd, 4th, and highest 20%. Average income in each class is computed by multiplying these shares with five, and by national income per capita in constant 2005 US$. The natural logs will be used to capture the non-linearity.
Out of 248 countries/regions, the poverty data is available for 157 of them for 1988 to 2013. For missing years in between two years with available data, extrapolation is done by assuming the same annual rate of change. One limitation to the number of observations in the analysis is economic freedom data, which starts in 1995. Consequently, there are 1602 country/year data points in the study. For each country/year, there are five observations from each class, resulting in a total of 8010 data points.
3.3. Tariffs
The primary objective of this article to assess how trade liberalization affects the income levels in different classes within and across countries. The overwhelming majority of liberalization has been implemented in form of tariff reductions, particularly in the manufacturing sector. In this study, both the manufacturing sector and all product tariff rates are considered. The data for both are weighted averages of applied tariff rates. The data are all in %s and obtained from the UN Comtrade database. Accordingly, the weights are the product import shares to each partner country, where the Harmonized System of trade at 6-digit level is used. Tariff line data were matched to SITC revision 3 codes to define the product groups and import weights. For years with missing tariff rates, data has been extrapolated using same annual rate increases between two years with available data. There is extremely limited sporadic data on non-tariff barriers, available only for recent years for few countries through UNCTAD’s TRAINS. Therefore, these are not part of the analysis. However, the trade freedom ratings are also considered under the economic freedom heading discussed below and includes both measures of tariff and non-tariff barriers to trade. A comparison of the results using tariff rates and the trade freedom ratings reveals how non-tariff trade barriers affect the results.
3.4. Political freedom
Another objective of this article is to assess the impact of political freedom on incomes of different classes. Since innovation and entrepreneurship require some degree of freedom as engines of economic development, political freedoms such as political rights and civil liberties provided in a country can explain the income level in a country. Data used to assess political freedom comes from the Freedom House, which has been available since 1972. They review actual practices in a country using sources such as news articles, reports from NGOs, academics, and professional contacts to assess rights and freedoms enjoyed by ordinary individuals rather than the elite upper classes. Accordingly, each country is assigned two ratings for political rights and civil liberties on a scale of 1 to 7, with 1 corresponding to highest degree of freedom. For political rights, this is given to countries that enjoy a wide range of political rights, including free and fair elections, political parties that are competitive, opposition that enjoys real power, and interests of minorities that are well represented. For civil rights, people in countries rated 1 enjoy freedom of expression, assembly, association, education and religion. In this study, these ratings are reversed so that an increase in the rating represents more freedoms in that country, which seems more intuitive when interpreting the results. Furthermore, due to high correlation between these two dimensions of political freedom at 0.913, principal component analysis is used to reduce them to only one dimension. The commonality measures for both are 0.955 and the KMO measure is significant at 0.5.
3.5. Economic freedom
Another focus of the article is assessing the impact of economic freedoms other than trade liberalization. The Heritage Foundation provides an annual rating of different dimensions of economic freedom. The literature studying the role institutions shaping economic activity mostly under Institutional Economics framework typically use these ratings or the World Governance Indicators (Kostova et al., Citation2020). WGI measures focus on the quality of governance. While the Fraser Institute ratings are like Heritage Foundation ratings, they are not frequently chosen.
Each rating is on a scale of 0 to 100, which 100 implying the highest freedom. They measure the economic freedom on ten factors grouped in four dimensions of economic freedom: rule of law, limited government, regulatory efficiency and open markets. In assessing all these dimensions, the sources of information include the Economist Intelligence Unit, the US Department of Commerce, US Department of State, various news articles and other reputable sources.
Within the rule of law dimension, the property rights component is an assessment of the legal system of a country for its freedoms to accumulate private property, protection of this property, and enforcement of these laws and contracts. A higher rating implies better guarantees of private property, more efficient and quicker enforcement of contracts, and less likely expropriation of private property. Alternatively, corruption, introduces risk, reduces economic vitality, and increases costs. As in the political freedom dimensions, factors within this dimension are also highly correlated at 0.835. To avoid bias in the results, they are reduced into one using principal component analysis. With commonalities of 0.917, and significant KMO measure of 0.5, the resulting variable captures the variations in the factors very well.
The limited government dimension assesses fiscal freedom and government expenditures. Fiscal freedom is a composite measure of indirect and direct, marginal, and overall taxation. Higher rating means less taxation, and less government spending in a country. Commonalities for these factors is 0.759 with KMO of 0.5 in the principal component analysis used to reduce these factors into one dimension due to high correlation of 0.519.
Business freedom is one of the factors considered under the regulatory efficiency. It is measure of government’s efficiency in regulating business, including procedures, time and cost associated with starting and closing a business and obtaining licenses. Another factor is monetary freedom, which is a measure of price stability including both inflation and price controls that distort the market activity. Principal component analysis reduced the remaining correlated factors into one dimension, where the communalities were 0.664 and the KMO measure was statistically significant at 0.5.
Two elements of the open markets dimension are investment freedom and financial freedom. Countries with no constraints on the flow of capital, where individuals are free to move their resources in and out of different investment options, internally and externally, are high in investment freedom. In financial freedom, the efficiency of the banking sector, and financial institutions’ independence from government are assessed. In the principal component analysis carried out between these highly correlated factors at 0.662, the communality is 0.831 with KMO of 0.5.
While trade freedom is considered under the open markets dimension, it is separately treated since the primary purpose of the analysis is to assess the impact of trade liberalization on classes’ incomes. This factor also considers non-tariff barriers in addition to tariffs introduced earlier. Non-tariff barriers include quantity, price, regulatory, investment, and customs restrictions that interfere with the free trade of goods and services. Therefore, in the analysis this trade freedom is also considered as a third alternative measure of trade liberalization in addition to manufacturing and overall tariffs.
In the analysis, a distinction is made about the level of economic development of countries because of the possibility that the impact of trade liberalization on different class’ income could vary with the level of economic development. World Bank classifications are used for this purpose, which groups countries into low-income (L), lower middle-income (LM), upper middle-income (UM), and high-income (H). While countries with GNI per capita in US$ of less than $545, between $546 and $2200, $2201 to $6000, and above $6000 are used to define L, LM, UM, and H groups, respectively, at the beginning of the period of analysis in 1988; these are increased to $1045, between $1046 and $4125, $4126 to $12,745, and above $12,745 respectively, in 2013. Accordingly, the countries can switch from one group to a different group due to economic growth experience during the period of analysis.
3.6. Methodology
provides the correlation matrix of variables considered. All the independent variables have the expected relationships with the average class incomes. Political freedom and various dimensions within economic freedoms increase the class incomes, as well as reductions in both manufacturing and all product tariffs. The only exception is the negative correlation between limited government and average class income, which suggests that more government involvement, particularly increased government expenditures positively impact incomes across classes. Further analysis is needed to explore this controlling for different classes and level of development across countries.
Table 1. Correlation coefficients.
These relationships are further analyzed using several regression models. Univariate OLS estimation methodology is applied. In the first set of preliminary models, the average class incomes are regressed against both manufacturing and all product tariffs. The models also included classes as variables as well as their interactions with the tariff rates, where the upper class is assumed as the reference point. Regressions are carried out in levels and log-log forms. This allows us to capture the impact of a 1 percentage point decrease in tariff on average incomes of classes in US$ terms. It then also explains by what percentage class incomes are affected because of 1% change in tariff rates.
In the second set of models, political and economic freedom dimensions are included in the study. These are also interacted with different classes. Each income class can then be compared to determine how each is affected differently in response to more political and economic freedoms. In these set of regressions, the impact of trade liberalization on average class incomes are assessed with manufacturing tariffs, all product tariffs, and the trade freedom dimension of economic freedom, separately.
In the last set of regressions, countries level of economic development is introduced to the models so that one can observe if the above factors affect class incomes differently for different levels of development. Only tariff rates for all products are utilized. These tariff rates and other freedoms are entered on their own and their interactions with different classes as in the second set of models. Furthermore, all these variables are interacted with the level of economic development of the countries.
4. Results and discussion
demonstrates how the size of middle classes have changed over time in countries of various levels of economic development. Countries are grouped according to 2004 World Bank definitions. The absolute approach is used in Kharas (Citation2010) to determine the middle class. Only the largest eight countries in each of the four country income categories are plotted.
Figure 1. Size of middle class in largest economies in different income categories.
ARG: Argentina, AUS: Australia, BRA: Brazil, CAN: Canada, CHL: China, COL: Colombia, DEU: Germany, ESP: Spain, ETH: Ethiopia, FRA: France, GBR: Great Britain, GHA: Ghana, IDN: Indonesia, IND: India, IRN: Iran, ITA: Italy, KAZ: Kazakhstan, MEX: Mexico, MYSL Malaysia, NGA: Nigeria, PAK: Pakistan, PHL: Philippines, POL: Poland, RUS: Russia, THA: Thailand, TUR: Turkey, UGA: Ugands, USA: Uganda, USA: United States, UZB: UZBEkistan, ZAF: South Africa.
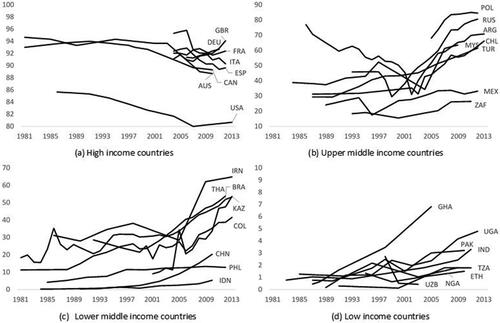
4.1. High-income countries
For most high-income countries, the size of middle class has been hovering above 90% of their population. When focusing on the period after 2004, only Germany, Netherlands and United Kingdom had significant increases in the middle class, ranging from 0.85 to 1.31%. For other countries, this has been less than 0.2%. Out of 25 high-income countries, 16 experienced decreases in the size of the middle class. The highest decreases were in Greece, Norway, Australia, Sweden, France, and Spain with 12.75, 7.51, 4.06, 3.07, 2.92, and 2.75%, respectively. While some of these may not be considered significant, the fact that these changes occurred in 9 years is noteworthy. When analysis is extended back, one notes that decreases have been more substantial with 6, 5, and 4% decreases in Australia, US, and Canada. Only Israel seems to have experienced a substantial increase of approximately 7% in its middle class. It is also noteworthy that while the shrinking of middle class started slowly in mid 1990s, there is a marked decrease in middle classes across high-income countries between 2003 and 2010.
4.2. High middle-income countries
Out of 29 in this group, 18 had significant increases in the size of their middle class. Countries that experienced changes in their political economy such as East European countries, particularly Russia, Argentina, experienced first sharp decreases in the size of their middle class, which grew rapidly once reforms were in place. For Venezuela, the political economy transformation took them backwards and experienced persistent decline over the years as the size of middle class decreased from 53% down to 30% in around 2000. Most other high middle-income countries started with sizes of middle class in 30–50% range in 1980s, and towards the end of period considered, their middle class expanded to about 60–90% range. The increase has been substantial: Chile from 29 to 66%, Panama from 28 to 59%, Turkey from 31 to 62%, and Malaysia from 39 to 64%. For Mexico and South Africa, the initial starting point was much lower to 20–25% of their population; and they experienced moderate increase in the size of their middle class. A noteworthy decrease has been for Hungary from 86% in 2006 to 81% in 2012. It is also interesting to note that for this group of countries, the significant increases occurred after early 2000s.
4.3. Lower middle-income countries
Lower middle-income countries also experienced significant increases in the middle class, mostly after early 2000s: a remarkable 39 out of 42 countries in this group. However, most of these countries had a much lower starting point than upper middle-income countries with 10–30% of their population in middle class at the beginning. East European transition countries in this group, such as Bulgaria, Belarus, Kazakhstan, had a similar experience as other transition countries. Other countries also had substantial increases: Tunisia from 12 to 66%, Thailand from 11 to 54%, and Brazil from 18 to 53%. Several other countries in this group had a much lower starting point with 0 to 10% of middle class. Cameroon increased from 4 to 6%, Congo from 3 to 4%, Indonesia from 0.2 to 5%, and Swaziland from 1 to 7%. Other countries with significant gains in the middle class include China from 0.3 to 20%, Guyana from 3 to 16%, and Honduras from 7 to 20%.
4.4. Low-income countries
These countries only had 0 to 5% of their population in middle-income class range at the beginning. While 30 out of 41 countries in this group experienced an expansion of their middle class, the change has not been substantial. Most successful increases were in Vietnam from 1 to 23%, Ghana from 0.4 to 7%, Mauritania from 3 to 11%, and Uganda 0.2 to 5%. There are also some notable decreases in middle classes in Kenya from 14 to 6%, and Ivory Coast from 25 to 6%.
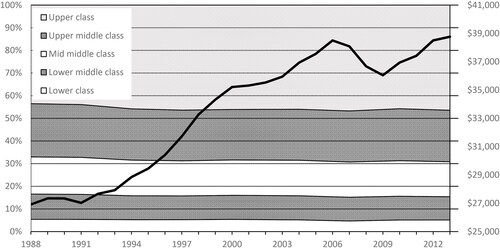
4.5. The evolving middle classes
It is worth taking a relative approach and analyze the changes incomes of the five quintiles: upper class, upper middle class, mid middle class, lower middle class, and lower class. This is illustrated in for the US, and further analyzed in regression models or all countries. Over the period of analysis, the per capita income in the US increased steadily from about $27K to about $40K except for recessions. The share of all classes went down except for the top 20%. In particular, share of lower class in national income went down from 5.4% in 1988 to 5.1%, second 20% from 11.1 to 10.3%, third 20% from 16.4 to 15.4%, fourth 20% from 23.5 to 22.7%. In contrast, the share of upper class increased from 43.5 to 46.4%. Interestingly all middle classes experienced nine consecutive years of decrease in their share from income. It is noteworthy that the lower class had seven consecutive years of decrease in its share from income between 2000 and 2007, and upper class experienced its largest decreases in income share during 2007–2010. These observations seem to indicate that the income inequality in the US has worsened. Note, however, that during this time, the US national income has increased, which suggests that while all classes observed an increase an income.
Figure 2. US net national income per capita and share of class quintiles.
4.6. Tariffs
provides the results of preliminary regressions. Note that in these regressions, all countries in the dataset are considered. In models (1) and (2), regressions are carried out in levels rather than log-log form. All coefficients are significant and about 20% of the variation in class incomes is explained by these models. For the upper class, 1% point decrease in manufacturing tariff increases incomes by $754, whereas the same decrease in all product tariffs increases incomes more, by about $923. The interaction variables show by how much the impact of these tariff reductions differ across classes. Note that the coefficients of all these interactions with other classes are positive, and significant.
Table 2. Impact of trade liberalization on average class incomes.
The magnitude increases as we move down towards lower income classes. These results suggest that while reductions in tariffs increases income levels across classes, the increases in US$ terms have been highest for upper class. In models (3) and (4), the model is in log-log form, all coefficients are again significant, and the explanatory power of the model increased to about 50% of the variation. Results reconfirm that tariff reductions increase incomes across classes: 1% decrease in manufacturing tariffs and all product tariffs increase incomes for the upper class by 0.86%, and 0.94%, respectively. The interactions of tariffs with other classes suggest that the impact of reductions in tariffs are higher for lower income quintiles in percentages. Considering all models, these suggest that tariff reductions increase incomes across all classes, but more in % terms for lower quintiles, and more in US$ terms for upper quintiles, leading to increased income inequality.
4.7. Political and economic freedoms
In models (5)–(7), presented in , further variables on political and economic freedoms other than trade liberalization are included. In models (5), and (6), liberalization is captured by manufacturing and all product tariffs, whereas in model (7), the trade freedom index from the Heritage Foundation is used, where a higher index means more trade freedom both lower tariff and non-tariff trade barriers. Hence, coefficients of opposite signs are expected when trade freedom index is used as opposed to tariffs. The results show that reduction in both tariffs and non-tariff trade barriers increase incomes, but a comparison to determine which is more effective is not possible since the measures are not on the same scale. Note first that the explanatory power of the regression models increased further to about 80% of the variation. It is also noteworthy that earlier results in the impact of trade liberalization across income classes are confirmed.
Table 3. Impact of political and economic freedoms on average class incomes.
The implications of other freedoms are consistent across the model regardless of how trade liberalization is captured. In particular, more political freedom increases all classes’ incomes. A 1% increase in political freedom increases income in upper class by 0.30–0.32%. The lower middle and lower classes benefit significantly less from more political freedoms. The impact of stronger rule of law on class incomes is much higher, by about 0.60–0.61%—not significantly different across classes. The same is also the case for regulatory efficiency and open markets, as more freedoms in these dimensions similarly affect classes. Specifically, regulatory efficiency increases incomes by 0.13–0.16%, much less than other freedoms, and the open markets (excluding trade freedom) dimension has no significant impact on incomes across classes. Interestingly, more freedom in the limited government dimension reduces incomes across classes, and that reduction becomes less for lower quintiles. This is consistent with Esping-Anderson and Myles (Citation2011) suggesting the welfare systems favor persons with lower incomes. The impact of less government involvement in the economy by 1% higher index in limited government dimension is a reduction by 0.15–0.20% in upper class average income, and by another 0.21–0.24% for the lower class.
4.8. Level of economic development
In model (6), presented in , all product tariffs represent the trade liberalization and variables are interacted with different levels of economic development of countries. The upper class in high-income countries is assumed to be the reference point, and coefficients representing the impact of various variables of the model are marked in bold. All other coefficients represent the variation of the impacts for different classes in countries of lower levels of economic development. Note that this model explains 93% of the variation. and plot the impacts of various political and economic freedoms on class incomes.
Figure 3. Impact of freedoms for varying levels of development.
L: Lower-income countries; LM: Lower middle-income countries; UM: Upper middle-income countries; H: High-income countries.
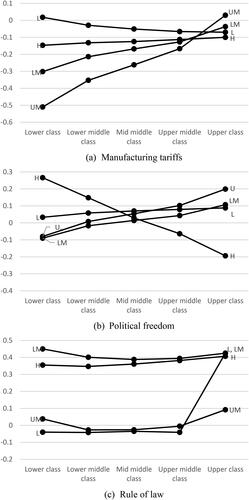
Figure 4. Impact of freedoms for varying levels of development – continued.
L: Lower-income countries; LM: Lower middle-income countries; UM: Upper middle-income countries; H: High-income countries.
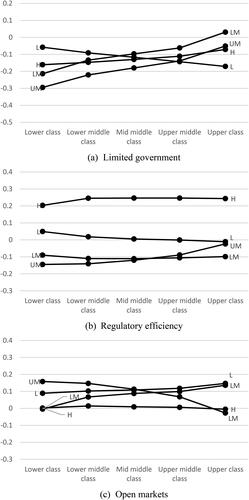
Table 4. Impact of freedoms on average class incomes for varying levels of development.
The results confirm the earlier models’ findings: Tariff reductions increase incomes across classes and countries of different levels of development. The impact in percentages is highest for lower classes in each group of countries. However, this difference across classes is not significant in high-income countries. Significant differences across classes are observed in upper and lower middle-income countries, where the impact of tariff reductions gets increasingly significant on lower quintiles. For low-income countries, there is no significant difference across classes.
Overall, tariff reductions have the most significant impact on lower and lower middle-income classes of upper middle-income countries and the lower class in lower middle-income countries.
More political freedom leads to higher incomes across classes in all countries with few exceptions. Political freedom does not have a positive impact in incomes of upper and upper and mid middle classes in high-income countries. As earlier, political freedoms’ positive impact on incomes is lower for lower quintiles for low-income, and lower and upper middle-income countries. In contrast, it is higher for lower classes in high-income countries.
As in earlier models, the impact of rule of law does not significantly vary across classes, except the upper class in low-income countries. This dimension of economic freedom only positively impacts lower middle- and high-income countries, and the upper class in low-income countries. The negative impact of limited government in incomes across classes is also observed when differences in level of development is controlled. As earlier, the negative impact is larger for lower quintiles in high-income and upper and lower middle-income countries. In contrast, in low-income countries, the negative impact is largest for the upper class. Regulatory efficiency is confirmed to have an impact on class incomes. However, its impact is most positive for high-income countries, insignificant for low-income countries, and negative for lower- and middle-income countries across classes. Earlier results are also confirmed for the impact of open markets on class incomes. Its impact is insignificant, and it does not vary across classes. However, it is significantly more positive for middle to upper classes in low and low middle-income countries.
5. Conclusions
The main focus of this article was to analyze the impact of free trade. The results are consistent with the large body empirical research on the positive impact on economic growth (Sachs & Warner, Citation1995). In particular, we show that this economic growth is experienced by all five quintiles of the societies that embraced open trade policies in all developed and developing countries.
The results show that the benefits are higher for lower quintiles in percentage terms. These higher percentage benefits of free trade to lower quintiles widens the inequality in dollar terms across income groups. This may be interpreted as support for Feenstra and Hanson (Citation1997) prediction of increasing income inequality. Furthermore, our results show that benefits of free trade across classes are highest for upper and lower middle-income countries than high-income countries.
There are larger differences between the lowest and highest quintiles in middle-income countries than in high- or low-income countries, where there is not much difference on the impact across groups. These findings suggest that free trade helps more in reducing the income inequality in middle-income countries than in high- and low-income countries, where its impact on income inequality is negligible. This finding provides partial support to the Stolper-Samuelson theorem. While the percentage increases for lower quartiles are not significant enough to close the income inequality gap, they are much higher in comparison to upper quartiles in developing countries. The potential cause of no impact on low-income countries is due to their lack of political economy reforms.
The results also show that excluding trade freedom, open markets with financial liberalization has no substantial differences in impact on income levels across classes. These results provide no support for Ang (Citation2010) suggesting exacerbating income inequality or Baek and Shi (Citation2016) suggesting reducing it for developed countries.
In other dimensions of economic freedoms such as rule of law and regulatory efficiency, there is no difference in their impact across different income classes in a country. This is consistent with both Krieger and Meierrieks (Citation2016) that suggests the elites benefit from protection of their property, and De Soto (Citation2000) who suggests that these dimensions provide economic opportunities to lower income individuals. The results show that limited government dimension of economic freedom reduces incomes for all classes, but more so for lower quintiles. This is in line with the arguments in Esping-Anderson and Myles (Citation2011) suggesting the welfare systems favor persons with lower incomes.
The main beneficiaries of political freedom in absolute terms are upper quintiles in middle-income countries and lower classes in high-income countries. It is insignificant in middle classes in high-income countries, and in the lower classes for upper and lower middle-income countries. Political freedom is interestingly negative on income levels of upper classes in high-income levels. Despite that exception, the impact of political freedom has been positive across income classes and countries supporting Clague et al. (Citation1996) and Haggard’s (Citation1997) suggestion democracies promote growth by creating conditions for participation of citizens across the board.
Limitations of this research stem from lack of available data on non-tariff trade barriers. These are more prevalent in services sector, and hence this research is more focused on liberalizations in the manufacturing sector. Availability of such data would enable future research that includes growing services sectors around the world. Another related limitation is the number of observations in the analysis is economic freedom data, which starts in 1995 and limits the period of analysis in this article. Future research could also use alternative sources of data for economic and political freedoms, as well as to dig deeper into the interplay among various dimensions of these freedoms.
Disclosure statement
No potential conflict of interest was reported by the author(s).
Data availability statement
The data that support the findings of this study are available from the following resources available in the public domain: The World Bank’s micro household survey: https://www.worldbank.org/en/programs/lsms. The World Bank Poverty and Equity Database: https://datacatalog.worldbank.org/dataset/poverty-and-equity-database. UN Comtrade database: https://comtrade.un.org/. Political freedom from the Freedom House: https://freedomhouse.org/. Economic freedom from the Heritage Foundation: https://www.heritage.org/index/
Additional information
Notes on contributors
Yener Kandogan
Dr. Yener Kandogan is Professor of International Business at the School of Management of the University of Michigan-Flint. He is also a faculty associate at the Center for Russian, East European and Eurasian Studies of the University of Michigan. He received his Ph.D. in Economics (International) from the University of Michigan in 2001. He has more than 30 academic publications in various international business and economics journals, including Journal of International Business Studies, Journal of World Business, International Business Review, Journal of Business Ethics, European Journal of International Management, Thunderbird International Business Review, Applied Economics, Review of International Economics, Journal of Economic Integration, and European Journal of Political Economy. He speaks French, and is native of Turkey.
Scott D. Johnson
Scott D. Johnson is professor emeritus of marketing at the University of Michigan-Flint where he earlier served as Dean of the School of Management. He received a Ph.D. in Marketing from Michigan State University and an MBA from the University of Minnesota. He is a member of Phi Beta Kappa. He has published in journals such as the Journal of Business Research, International Business Review, and the Journal of the Academy of Marketing Science. He has served on multiple peer review accreditation teams for AACSB International, served on the AACSB Continuous Improvement Review Committee, and served as President of the Midwest Business Deans Association (MABDA).
References
- Acemoglu, D., Johnson, S., & Robinson, J. (2005). Institutions as a fundamental cause of long-run growth. In Aghion, P., & Durlauf, S. (Eds), Handbook of economic growth (pp. 1–18). Elsevier.
- Acemoglu, D., & Ventura, J. (2002). The world income distribution. The Quarterly Journal of Economics, 117(2), 659–694. https://doi.org/10.1162/003355302753650355
- Ang, J. (2010). Finance and inequality: The case of India. Southern Economic Journal, 76(3), 738–761. https://doi.org/10.4284/sej.2010.76.3.738
- Apergis, N., Dincer, O., & Payne, J. (2014). Economic freedom and income inequality revisited: Evidence from a panel error correction model. Contemporary Economic Policy, 32(1), 67–75. https://doi.org/10.1111/j.1465-7287.2012.00343.x
- Ashby, N., &Sobel, R. (2008). Income inequality and economic freedom in the U.S. states. Public Choice, 134, 329–346. https://doi.org/10.1007/s11127-007-9230-5
- Baek, I., & Shi, Q. (2016). Impact of economic globalization on income inequality: Developed economies vs emerging economies. Global Economy Journal, 16(1), 49–61. https://doi.org/10.1515/gej-2015-0047
- Banerjee, A., & Duflo, E. (2007). What is middle class about middle classes around the world? MIT Department of Economics Working Paper 07-29, Massachusetts Institute of Technology.
- Barro, R. (1996). Democracy and growth. Journal of Economic Growth, 1(1), 1–27. https://doi.org/10.1007/BF00163340
- Barro, R. (1999). Determinants of democracy. Journal of Political Economy, 107(S6), S158–S183. https://doi.org/10.1086/250107
- Bennett, D., & Vedder, R. (2013). A dynamic analysis of economic freedom and income inequality in the 50 U.S. states: Empirical evidence of a parabolic relationship. The Journal of Regional Analysis and Policy, 43, 42–55.
- Bergh, A., & Nilsson, T. (2010). Do liberalization and globalization increase income inequality? European Journal of Political Economy, 26(4), 488–505. https://doi.org/10.1016/j.ejpoleco.2010.03.002
- Bhalla, S. (2009). The middle class kingdoms of India and China. Peterson Institute for International Economics.
- Birdsall, N., Graham, C., & Pettinato, S. (2000). Stuck in tunnel: Is globalization muddling the middle? Brookings Institution Working Paper 14, Washington, DC.
- Carter, J. (2007). An empirical note on economic freedom and income inequality. Public Choice, 130(1–2), 163–177. https://doi.org/10.1007/s11127-006-9078-0
- Cavusgil, S., & Cavusgil, E. (2012). Reflections on international marketing: Destructive regeneration and multinational firms. Journal of the Academy of Marketing Science, 40(2), 202–217. https://doi.org/10.1007/s11747-011-0287-9
- Cavusgil, S., & Kardes, I. (2013). Brazil: Rapid development, internationalization, and middle-class formation. Internext, 8(1), 1–16. https://doi.org/10.18568/1980-4865.811-16
- Cebula, R. (2011). Economic growth, ten forms of economic freedom, and political stability: An empirical study using panel data, 2003-2007. The Journal of Private Enterprise, 26, 61–81.
- Chu, L. K., & Hoang, D. P. (2020). How does economic complexity influence income inequality? New evidence from international data. Economic Analysis and Policy, 68, 44–57. https://doi.org/10.1016/j.eap.2020.08.004
- Clague, C., Keefer, P., Knack, S., & Olson, M. (1996). Property and contract rights in autocracies and democracies. Journal of Economic Growth, 1(2), 243–276. https://doi.org/10.1007/BF00138864
- Clark, J., & Lawson, R. (2008). The impact of economic growth, tax policy, and economic freedom on income inequality. Journal of Private Enterprise, 24, 23–31.
- Compton, R., Giedeman, D., & Hoover, G. (2011). Panel evidence on economic freedom and growth in the United States. European Journal of Political Economy, 27(3), 423–435. https://doi.org/10.1016/j.ejpoleco.2011.01.001
- D’Elia, E., & De Santis, R. (2018). Growth divergence and income inequality in OECD countries: The role of trade and financial openness. Italian Trade Study Group, Presented at Lecce, May 10–11, 2018.
- Davis, D. (1996). Trade Liberalization and Income Distribution. National Bureau of Economic Research Working Paper 5693.
- De Haan, J. & Sturm, J., (2000). On the relationship between economic freedom and economic growth. European Journal of Political Economy, 16, 215–241.
- De Haan, J., Lundström, S., & Sturm, J. (2006). Market-oriented institutions and policies and economic growth: A critical survey. Journal of Economic Surveys, 20(2), 157–191. https://doi.org/10.1111/j.0950-0804.2006.00278.x
- De Soto, H. (1989). The other path. Harper & Row.
- De Soto, H. (2000). The mystery of capital. Basic Books.
- Easterly, W. (2000). The middle-class consensus and economic development. Work Bank Policy Research Working Paper. 2346. Washington, DC.
- Esping-Anderson, G., & Myles, J. (2011). Economic inequality and the welfare state. In Nolan, B., Salverda, W., & Smeeding, T. (Eds), The Oxford handbook of economic inequality. Oxford University Press.
- Fadi, F., Rahnama, M., & Valcarcel, V. (2014). A refinement of the relationship between economic growth and income inequality. Applied Economics, 46(27), 3351–3361. https://doi.org/10.1080/00036846.2014.929624
- Feenstra, R., & Hanson, G. (1997). Foreign direct investment and relative wages: Evidence from Mexico’s maquiladoras. Journal of International Economics, 42(3–4), 371–393. https://doi.org/10.1016/S0022-1996(96)01475-4
- Goldberg, P., & Pavcnik, N. (2007). Distributional effects of globalization in developing countries. Journal of Economic Literature, 45(1), 39–82. https://doi.org/10.1257/jel.45.1.39
- Gradstein, M. (2007). Inequality, democracy, and the protection of property rights. The Economic Journal, 117(516), 252–269. https://doi.org/10.1111/j.1468-0297.2007.02010.x
- Gwartney, J., Lawson, R., & Holcombe, R. (1999). Economic freedom and the environment for economic growth. Journal of Institutional and Theoretical Economics, 155, 643–663.
- Haggard, S. (1997). Democratic institutions and economic policy. In Clague, C. (Ed), Institutions and economic development. John Hopkins University Press.
- Hall, J., & Lawson, R. (2014). Economic freedom of the world: An accounting of the literature. Contemporary Economic Policy, 32(1), 1–19. https://doi.org/10.1111/coep.12010
- Heimberger, P. (2020). Does economic globalization affect income inequality? A meta-analysis. The World Economy, 43(11), 2960–2982. https://doi.org/10.1111/twec.13007
- Immelt, J. (2016). After Brexit, global is local. Fortune, August 1.
- Ip, G. (2016). The rise of zero-sum economics. The Wall Street Journal, July 20.
- Jaumotte, F., Lall, S., & Papageorgiou, C. (2013). Rising income inequality: Technology, or trade and financial globalization? IMF Economic Review, 61(2), 271–309. https://doi.org/10.1057/imfer.2013.7
- Justesen, M. (2008). The effect of economic freedom on growth revisited: New evidence on causality from a panel of countries 1970-1999. European Journal of Political Economy, 24(3), 642–660. https://doi.org/10.1016/j.ejpoleco.2008.06.003
- Kandogan, Y., & Johnson, S. (2016). Role of economic and political freedom in the emergence of the global middle class. International Business Review, 25(3), 711–725. https://doi.org/10.1016/j.ibusrev.2015.02.005
- Kelvak, J., Livnat, J., Pei, D., & Suslava, K. (2018). Fake tariff news: Is corporate America concerned with trade war? Available at SSRN: https://ssrn.com/abstract=3207725
- Kešeljević, A., & Spruk, R. (2013). Endogenous economic freedom and the wealth of nations: Evidence from a panel of countries, 1996-2011. Applied Economics, 45(28), 3952–3962. https://doi.org/10.1080/00036846.2012.736948
- Kharas, H. (2010). The emerging middle class in developing countries. OECD Working Paper 285 Organization for Economic Cooperation and Development: Paris, France.
- Kostova, T., Beugelsdijk, S., Scott, W. R., Kunst, V., Chua, C. H., & van Essen, M. (2020). The construct of institutional distance through the lens of different institutional perspectives: Review, analysis, and recommendations. Journal of International Business Studies, 51(4), 467–497. https://doi.org/10.1057/s41267-019-00294-w
- Krieger, T., & Meierrieks, D. (2016). Political capitalism: The interaction between income inequality, economic freedom, and democracy. European Journal of Political Economy, 45, 115–132. https://doi.org/10.1016/j.ejpoleco.2016.10.005
- Kunawotor, M. E., Bokpin, G. A., & Barnor, C. (2020). Drivers of income inequality: Does institutional quality matter? African Development Review, 32(4), 718–729. https://doi.org/10.1111/1467-8268.12473
- Kurlantzick, J. (2016). Democracy is so 2005. Bloomberg Businessweek, June 6–12.
- Le Caous, E., & Huarng, F. (2020). Economic complexity and the mediating effects of income inequality: Reaching sustainable development in developing countries. Sustainability, 12(5), 2089. https://doi.org/10.3390/su12052089
- Lee, E. & Vivarelli, M. (Eds). (2004). Understanding globalization, employment, and poverty reduction. Palgrave Macmillan.
- Maskus, K. E. (2000). Intellectual property rights in the global economy. Institute for International Economics.
- Miller, T. C. (2001). Impact of globalization on U.S. wage inequality: Implications for policy. The North American Journal of Economics and Finance, 12(3), 219–242. https://doi.org/10.1016/S1062-9408(01)00053-5
- Muller, J. (2013). Capitalism and inequality. Foreign Affairs, 92, 30–51.
- Murphy, K. M., Shleifer, A., & Vishny, R. (1993). Why is rent seeking so costly to growth? American Economic Review, 83, 409–414.
- Nelson, M., & Singh, R. (1998). Democracy, economic freedom, fiscal policy, and growth in LCDs: A fresh look. Economic Development and Cultural Change, 46(4), 677–696. https://doi.org/10.1086/452369
- Pillai, A. (2001). Impact of political regime and economic openness on income inequality: A tale of low-income and OECD countries. The IUP Journal of Financial Economics, 9, 60–75.
- Rajan, R., & Zingales, L. (2003). The great reversals: The politics of financial development in the twentieth century. Journal of Financial Economics, 69(1), 5–50. https://doi.org/10.1016/S0304-405X(03)00125-9
- Sachs, J., & Warner, A. (1995). Economic convergence and economic policies. NBER Working Paper 5039.
- Sala-I-Martin, X. (2002). The world distribution of income (estimated from individual country distributions. NBER Working Paper 8933. National Bureau of Economic Research: Cambridge, MA.
- Scully, G. (2002). Economic freedom, government policy and the trade-off between equity and economic growth. Public Choice, 113(1/2), 77–96. https://doi.org/10.1023/A:1020308831424
- Sen, A. (1999). Development as freedom. Knopf.
- Sturm, J.-E., & De Haan, J. (2015). Income inequality, capitalism, and ethno-linguistic fractionalization. American Economic Review, 105(5), 593–597. https://doi.org/10.1257/aer.p20151112
- The Economist. (2016). Why Germans are protesting against free trade. September 15.
- Warner, D., Rao, D., Griffiths, W., & Chotikapanich, D. (2014). Global inequality; levels and trends, 1993-2005: How sensitive are these to the choice of PPPs and real income measures? Income and Wealth, 60, 281–304.
- Williamson, C., & Mathers, R. (2011). Economic freedom, culture, and growth. Public Choice, 148(3-4), 313–335. https://doi.org/10.1007/s11127-010-9656-z
- Zahra, S. A., Ireland, R. D., Gutierrez, I., & Hitt, M. A. (2000). Privatization and entrepreneurial transformation: Emerging issues and a future research agenda. The Academy of Management Review, 25(3), 509–524. https://doi.org/10.2307/259307
- Zhou, L., Biswas, B., Bowles, T., & Saunders, P. (2011). Impact of globalization on income distribution inequality in 60 countries. Global Economic Journal, 11, 1–16.