
 ?Mathematical formulae have been encoded as MathML and are displayed in this HTML version using MathJax in order to improve their display. Uncheck the box to turn MathJax off. This feature requires Javascript. Click on a formula to zoom.
Abstract
This study investigates the intricate relationship between violent criminal activities, temporal patterns, and land utilization across Selangor State, Kuala Lumpur Federal Territory (KLFT), and Putrajaya Federal Territory (PFT), Malaysia, spanning from 2015 to 2020. Employing the Hot Spot (Getis-Ord Gi*) technique within a GIS framework, the research contributes to data storage and map generation, enhancing the capabilities of entities such as the Royal Malaysia Police (RMP) and Local Authorities (LA) in addressing land use-related violent crimes. The analysis identifies four significant temporal hot spot intervals: midnight (12:00–6:59 a.m.), morning (7:00–11:59 a.m.), evening (12:00–6:59 p.m.), and night (7:00–11:59 p.m.). Central to this study delineates violent crime hot spots within the Kuala Lumpur Contingent Police Headquarters (KLCPH) encompassing 18 police stations and the Selangor Contingent Police Headquarters (SCPH) comprising 12 stations. These insights are crucial for law enforcement and urban planning authorities to target high-risk areas for preventive measures. Additionally, the research highlights the significant role of land use in influencing criminal behavior, particularly the association of violent crime hot spots with residential areas and transport infrastructures. By identifying specific areas where violent crimes are prevalent, this study aims to contribute to the development of tailored crime prevention strategies, fostering safer neighborhoods and enhancing public safety. Moreover, the research underscores the necessity of understanding the spatial distribution of criminal activity and its relationship with various land uses, guiding future policies and strategies aimed at mitigating crime and enhancing public safety in urban environments.
Introduction
This investigation transcends traditional crime analysis methods, which typically delineate police station (PS) areas as the primary unit for pinpointing crime hot spots. Instead, it adopts a more granular approach by utilizing point data within hot spots, offering a refined lens to scrutinize the interplay between violent crimes, PS boundaries, and land use. Traditional methodologies, focusing predominantly on hot spots within PS boundaries, often neglect the critical aspect of land use, thus failing to capture its integral role in crime genesis. Pioneering studies by Masron et al. (Citation2021) have predominantly employed PS boundaries or sectors for identifying Crime Hot Spots, yet they have overlooked direct consideration of land use. This oversight marks a significant gap in the current body of research, particularly within the Malaysian context. Moreover, prior investigations have predominantly concentrated on property crimes, with a glaring omission of violent crimes.
The absence of focused research on violent crime within Malaysia’s urban environments marks a significant oversight in existing literature. While previous studies have mainly focused on property crimes, the specific spatial and temporal aspects of violent crimes have received less attention. This study aims to fill this gap by incorporating land use considerations into the examination of violent crime patterns, thereby enhancing the field of crime analysis. Through advanced spatial analysis techniques, including the Hot Spot (Getis-Ord Gi*) method within a Geographic Information System (GIS), this research seeks to uncover the relationships between the occurrence of violent crimes and certain types of land use.
By identifying and analyzing the spatial clustering of violent crimes relative to land use categories, this research intends to provide insights that are crucial for law enforcement, urban planning, and policy-making. These insights are expected to lead to the development of targeted crime prevention strategies and community development projects that address the root socio-economic and environmental factors of violent crime. Essentially, this study contributes to a more informed approach to crime prevention and community safety in Malaysia’s primary urban areas.
This research makes a unique contribution by elucidating causal relationships between crime rates and various land use aspects, encompassing a wide spectrum from residential areas to transport and agricultural lands. By overlaying four distinct hot spot time frames—midnight, morning, evening, and night—with land use, the study aims to delineate the correlation between specific time frames, land use categories, and crime rates. Such insights are pivotal for guiding policymakers and law enforcement agencies in understanding criminal behaviors and patterns, thereby enhancing strategic planning and preventive measures.
The primary aim of this study is to investigate the spatial-temporal patterns of urban violence crime in the state of Selangor, Kuala Lumpur Federal Territory (KLFT), and Putrajaya Federal Territory (PFT), Malaysia, from 2015 to 2020. The specific research objectives are as follows: (i) To map out the spatial distribution of violent crime incidents across Selangor, KLFT, and PFT using sophisticated spatial analysis techniques, notably the Hot Spot (Getis-Ord Gi*) method within a GIS framework. (ii) To identify the timing of violent crime occurrences, dividing the day into distinct intervals (midnight, morning, evening, and night) and examining how crime rates vary throughout these times. (iii) To investigate the connection between areas of frequent violent crime and different types of land use, such as residential areas, business districts, and transportation hubs. (iv) To assess the importance of these areas of frequent violent crime in terms of their spatial concentration, intensity, and consistency over time. (v) To offer practical advice and recommendations for law enforcement, urban planners, and policymakers aimed at improving crime prevention methods and enhancing safety in Selangor, KLFT, and PFT. By achieving these objectives, the study aims to deepen understanding of urban violence dynamics and support the creation of focused interventions to reduce crime risks and improve public safety in Malaysia’s key cities.
This research is anchored on the premise of understanding the spatial clustering of violent crimes, characterized by their concentration in specific geographic locales at higher intensities than surrounding areas. Several factors contribute to this clustering, including neighborhood characteristics like poverty, unemployment, and residential instability, as posited by social disorganization theory (Liu et al., Citation2014). Additionally, the presence of potential crime attractors such as liquor stores or bars (Baker & Wolfer, Citation2003), and the existence of certain social networks are also influential (Harding, Citation2009). The study further explores the impact of contextual elements like limited social control, scarce resources, and a prevailing culture of violence on violent crime clustering.
The utilization of point data in conjunction with Hot Spot analysis (Getis-Ord Gi*) enables a nuanced understanding of violent crime’s spatial distribution and concentration relative to specific land use types. This approach affords law enforcement agencies, urban planners, and policymakers valuable insights to inform targeted strategies for crime prevention and community development, enhancing community safety and overall quality of life (Chainey, Citation2021; Chege et al., Citation2019; Cummings et al., Citation2019).
Methodologically, the study confronts the challenge of articulating the relationship between crime and the built environment, addressing the intricacies of spatial effects, appropriate analytical units, and the impact of scale and aggregation (Townsley, Citation2009). Point hot spots facilitate a more direct identification of land use in violent crimes. Despite a general downward trend in violent crimes in Malaysia (Mohd Hakim et al., Citation2019, Citation2022), attributed to proactive policing and government initiatives, there remains a discrepancy between recorded and actual crime rates (Sidhu, Citation2005). This discrepancy underscores the ongoing necessity for comprehensive crime studies.
This study highlights a notable knowledge gap concerning the efficacy of hot spot policing in directly addressing and mitigating property crime hotspots. Despite the abundance of literature on crime prevention strategies, a focused examination in this realm remains sparse (e.g. Braga, Citation2003; Braga et al., Citation2014, Citation2019; Duru & Akbas, Citation2021; Koper et al., Citation2021; Taylor et al., Citation2011; Taylor et al., Citation2022). The employment of Geographic Information Systems (GIS) in mapping crime incidents and conducting hotspot analysis by several researchers (e.g. Han et al., Citation2023; Mokhtar et al., Citation2023) has yielded valuable insights into crime patterns, shaping future research methodologies. Additionally, studies by Nix et al. (Citation2024) and Santos and Santos (Citation2021) underscore the significance of proactive policing on neighborhood-level crime rates, emphasizing the necessity for understanding its impacts across various crime types, including property crimes, to craft evidence-based policies (Jubit et al., Citation2020; Tavares & Costa, Citation2021).
The application of spatial analysis techniques and predictive modeling is posited to enhance crime prevention strategies and optimize resource distribution. The importance of temporal analysis in comprehending the dynamic nature of crime hotspots is highlighted by Jubit et al. (Citation2020) and Han et al. (Citation2023), while the amalgamation of GIS with advanced statistical methods in studies by Mokhtar et al. (Citation2023) and Nepomuceno and Costa (Citation2019) demonstrates the instrumental role of technology in crime mapping and analysis. The potential for technological advancements to augment crime forecasting and hotspot identification is a promising avenue for future research. Furthermore, Taylor et al. (Citation2022) have underscored the efficacy of community-infused problem-oriented policing (CPOP) interventions in crime reduction, advocating for the engagement of community members in problem-solving efforts, particularly in marginalized areas.
The intricate interplay between different crime types within hotspots, as shown in studies by Shiode et al. (Citation2022) and the specialization within property crime types documented by Felson et al. (Citation2022), underscores the complexity of crime dynamics and the necessity for targeted interventions. These interventions should account for the distinct characteristics of each crime type and the social conditions fostering them. Research in varied contexts is imperative for evaluating the applicability of these findings and refining urban crime analysis methods. Ceccato and Wilhelmsson (Citation2020) and Fenimore (Citation2019) have explored the socio-economic repercussions of crime hotspots, including their impact on property values and the spatial distribution of harm spots, further emphasizing the need for nuanced crime prevention strategies that address the socio-ecological processes underpinning crime patterns.
The relationship between violent crime with land use and spatial-temporal
Violent crime, as defined by the (Jabatan Perangkaan Malaysia, Citation2022a), involves incidents where victims are subjected to injury or threats of violence, encompassing acts like murder, rape, robbery, and assault. Another perspective, offered by Teivans-Treinovskis et al. (Citation2016), views violent crime as an offense where personal violence is not just a method but a central element in achieving the criminal objective. The nexus between violent crime and land use has garnered considerable attention in criminological circles, with numerous studies examining how various land use types and spatial-temporal factors influence the occurrence and distribution of such crimes (Sypion-Dutkowska & Leitner, Citation2017). A comprehensive understanding of this relationship is crucial for effective crime prevention and control strategies.
Recent research, including work by Tumbas et al. (Citation2023), underscores a significant correlation between land use patterns, violent criminal activity, and their spatial–temporal distribution. These studies reveal that specific land use characteristics can markedly impact the prevalence of violent crime in different locales. For instance, areas characterized by certain features – such as the prevalence of bars or liquor stores, high population densities, and economically disadvantaged neighborhoods – are often linked to elevated rates of violent crimes. This body of research provides valuable insights, suggesting that certain environmental and social conditions may serve as catalysts for violent criminal behaviors, thereby shaping the overall safety and security of communities.
According to Herrmann (Citation2015), the efficacy of hot spot analysis is significantly enhanced when it integrates spatio-temporal shifts within the crime analysis framework. The characteristics of crime hot spots, including their shape, size, and spatio-temporal patterns, undergo variations as the analysis narrows down to more precise geographic areas. Patterns in violent crimes, such as murders, shootings, and assaults, often reveal a weekly cycle, with lower occurrences during weekdays and a noticeable surge over the weekends. In contrast, robbery incidents display distinct temporal patterns, with weekdays witnessing higher frequencies and a decline observed during weekend periods. Notably, the timing and location of robberies, such as those near subway stations at 3:00 p.m. on school days versus 1:00 a.m. robberies on non-school days, underscore the importance of examining spatio-temporal shifts in understanding crime dynamics. This research on shifting hot spots endeavors to elucidate these patterns, aiming to enhance crime control measures and preventive strategies.
The work of Sun et al. (Citation2021) leverages spatial regression models to probe the relationships between land use, street connectivity, and the prevalence of violent crimes. Such studies deploy spatial analytical techniques to scrutinize crime patterns across diverse urban settings, including Vancouver, British Columbia. Investigations into the influence of neighborhood walkability on aspects such as housing values, foreclosures, and crime rates underscore the significance of neighborhood attributes. Furthermore, the spatial dynamics surrounding alcohol availability, neighborhood structure, and violent crime, as well as the use of eigenvector spatial filtering for crime mapping and analysis, have been explored. Environmental determinants like air pollution have been implicated in influencing criminal behaviors and ethical conduct. The correlation between casino presence, crime rates, and societal costs has also been examined, highlighting the broader social and economic ramifications.
Extant literature identifies a robust link between the density of alcohol outlets (AOD) and violent crime within urban neighborhoods, suggesting that AOD exacerbates community disadvantage and elevates the likelihood of violent incidents. Additionally, the concentration of abandoned or vacant properties has been correlated with higher instances of violent crime, alongside other social issues such as drug use and illegal activities. Nonetheless, the specific interrelationship between AOD and the prevalence of abandoned or vacant properties in relation to violent crime has received limited scholarly attention. The current study, conducted in Paterson, New Jersey, utilizing Geographic Information Systems (GIS) mapping and spatial analytical methods, substantiates the connection between AOD and abandoned properties as predictors of violent crime, even after adjusting for demographic variables. These findings advocate for the implementation of land-use policies that regulate the proliferation of alcohol-serving establishments and enforce zoning restrictions to mitigate alcohol access, thereby addressing adverse impacts on public health and community safety (Lardier et al., Citation2020).
Violent crime and land use
According to Cohen and Felson (Citation1979) routine activity theory, the occurrence of crimes is fundamentally influenced by the convergence of motivated offenders, suitable targets, and the absence of capable guardians within specific spatial and temporal contexts. The configuration of local land use plays a pivotal role in shaping the situational conditions conducive to criminal activities. They assert that it is the opportunities for crime, rather than the crimes themselves, that escalate when potential offenders and targets intersect in settings lacking effective guardianship. Empirical research, such as the studies by Quick et al. (Citation2019) and Weisburd et al. (Citation2012), has demonstrated a positive correlation between the spatial distribution of violent crime and non-residential land uses, notably in commercial and public transport areas.
The intricate interplay of mixed land uses has garnered significant attention from theorists and scholars across various disciplines (Inlow, Citation2021). Foundational research in this area has highlighted that crime is not uniformly distributed but tends to cluster in specific geographical areas (Ratcliffe, Citation2004; Sherman et al., Citation1989; Weisburd & Telep, Citation2014). Subsequent independent investigations have probed the relationship between violent crime and the density of residential and commercial land use (Browning et al., Citation2010; Inlow, Citation2021), underscoring the impact of land use planning on community development and environmental outcomes. Inadequate urban land use planning can precipitate social issues, such as drug abuse and criminal activities. Muhamad Ludin et al. (Citation2013) explored the spatial interconnection between drug abuse, criminal activities, urban land use planning, and their collective impact on communities, revealing a pronounced correlation between petty crime, drug abuse, and land use patterns, with a higher concentration of these activities in residential and commercial zones.
Furthermore, the relationship between crime, routine activity theory, land use, and urban form has been substantiated in various studies (Muhamad Ludin et al., Citation2013; Suryavanshi, Citation2001). Increased accessibility to facilities, particularly through public transport and major routes, escalates criminal activities as it amplifies the exposure of potential targets to motivated offenders (Demeau & Parent, Citation2018; Groff & Lockwood, Citation2014). Clouse (Citation2022) study on the built environment, land use, and crime in Las Vegas employed data across nine land use types and analyzed property and violent crime occurrences between 2018 and 2020 using Local Indicator Spatial Autocorrelation (LISA). The study found property crimes to be prevalent in transportation, resort, and institutional areas, while violent crimes were more common in public parks, restaurants, karaoke venues, and mixed residential areas. Additionally, the place and time at risk literature review by Brunsdon and Corcoran (Citation2022) emphasizes a discernible disparity between the types of crime and land use, highlighting the dynamic nature of crime patterns.
Violent crime and spatial-temporal
Valente (Citation2019) study delves into the trends of violent crime in Florianópolis, Brazil, illuminating how these crimes are not only concentrated in specific locales but also vary with the season, day, and time. This research establishes a linkage between the escalation of violent crime, organized crime, and the illicit drug trade. Focusing on street robberies and intentional homicides, the study utilizes data from the criminal analysis department to uncover that while street robbery incidents have risen, the overall rate of robberies has remained consistent. The study underscores the urgency for further exploration into the factors driving the surge in violent crime and its societal impacts.
In recent years, understanding the interplay between violent crime and its spatial-temporal dimensions has garnered increasing attention. Research, such as that by Kim et al. (Citation2021), indicates a predictable spatial-temporal pattern within crime “hot spots” – areas with notably high frequencies of violent crime. These hot spots demonstrate distinct tendencies in terms of when and where violent crimes occur (Crivellari & Ristea, Citation2021). Advanced analytical techniques have been employed in recent studies to delineate specific micro-spatial patterns within these hot spots, revealing their precise nature and distribution (Irandegani et al., Citation2019).
These insights have profound implications for the development of effective strategies to mitigate violent crime. A key takeaway from this body of research, as highlighted by Braga et al., (Citation2019), is that targeted policing efforts can substantially reduce violent crime rates in these hot spots without causing a spillover effect into adjacent areas. This finding suggests that law enforcement agencies can optimize their resource allocation by focusing on these hot spots with tailored interventions. Additionally, understanding the spatio-temporal dynamics of violent crime can significantly enhance police patrol strategies (Malleson et al., Citation2019).
The spatial-temporal analysis of violent crime has become a cornerstone of criminological research, as crime predominantly occurs at specific places and times (Luo, Citation2017). Researchers have increasingly focused on examining the spatio-temporal patterns of violent crime occurrences, thoroughly analyzing the spatial and temporal aspects to gain a comprehensive understanding of the nature of criminal activities. By identifying ‘hot spots’ or clusters where violent crime is concentrated, researchers have enabled more targeted interventions and preventive measures (Yang et al., Citation2021). This approach, known as hot spot policing, has been proven effective in significantly reducing violent crime rates by concentrating law enforcement efforts in high-crime areas (Braga, Citation2006).
Method
Study area
The focal region of this study encompasses Selangor State, Kuala Lumpur Federal Territory (KLFT), and Putrajaya Federal Territory (PFT) in Malaysia (refer to ). Selangor State, encircling KLFT, stands as the most populous state in Malaysia, boasting a significant economic footprint, particularly in the industrial and service sectors. Covering an area of 7,950.91 square kilometers (Ahmad et al., Citation2024a, Citation2024b; Jubit et al., Citation2022, Citation2023a), Selangor is home to a population of 6,994,423, yielding a density of 880 individuals per square kilometer and exhibiting a sex ratio of 113 males for every 100 females (Jabatan Perangkaan Malaysia, Citation2022a). KLFT, the nation’s capital and site of its largest airport, spans 243 km2 and is populated by 1,982,112 individuals, translating to a density of 8,157 per square kilometer. The sex ratio here is 115 males to 100 females (Jabatan Perangkaan Malaysia, Citation2022b). PFT, measuring 49.3 square kilometers, has a population of 109,202 and a density of 2,215 people per square kilometer, having replaced KLFT as the third Federal Territory in 1999 (Jabatan Perangkaan Malaysia, Citation2022c). Selangor State and KLFT were chosen for this study due to their notably high average index crime rate per 100,000 people from 2010 to 2017, accounting for 42.4% of all index crimes in that duration.
In contrast, Singapore exhibited a lower index crime rate of 431.3 per 100,000 people in 2016. Nevertheless, KLFT and Selangor have slightly surpassed Singapore’s index crime rates (Santhana Dass, Citation2019). The decision to use PS boundaries as the unit of analysis is driven by a desire to enhance the efficiency of violent crime hot spot prevention. Smaller units facilitate more focused and effective crime prevention analysis by law enforcement (Braga et al., Citation2012; Inlow, Citation2021; Weisburd & Telep, Citation2014). This research acknowledges the need for deeper understanding and exploration of the crime-built environment nexus, a multifaceted relationship shaped by city context, crime types, and socioeconomic conditions (Inlow, Citation2021).
Sampling
This quantitative study relies on secondary data, specifically violent crime data from 2015-2020 for Selangor State, KLFT, and PFT, provided by the Intelligence/Operations/Records Division, Criminal Investigation Department (D4), Bukit Aman. This dataset encompasses details such as crime addresses, incident times, and crime indexes. The dataset underpinning this study comprises a total of 57,275 police reports related to violent crime incidents in Selangor, Kuala Lumpur, and Putrajaya. As detailed in , the analysis of violent crime cases reveals a peak in reported incidents in 2017, with a total of 11,671 cases, accounting for 20.38% of the dataset. Conversely, the year 2020 registered the lowest number of incidents, with 8,008 cases, or 13.98% of the total dataset. A noticeable uptick in violent crime reports was observed in 2016 and 2017. However, from 2018 to 2020, there was a marked decline in violent crime cases, with decreases of 4.37%, 0.7%, and 1.33% respectively, cumulatively amounting to a reduction of 1,663 cases.
Table 1. Total violence and percentage in Selangor, Kuala Lumpur, and Putrajaya in 2015–2020.
The dataset encompasses eight distinct categories of violent crimes as defined under the Malaysian Penal Code. These categories include: murder (Section 302), causing injury (Sections 324, 325, and 326), rape (Section 376), unarmed robbery (Section 392), armed robbery (Sections 392/397), group robbery without firearms (Section 395), and group robbery with firearms (Section 395/397). This comprehensive categorization facilitates a nuanced analysis of violent crime trends and patterns within the studied regions, providing a solid foundation for subsequent investigations into the spatial-temporal dynamics and land use correlations with violent crime occurrences.
Data aggregation was conducted at the PS boundary level and subsequently mapped using ArcGIS software (ArcMap 10.8.2) (Ahmad & Masron, Citation2013; Ahmad et al., Citation2011, Citation2024c; Ariffin et al., Citation2024; Basiron et al., Citation2014; Jubit et al., Citation2023b; Marzuki et al., Citation2023; Mohd Ayob et al., Citation2013, Citation2014; Zakaria et al., Citation2023). Given the extensive population in Selangor State, KLFT, and PFT, the study utilizes PS boundaries within the Selangor Contingent Police Headquarters (SCPH), encompassing 87 PS, and the Kuala Lumpur Contingent Police Headquarters (KLCPH) with 24 PS (). Additionally, the study incorporates 13 land use characteristics, including water bodies, forests, industries, infrastructure and utilities, institutions and community facilities, open areas and recreational facilities, residential and housing, beaches, mixed development, transport and roads, trade and commerce, agriculture, and vacant land, to understand their influence on violent crime patterns (). The 2018 land use data for the Selangor state, KLFT, and PFT areas were sourced from the MyGDI Program (Malaysia Geospatial Data Infrastructure) of the National Geospatial Centre (NGC).
Figure 1. Police stations boundary for Selangor and Kuala Lumpur Contingent Headquarters.
Source: Data Collection/Analysis Division, Crime Prevention and Community Safety Department (CPCSD), Royal Malaysian Police Headquarters (RMP), Bukit Aman.
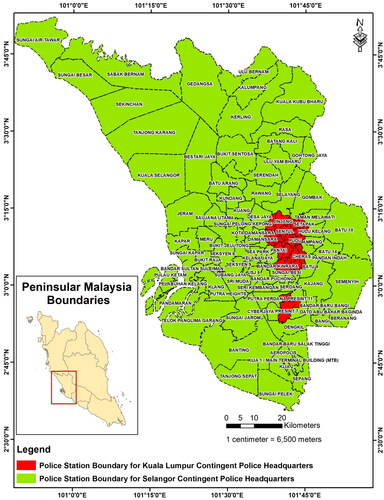
Figure 2. Landuse 2018 for the Selangor, KLFT and PFT areas.
Source: MyGDI program [Malaysia Geospatial Data Infrastructure].
![Figure 2. Landuse 2018 for the Selangor, KLFT and PFT areas.Source: MyGDI program [Malaysia Geospatial Data Infrastructure].](/cms/asset/c7290ae9-11bd-45a9-b6d1-3c7b39d155f1/oass_a_2347411_f0002_c.jpg)
According to , there are several stage in this research to be follow accordingly in order to complete this Violent Crime Analysis:
Figure 3. Methodology flowchart.
Source: Ahmad et al., Citation2024a.
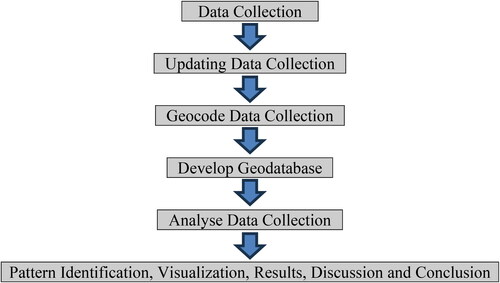
Data collection:
Obtain violent crime data from the Bukit Aman Police for the Selangor and Kuala Lumpur Contingent Police Headquarters in 2015–2020)
Updating data collection:
Updating and identifying police station boundary data for Selangor and Kuala Lumpur Contingent Police Headquarters
Updating information and identifying the location and address of crime
Updating information and identifying the date of the investigation paper, the date the crime started and the date the crime ended.
Updating information and identifying the time when the crime started and the time when the crime ended.
Geocode data collection:
Geocoding manually
Geocoding automatically using google sheet (geocode by awesome table and geocoding by smart monkey)
Develop geodatabase:
Developing a crime database (Geodata base).
Analyse data collection:
Crime data analysis.
Hot spot analysis (Getis-ord Gi*) is used to illustrate the spatial distribution of crime within certain areas by point data set.
The result from hot spot analysis, examines the spatial distribution of crime incidents in land use and identify by size for each size polygon.
Pattern identification, visualization, results and discussion:
Results and discussion
Conclusion
Spatial analysis
Hot spot analysis (Getis-Ord Gi*)
Spatial analysis, especially the application of Hot Spot Analysis using the Getis-Ord Gi* statistic, is pivotal in the field of crime analysis and mapping within a Geographic Information System (GIS) framework. This method is celebrated for its efficacy in revealing significant clusters of hot and cold spots in spatial data. The core of the Getis-Ord Gi* statistic is its computation of z-scores, crucial for identifying and measuring the intensity of spatial clustering. It evaluates each data point to ascertain whether it significantly contributes to a cluster of high values, thereby highlighting areas of concentrated crime activity. This analytical technique’s structured equations and thorough calculations not only ensure the reliability of the findings but also enhance the replicability of the study. The methodological rigor presented through this spatial analysis underscores the study’s contribution to understanding crime distribution and aids in formulating targeted interventions in Malaysia’s urban centers (Ahmad et al., Citation2024d).
The Getis-Ord Gi* statistic stands as a renowned instrument for crime analysis and mapping, extensively employed by crime analysts (Chainey & Ratcliffe, Citation2013; Gorr & Kurland, Citation2012). Its primary function involves the calculation of z-scores to identify and confirm the presence of significant hot and cold spots within a dataset (Gorr et al., Citation2018; Hashim et al., Citation2019). This analytical tool scrutinizes each feature within the dataset, evaluating whether it forms part of a cluster characterized by high values. For a feature to be classified as a statistically significant hot spot, it must not only possess a high value but also be situated amidst other features of high value (ESRI, Citation2022). The local Getis-Ord statistical equation, a fundamental component of this process, facilitates this precise calculation.
(1)
(1)
where n is equal to the total number of features, xj is the attribute value for feature j, wij is the weight of the space between features i and j, and:
(2)
(2)
(3)
(3)
The statistic is z-score, so no further calculations are required (ESRI, Citation2022; Muhamad Ludin et al., Citation2013). The Getis-Ord Gi* statistic hinges on a local statistical equation that accurately calculates this metric. This involves summing up the weighted differences of attribute values from their mean, considering the standard deviation of these attributes, and the total number of data points. These calculations yield a z-score, a standardized metric indicating whether a point is part of a statistically significant cluster of high (hot spot) or low (cold spot) values.
The equations for calculating the mean attribute value and the standard deviation (EquationEquations (2)(2)
(2) and Equation(3)
(3)
(3) are integral to determining the Getis-Ord Gi* statistic. These provide a foundation for a normalized assessment, allowing for an objective comparison of data points within the dataset. Through this method, the Hot Spot Analysis with the Getis-Ord Gi* statistic emerges as a rigorous approach for detecting spatial patterns of crime, offering critical insights for strategic decision-making in crime prevention and public safety enhancement.
Results
Violent crime and time
categorizes time into four segments: midnight (12 a.m.–6.59 a.m.), morning (7 a.m.–11.59 a.m.), evening (12 p.m.–6.59 p.m.), and night (7 p.m.–11.59 p.m.). Analysis of and reveals a temporal pattern in violent crime occurrences. The midnight slot records its peak at 1 a.m. with 2.82% of hot spots, descending to its lowest at 3 a.m. with 2.04%. In the morning timeframe, the apex is observed at 11 a.m. (5.42%), with the nadir at 7 a.m. (1.83%). For the evening, the highest incidence of violent crime is at 3 p.m. (5.94%), tapering off to 1.70% at 6 p.m. Nighttime sees its peak at 9 p.m. (5.65%) and descends to its lowest at 11 p.m. (3.77%). This indicates that the most prevalent time for violent crime is at 3 p.m., and the least is at 7 a.m.
Figure 4. Radar graph of the percentage of violence crime incidents in a 24-hour period.
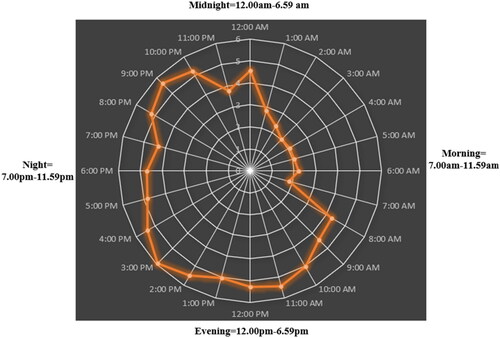
Table 2. Time frame classification of violence crimes 2015–2020.
These findings suggest a correlation between violent crime and higher temperatures, corroborating studies by Fullerton (Citation2022), Linning et al. (Citation2017), Linning et al. (Citation2017), Melo et al. (Citation2018). These studies elucidate the link between summertime indoor variations and the propensity for outdoor activities during warmer temperatures. This aligns with the routine activity theory, positing that individuals are more vulnerable to criminal targeting during periods of increased outdoor activity, away from the relative safety of their homes. Interestingly, the data also indicate a seasonal pattern in homicides, with higher occurrences in the summer months, a period characterized by heightened social interactions. This trend could be attributed to the heat-induced escalation in aggressive behaviors among individuals (Pereira et al., Citation2016), suggesting a nuanced interplay between climatic conditions and human interactions in the context of violent crime.
Hot spot Getis-Ord Gi*
The findings from preliminary studies, as outlined in , reveal that crime incidents are not uniformly distributed but are rather clustered in specific areas. This study conducted a spatial analysis of violent crime cases from 2015 to 2020 across various timeframes – midnight, morning, evening, and night – using the Getis-Ord Gi* method. This technique is adept at providing nuanced insights into the intensity and stability of hot and cold spot groupings (Anselin, Citation1995).
Table 3. The highest z-score hot spot for midnight, morning, evening and night from the year 2015 until 2020.
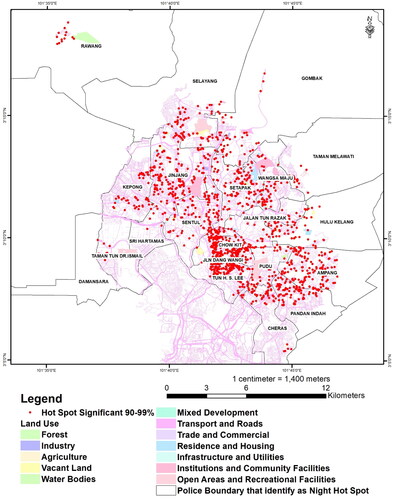
From the analysis, significant hot spots have been identified with high Z-scores. In Setapak, the highest midnight z-score was recorded at 3.69089100918, while the morning z-score stood at 2.87935119897. Taman Melawati exhibited an evening z-score of 3.55620059701, and Wangsa Maju had a night z-score of 3.28857049107. All four hot spots, predominantly located within the Kuala Lumpur Contingent Police Headquarters (KLCPH) and one in the Selangor Contingent Police Headquarters (SCPH), demonstrated 99% significance. Conversely, the lowest Z-scores were noted in Selayang during night (1.830226915) and morning (1.64587044137) periods, in Ampang during the evening (1.64587044137), and in Pudu at midnight (1.68641923385).
A hot spot point is defined as a specific area exhibiting the highest frequency of violent crime incidents throughout the year at a particular Police Station in both KLCPH and SCPH. The majority of violent crime incidents were concentrated in the center of the Kuala Lumpur Federal Territory (KLFT) and to some extent in the north and south of SCPH. The analysis of total violent crime hot spot locations/points across the four timeframes, as depicted in , indicates a fluctuating trend in the number of Police Stations involved. At midnight, 26 Police Stations (16 in KLCPH and 10 in SCPH) were involved, decreasing to 19 in the morning (9 in KLCPH and 10 in SCPH), slightly increasing in the evening to 29 (9 in KLCPH and 8 in SCPH), and rising again at night to 21 (13 in KLCPH and 8 in SCPH). This pattern underscores that KLCPH, despite its smaller geographical boundaries, emerges as a focal point and hot spot for violent crime across all four time categories, possibly attributed to its higher population density.
Jinjang Police Station (PS) in the District Police Headquarters (DPH) of Sentul exhibits a notably high prevalence of violent crime incidents at different times of the day, as reflected in and . Specifically, Jinjang PS records the highest significant percentage of incidents at midnight (13.86%), morning (20.57%), and evening (12.79%). In contrast, Jalan Dang Wangi Police Station in DPH Dang Wangi is predominantly associated with the night time frame, accounting for 14.14% of incidents.
Figure 5. Relationship between hot spot percentage and police boundary.
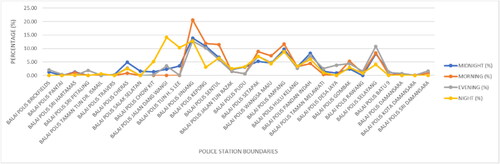
Table 4. Percentage of police station boundaries and hot spots for violence crimes 2015–2020 for four frame time categories.
These data are invaluable for law enforcement agencies and urban planners, providing them with critical insights into high-risk areas. With this knowledge, they can direct their focus and resources towards implementing targeted preventive measures in these identified hot spots. However, it is important to acknowledge a limitation in this approach: the analysis primarily concentrates on crime data and may not adequately take into account the various social and economic factors that contribute to criminal activity. This is a key reason for its widespread adoption among crime analysts.
Although hot spot analysis is an effective tool for examining the geographic distribution of crime, it is imperative that it is employed as part of a more comprehensive strategy. This should include an assessment of broader issues and contributing factors to crime trends. By integrating hot spot analysis with other analytical methods and considering the wider socio-economic context, a more holistic and effective approach to crime prevention and urban planning can be achieved.
Violent crime and land use
The analysis underscores that violent crime hot spots within the Kuala Lumpur Contingent Police Headquarters (KLCPH) encompass 18 police stations, including IPD Brickfields, Cheras, Dang Wangi, Sentul, and Wangsa Maju. Similarly, the Selangor Contingent Police Headquarters (SCPH) comprises 12 stations, such as Ampang Jaya and Petaling Jaya (refer to and ). This information is pivotal for law enforcement and urban planning authorities to pinpoint high-risk areas for targeted preventive measures.
Figure 6. Violence crime hot spot locations based on station boundaries according to four time frame categories (Midnight, 12 a.m.–6.59 a.m.).
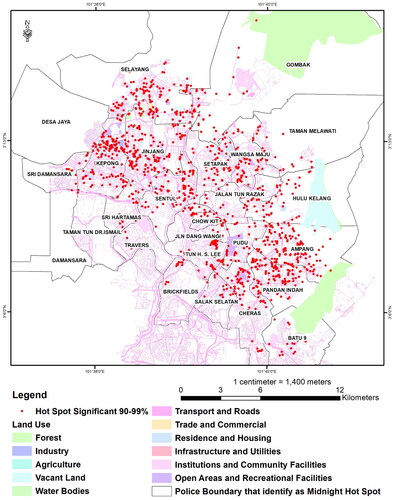
Table 5. Percentage of land use type and hotspot for property crime 2015–2020 for four time frame categories.
The study findings highlight that land use plays a significant role in criminal behavior. A substantial proportion of violent crime hot spots, especially during midnight, morning, and evening, are associated with residential and housing areas (32.25% at midnight, 35.18% in the morning, and 34.82% in the evening). Conversely, transport and roads land use predominates during nighttime, accounting for 32.01% of hot spots. This distribution pattern suggests that criminals often target residential areas and transport infrastructures for violent crimes. The lower percentage of hot spots in mixed land use areas might be attributed to their lesser prevalence in Selangor State, KLFT, and PFT ( and ).
At midnight, 26 police stations (16 from KLCPH and 10 from SCPH) were identified as significant hot spots, involving nine types of land use in the Jinjang Police Station area. These include industry, infrastructure and utilities, institutions and community facilities, open and recreational facilities, residential and housing, trade and commerce, transport and roads, vacant land, and water bodies ( and ).
In the morning, 19 police stations (9 from KLCPH and 10 from SCPH) are recognized as hot spots, again encompassing nine types of land use in the Jinjang Police Station area ( and ). During the evening, 29 police stations (16 from KLCPH and 12 from SCPH) are identified as hot spots. The Jinjang Police Station area, which records the highest hot spot percentage (12.79%), includes diverse land uses such as industry, infrastructure and utilities, institutions and community facilities, and others ( and ). At night, 21 police stations (13 from KLCPH and 8 from SCPH) are marked as significant hot spots. The Jalan Dang Wangi Police Station area, leading with 14.14%, includes various land uses like forest, infrastructure and utilities, institutions and community facilities, mixed development, and more ( and ).
Figure 7. Violence crime hot spot locations based on station boundaries according to four time frame categories (Morning, 7 a.m.–11.59 a.m.).
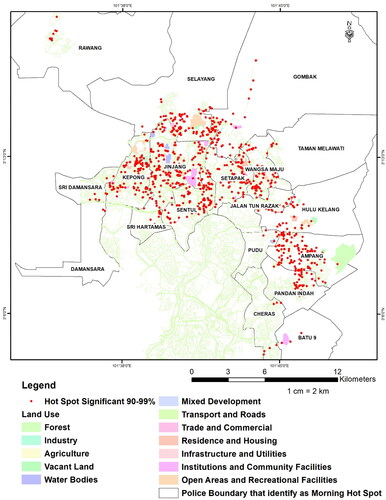
Figure 8. Violence crime hot spot locations based on station boundaries according to four time frame categories (Evening, 12 p.m.–6.59 p.m.).
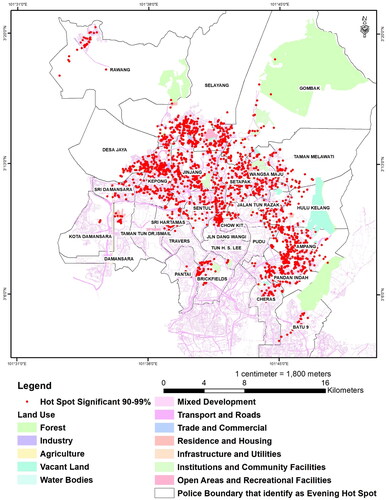
Figure 9. Violence crime hot spot locations based on station boundaries according to four time (Night, 7:00 p.m.–11:59 p.m.).
These findings are crucial for developing focused and efficient violent crime reduction programs. They underscore the need for law enforcement agencies to adopt strategic approaches, concentrating efforts on identified hot spots and adapting actions to specific locations. Additionally, understanding the spatial-temporal patterns of violent crime can guide more effective police patrol techniques. This comprehensive analysis of violent crime in relation to land use and its distribution across police station boundaries provides essential insights for law enforcement and urban planning in Malaysia.
This research aims to delineate the relationship between violent crime, land use, and their collective impact on safety and security within Selangor, Kuala Lumpur, and Putrajaya. One pivotal aspect of this study is the role of community policing and crime prevention activities in fostering a sense of safety and security among residents. The findings underscore the critical need for safety and security assessments tailored to specific locations and land use types. Such assessments are instrumental in shaping policy development and enhancing public safety initiatives, thereby improving overall public safety and reducing crime rates (Patalinghug et al., Citation2023).
The study also draws attention to the link between crime rates in Malaysia and various socio-economic factors, highlighting the importance of this relationship in the formulation of effective crime prevention policies (Zulkiflee et al., Citation2022). By identifying violent crime hot spots in relation to land use, the study aims to contribute to the development of efficient crime prevention strategies and the cultivation of safer neighborhoods. Crime risk maps, as a tool, can play a significant role in enabling law enforcement to focus their resources and efforts on specific high-risk areas.
Furthermore, the research reveals the uneven spatial distribution of criminal activity, which tends to cluster around specific land uses such as residential and housing areas, commercial centers, and transportation hubs. Ashby (Citation2019) studies in the realm of crime and geography emphasize that most crimes are concentrated in a small number of places, leaving the majority of other locations relatively crime-free. This pattern underscores the necessity to comprehend how different patterns of land use contribute to the formation of crime hot spots. Such insights are vital for informing crime prevention policies and practices. For instance, understanding the location of crime hot spots can guide decisions on strategic police placement. Additionally, a deeper knowledge of the relationship between certain land uses and crime hot spots can lead to more effective management of areas that potentially facilitate criminal activity. This research not only identifies specific areas where violent crimes are prevalent but also encourages a broader perspective on how land use influences crime patterns. This approach is crucial for guiding future policies and strategies aimed at mitigating crime and enhancing public safety in urban environments.
Discussion
The insights gleaned from this study carry significant implications for law enforcement agencies such as the Royal Malaysia Police (RMP) and Local Authorities (LA), as well as urban planners and policymakers engaged in crime prevention and land use management. The identification of spatial-temporal patterns in urban violence offers a critical lens for targeted intervention and resource allocation. Knowing the specific times and locations where urban violence peaks allows law enforcement to refine patrol strategies and focus resources on areas of highest need during critical periods. Similarly, Local Authorities can direct their efforts towards bolstering security and planning urban development in identified hotspots, enhancing safety measures and the overall quality of urban life (Fondevila et al., Citation2022; Towers et al., Citation2018).
The observed correlation between urban violence hotspots and specific land use types calls for an integrated approach to crime prevention that encompasses both public safety and urban planning. Recognizing how different land uses influence crime rates, policymakers and planners can implement design and policy strategies aimed at mitigating these risks. Actions such as improving public area lighting, enhancing surveillance, and encouraging mixed-use developments can deter criminal behavior by increasing the natural surveillance of public spaces and reducing opportunities for crime (Armitage & Gamman, Citation2009; Hart, Citation2021).
Furthermore, the persistence of certain hotspots underscores the necessity for ongoing collaboration between law enforcement, local authorities, and the community. Addressing deep-rooted issues like poverty, unemployment, and social instability requires long-term commitment, and a broad strategy that includes community policing, neighborhood improvement projects, and partnerships with local organizations. These efforts can help tackle the underlying causes of crime and build a stronger, more cohesive community fabric (Anderez et al., Citation2021; Rosenbaum, Citation1988).
The study’s findings underscore the importance of leveraging spatial-temporal analysis and understanding the interplay between urban violence and the built environment to craft effective crime prevention strategies. This approach can lead to more secure and resilient urban areas in Selangor, Kuala Lumpur, and Putrajaya. The study’s findings significantly contribute to our understanding of urban violence crime dynamics, affirming the hypotheses and offering profound implications for policy and practice. Each hypothesis underpins a critical aspect of urban violence and its prevention, showcasing the complex interplay between spatial–temporal patterns, land use, and crime prevention efforts (Kondo et al., Citation2018; Mohamad Ali et al., Citation2020).
Hypothesis 1: Spatial-temporal patterns of urban violence crime
The research robustly supports Hypothesis 1, illustrating that urban violence crime in Selangor, Kuala Lumpur Federal Territory (KLFT), and Putrajaya Federal Territory (PFT) is not uniformly distributed but exhibits clear spatial–temporal patterns. The identification of specific hot spots where urban violence crimes cluster at different times—midnight, morning, evening, and night—empowers law enforcement and local authorities with empirical evidence to strategically allocate resources and implement interventions. This pattern recognition facilitates a more efficient and targeted approach to crime prevention, underscoring the importance of understanding crime dynamics within the urban fabric.
Hypothesis 2: Correlation between urban violence and land use
The validation of Hypothesis 2 highlights the significant correlation between the spatial distribution of urban violence crimes and specific land use categories. The findings reveal that residential areas are predominantly affected during nighttime, whereas transportation and roads witness higher crime rates at night. This correlation emphasizes the influential role of the built environment in shaping criminal activity. By recognizing these patterns, urban planners and policymakers are better equipped to design and implement land use and urban design strategies that can effectively deter crime in susceptible areas, showcasing the potential of environmental design in crime prevention.
Hypothesis 3: Development of crime prevention strategies
The strong support for Hypothesis 3 demonstrates the efficacy of identifying urban violence crime hot spots in developing evidence-based crime prevention strategies and enhancing community safety initiatives. Through spatial-temporal analysis, law enforcement, local authorities, and policymakers can focus their efforts and resources on the most affected areas, thereby optimizing the impact of their crime prevention measures. Moreover, the emphasis on community engagement and collaboration across agencies highlights the necessity for a multi-faceted approach to tackle the root causes of urban violence, fostering safer and more cohesive neighborhoods.
The confirmation of these hypotheses offers valuable insights into the dynamics of urban violence crime and its intricate relationship with the built environment. The study not only advances our understanding of effective crime prevention strategies but also underscores the importance of integrating spatial-temporal analysis and land use planning in policy decisions. By examining the patterns of urban violence and its associations with land use, the research informs a strategic approach to urban planning and crime prevention, aiming to enhance the safety and well-being of communities in Malaysia’s major urban areas.
Limitations or biases of using hot spot analysis (getis-ord gi*)
The employment of Hot Spot Analysis (Getis-Ord Gi*) alongside land use evaluations encounters inherent limitations and biases primarily due to the accuracy and comprehensiveness of the crime data utilized. Variabilities in crime reporting mechanisms, methodologies of data collection, and the disparities in reporting standards across various jurisdictions might embed biases in the outcomes. The dependency on data reported by law enforcement may not account for crimes that go unreported or are underreported, thus obscuring the actual scope of violent crime occurrences (Bachman, Citation2015; Buil-Gil et al., Citation2022). The analysis of spatial scale bias, which concentrates on the precincts of police stations as the principal spatial units, may not adequately reflect the true spatial patterns of crime. Differences in patrol strategies by the police, their reporting procedures, and the demarcations of jurisdictional boundaries could affect the identification of crime hot spots, potentially introducing spatial scale biases (Braga et al., Citation2017; Chainey et al., Citation2008).
In exploring violent crime trends over varied time periods, the temporal granularity of the analysis (e.g. hourly divisions) might fail to discern subtle temporal shifts in crime rates. Influences such as seasonal changes, variations by day of the week, and specific events, which could significantly impact crime trends, may not be fully integrated into the analysis (Boldt & Borg, Citation2016; Cai & Shi, Citation2021; Towers et al., Citation2018). The process of categorizing land use within the analysis could be influenced by subjective interpretations or oversimplifications. Discrepancies in the definitions of land use, the frameworks used for classification, and the sources of data might inject biases into the evaluation of the nexus between land use and violent crime (Matijosaitiene et al., Citation2018; Stucky & Ottensmann, Citation2009). Although this investigation delineates violent crime hot spots at an aggregate level, it is imperative to tread cautiously in associating specific characteristics or behaviors to individuals within these locales. The ecological fallacy, which occurs when group-level conclusions are inappropriately attributed to individuals, may lead to erroneous causal interpretations (Braga et al., Citation2017, Citation2019; Fitzpatrick et al., Citation2019; Lee et al., Citation2017). The analysis might also be affected by spatial autocorrelation, a phenomenon where adjacent areas display similar crime patterns, potentially distorting the outcomes of the spatial analysis. Neglecting spatial dependency in statistical models can result in overstated significance levels or skewed estimates (Ahmar et al., Citation2018; Jafarzadegan et al., Citation2023).
Focusing on the regions of Selangor, Kuala Lumpur, and Putrajaya might constrain the extrapolation of these findings to different settings. Socio-economic, cultural, and demographic variances among urban environments can alter the spatial–temporal distribution of violent crime, warranting caution in generalizing the results beyond the studied locales (Andresen & Linning, Citation2012; Grubesic & Mack, Citation2008; Mohamad Ali et al., Citation2020). Addressing these limitations and biases necessitates meticulous attention to the quality of data, methodological precision, and the context within which the research is conducted. Implementing sensitivity analyses, conducting robustness assessments, and corroborating findings with alternative datasets can augment the robustness and credibility of these findings. Furthermore, an open acknowledgment of these constraints within the manuscript not only upholds academic integrity but also fosters a deeper comprehension of the study’s implications.
Future research, policy implications, and practical applications
For future studies, the methodology could be refined in several key areas:
Longitudinal studies: Implementing longitudinal studies to trace the evolution of violent crime patterns over extended periods could unveil significant insights into the mechanisms propelling crime, fluctuation trends, and the steadfastness of crime hotspots. This approach is pivotal for evaluating the impact of crime deterrence measures over time (Farrington, Citation1988; Wang & Zhang, Citation2020; Zane, Citation2020).
Granular spatial examination: Delving into crime patterns at more granular spatial levels, such as individual street segments or census tracts, may expose intricate local variations in crime rates and hotspot dynamics. This detailed analysis facilitates the crafting of precise intervention strategies and enriches our comprehension of risk factors at the micro level (He et al., Citation2020; Malleson et al., Citation2019; Tom-Jack et al., Citation2019).
Multivariate analysis: Utilizing multivariate models to concurrently evaluate the impact of various socio-economic, demographic, and environmental influencers on violent crime can offer a holistic perspective on crime causation. This integration of spatial data with sophisticated statistical models is essential for deciphering the complex interplay of factors affecting crime trends (Lewis & Carton, Citation2022; Pratt & Cullen, Citation2005; Sampson & Lauritsen, Citation1994; Wang & Zhang, Citation2020).
Cybercrime detection with advanced technologies: The application of machine learning and image processing for cybercrime detection represents a burgeoning area ripe for exploration, signifying an opportunity to refine detection and prevention methodologies in this rapidly evolving domain (Jujjuri et al., Citation2022).
Innovative crime analytics platforms: Developing platforms that process and analyze newsfeed data for various crimes, pinpointing hotspots through kernel density estimation (KDE), underscores the critical role of real-time, precise crime forecasting in enhancing public safety and quality of life. Such platforms, equipped with interactive visualization tools, can revolutionize how law enforcement agencies forecast crime and perceive the nexus between crime and geography, as demonstrated in studies like Prathap and Ramesha (Citation2020).
Policy implications
To translate research findings into actionable insights, policy recommendations are categorized into three areas:
Targeted policing strategies: The insights gleaned from research can guide law enforcement in allocating resources efficiently and implementing focused policing tactics in areas identified as violent crime hotspots. Emphasizing proactive patrols, community involvement, and partnership-building can fortify crime prevention and elevate safety (Braga et al., Citation2014; Fennelly et al., Citation2020; Taylor et al., Citation2022).
Urban planning and design: Insights from these studies should inform urban planners and policymakers in integrating crime prevention through environmental design (CPTED) principles into urban layout and development projects. Such strategic planning can deter criminal activities and foster communal well-being (Bai et al., Citation2017; Cozens & Love, Citation2017; Knapp, Citation2013).
Social Intervention Programs: Complementing law enforcement efforts with social intervention programs that tackle socio-economic inequalities, bolster community ties, and offer support to vulnerable groups can address the root causes of crime. These programs are crucial for achieving sustainable reductions in violence (Haim et al., Citation2021; Lane & Henry, Citation2001; Rosenbaum, Citation1988).
Practical applications
To ensure the application of research findings in real-world settings, several practical measures are proposed:
Crime Mapping and Decision Support Systems: Crafting interactive crime mapping tools and decision support systems can assist stakeholders in visualizing crime hotspots, discerning trends, and strategizing interventions. These tools are vital for informed decision-making and fostering stakeholder collaboration (Mohd Shamsuddin et al., Citation2017; Wang, Citation2012).
Community Engagement and Empowerment: Launching community engagement initiatives like neighborhood watch programs and community policing can empower residents to actively contribute to crime prevention and neighborhood safety. Establishing trust and partnerships between the police and communities is fundamental to effective crime prevention (Rosenbaum, Citation1988; Soska & Ohmer, Citation2018).
Enhanced Training and Capacity Building: Providing education and capacity building for law enforcement, urban planners, and community stakeholders on crime analysis, prevention strategies, and collaborative problem-solving can amplify the abilities of local bodies to tackle violent crime efficiently (Guerette et al., Citation2021; Hunt, Citation2019).
Conclusion
The utilization of Geographic Information Systems (GIS) applications and spatial analysis has proven to be instrumental in identifying hot spots for violent crimes, particularly in relation to land use. This methodology is invaluable for organizations like the Royal Malaysian Police (RMP) and local authorities, as it provides critical insights for strategic planning and enforcement measures aimed at upholding public peace and order. Key areas of focus should include urban land uses like residential and housing areas, commercial and trade zones, and transport and road networks. Law enforcement agencies and city planners can leverage this data to pinpoint high-risk areas and implement targeted preventative measures. Efficient resource management, encompassing personnel, assets, and energy, becomes more feasible and sustainable with this approach. By precisely locating crime hot spots, law enforcement can prioritize areas requiring immediate attention and refine patrolling techniques for greater effectiveness. The challenge of identifying these hot spots has gained significant attention recently, highlighting the importance of tactical interventions.
One such proposed intervention for authorities like the RMP is to increase patrols in identified hot spots, especially during periods of increased vulnerability such as festive seasons or extended school holidays. During these times, residential areas and commercial premises are particularly at risk. Patrols conducted using Mobile Vehicle Units (MVU) and Motorized Patrols Units (MPU) can effectively cover these areas. Recognizing the correlation between land use and crime rates is crucial for policymakers and decision-makers. This understanding enables the implementation of focused interventions and policies aimed at enhancing urban safety. By addressing the spatial dynamics of crime, cities and communities can be developed into safer, more secure environments, ultimately contributing to the well-being and peace of residents. The findings of this study underscore the potential of spatial analysis in crime prevention and urban planning, offering a roadmap for future efforts to create safer urban landscapes.
Authors contribution
The Conception and Design: Azizul Ahmad & Yoshinari Kimura. Analysis and interpretation of the data: Azizul Ahmad & Syahrul Nizam Junaini. The drafting of the paper: Azizul Ahmad & Norita Jubit. Revising it critically for intellectual content: Mohd Sofian Redzuan, Asykal Syakinah Mohd Ali & Luqman Haqim Bismelah. The final approval of the version to be published: Tarmiji Masron & Mohamad Hardyman Barawi all authors agree to be accountable for all aspects of the work.
Disclosure statement
The authors declare that they have no conflict of interests.
Data availability statement
Data available on request due to privacy/ethical restrictions.
The data is confidential of Government of Malaysia under Royal Malaysian Police (RMP).
Additional information
Funding
Notes on contributors
Azizul Ahmad
Azizul Ahmad is a postgraduate student of Geographic Information System (GIS) at Centre for Spatially Integrated Digital Humanities (CSIDH), Faculty of Social Sciences & Humanities, Universiti Malaysia Sarawak.
Tarmiji Masron
Tarmiji Masron is a professor of Geographic Information System (GIS) at Centre for Spatially Integrated Digital Humanities (CSIDH), Faculty of Social Sciences & Humanities, Universiti Malaysia Sarawak.
Yoshinari Kimura
Yoshinari Kimura is a professor of Geographic Information System (GIS) at Graduate School of Literature and Human Sciences, Osaka Metropolitan University.
Mohamad Hardyman Barawi
Mohamad Hardyman Barawi is a senior lecturer of Computational Linguistics and Artificial Intelligence at Faculty of Cognitive Science and Human Development, Universiti Malaysia Sarawak.
Norita Jubit
Norita Jubit is a senior lecturer at the Borneo Institute for Indigenous Studies (BorIIS), Universiti Malaysia Sabah (UMS).
Syahrul Nizam Junaini
Syahrul Nizam Junaini is a senior lecturer at the Faculty of Computer Science and Information Technology (FCSIT), Universiti Malaysia Sarawak.
Mohd Sofian Redzuan
Mohd Sofian Redzuan is a postgraduate Student of Geographic Information System (GIS) at Centre for Spatially Integrated Digital Humanities (CSIDH), Faculty of Social Sciences & Humanities, Universiti Malaysia Sarawak.
Asykal Syakinah Mohd Ali
Asykal Syakinah Mohd Ali is a postgraduate student of Geographic Information System (GIS) at Centre for Spatially Integrated Digital Humanities (CSIDH), Faculty of Social Sciences & Humanities, Universiti Malaysia Sarawak.
Luqman Haqim Bismelah
Luqman Haqim Bismelah is a postgraduate Student of Geographic Information System (GIS) at Centre for Spatially Integrated Digital Humanities (CSIDH), Faculty of Social Sciences & Humanities, Universiti Malaysia Sarawak.
References
- Ahmad, A., Mohd Ayob, N., & Abdul Majid, A. (2013). Regional carrying capacity (RCC) issues Langkawi Islands, Kedah. In B. Mohamed & A. Bahauddin (Eds.), Proceedings of International Conference on Tourism Development: Building the Future of Tourism, Penang, Malaysia, 4 & 5 February 2013 (pp. 58–72). Sustainable Tourism Research Cluster, Universiti Sains Malaysia. https://www.researchgate.net/publication/329084336_Regional_Carrying_Capacity_RCC_Issues_Langkawi_Islands_Kedah
- Ahmad, A., Masron, T., Osman, M. A., Mohammed, B., & Marzuki, A. (2011). Initial studies on web based tourism decision support system (WBTDSS) case study: Langkawi Island, Kedah. In A. Bahuddin (Ed.), Proceedings of 2nd Regional Conference on Tourism Research: Venturing into New Tourism Research. University Conference Hall, USM Penang (pp. 344–359). Sustainable Tourism Research Cluster (STRC), Universiti Sains Malaysia. https://www.semanticscholar.org/paper/Initial-studies-on-web-based-tourism-decision-case-Ahmad-Masron/ed8ee1cdad4caf130964be266ebc6453a50529fe
- Ahmad, A., & Masron, T. (2013). Aplikasi Sistem Maklumat Geografi (GIS) dalam Menganggar Keluasan Petempatan Awal di Tapak Arkeologi Lembah Lenggong, Hulu Perak, Perak, Malaysia. Jurnal Perspektif: Jurnal Sains Sosial Dan Kemanusiaan, 5(1), 19–38. https://myjurnal.mohe.gov.my/public/article-view.php?id=78703
- Ahmad, A., Masron, T., Jubit, N., Redzuan, M. S., Soda, R., Bismelah, L. H., & Mohd Ali, A. S. (2024a). Analysis of the movement distribution pattern of violence crime in Malaysia’s capital region-Selangor, Kuala Lumpur, and Putrajaya. International Journal of Geoinformatics, 20(2), 11–26. https://doi.org/10.52939/ijg.v20i2.3061
- Ahmad, A., Masron, T., Ringkai, E., Barawi, M. H., Salleh, M. S., Jubit, N., & Redzuan, M. S. (2024b). Analisis Ruangan Hot Spot Jenayah Pecah Rumah di Negeri Selangor, Kuala Lumpur dan Putrajaya pada tahun 2015–2020. Malaysian Journal of Society and Space, 20(1), 49–67. https://doi.org/10.17576/geo-2024-2001-04
- Ahmad, A., Said, M. Z., Masron, T., Ariffin, N. A., Zakaria, Y. S., Ardiansyah, A., Jamru, L. R., Talib, N. K., Idris, N. R. A., Abd. Rahman, N., Bismelah, L. H., Mohd Ali, A. S., Wis, B. A., & Musa, N. (2024c). Faktor Kesukaran dalam Proses Memodelkan Sebuah Tapak Arkeologi Menerusi Pendekatan Geospatial. E-Bangi Journal of Social Science and Humanities, 21(1), 492–501. https://doi.org/10.17576/ebangi.2024.2101.42
- Ahmad, A.,Masron, T.,Junaini, S. N.,Barawi, M. H.,Redzuan, M. S.,Kimura, Y.,Jubit, N.,Bismelah, L. H., &Mohd Ali, A. S. (2024d). Criminological insights: A comprehensive spatial analysis of crime hot spots of property offenses in Malaysia’s urban centers. Forum Geografi, 38(1), 1–29. https://doi.org/10.23917/forgeo.v38i1.4306
- Ahmar, Ansari Saleh, Aidid, M. Kasim, Adiatma. (2018). Crime modeling using spatial regression approach. Journal of Physics: Conference Series, 954(1), 012013). https://doi.org/10.1088/1742-6596/954/1/012013
- Anderez, D. O., Kanjo, E., Anwar, A., Johnson, S. D., & Lucy, D. (2021). The rise of technology in crime prevention: Opportunities, challenges and practitioners perspectives. Computer Science, Computers and Society. https://arxiv.org/abs/2102.04204
- Andresen, M. A., & Linning, S. J. (2012). The (In)appropriateness of aggregating across crime types. Applied Geography, 35(1–2), 275–282. https://doi.org/10.1016/j.apgeog.2012.07.007
- Anselin, L. (1995). Local indicators of spatial association-LISA. Geographical Analysis, 27(2), 93–115. https://doi.org/10.1111/j.1538-4632.1995.tb00338.x
- Ariffin, N. A., Wan Ibrahim, W. M. M., Rainis, R., Samat, N., Mohd Nasir, M. I., Abdul Rashid, S. M. R., Ahmad, A., & Zakaria, Y. S. (2024). Identification of trends, direction of distribution and spatial pattern of tuberculosis disease (2015-2017) in Penang. Malaysian Journal of Society and Space, 20(1), 68–84. https://doi.org/10.17576/geo-2024-2001-05
- Armitage, R., & Gamman, L. (2009). Sustainability via security: A new look. Built Environment, 35(3), 297–301. https://doi.org/10.2148/benv.35.3.297
- Ashby, M. P. J. (2019). Studying crime and place with the crime open database. Research Data Journal for the Humanities and Social Sciences, 4(1), 65–80. https://doi.org/10.1163/24523666-00401007
- Bachman, R. (2015). Data bases and statistical systems: Crime measurement. In International Encyclopedia of the Social & Behavioral Sciences: Second Edition. (pp. 720–726). Elsevier Inc. https://doi.org/10.1016/B978-0-08-097086-8.45055-5
- Bai, X., Mcphearson, T., Cleugh, H., Nagendra, H., Tong, X., Zhu, T., & Zhu, Y.-G. (2017). Linking urbanization and the environment: Conceptual and empirical advances. Annual Review of Environment and Resources, 42(1), 215–240. https://doi.org/10.1146/annurev-environ-102016-061128
- Baker, T., & Wolfer, L. (2003). The crime triangle: Alcohol, drug use, and vandalism. Police Practice and Research, 4(1), 47–61. https://doi.org/10.1080/1561426032000059187
- Basiron, N. F. Z.,Ahmad, A., &Masron, T. (2014). Spatial analysis of international tourist movement to Langkawi for 2010 and 2011. SHS Web of Conferences, 12, 01066.https://doi.org/10.1051/shsconf/20141201066
- Boldt, M., & Borg, A. (2016). Evaluating temporal analysis methods using residential Burglary data. ISPRS International Journal of Geo-Information, 5(9), 148. https://doi.org/10.3390/ijgi5090148
- Braga, A. A. (2003). Protocol-systematic review of the effects of hot spots policing on crime. Campbell Systematic Reviews, 1(1), 1–13. https://doi.org/10.1002/CL2.20
- Braga, A. A. (2006). The crime prevention value of hot spots policing. PubMed-Psicothema, 18(3), 630–637. https://pubmed.ncbi.nlm.nih.gov/17296097/
- Braga, A. A., Andresen, M. A., & Lawton, B. (2017). The law of crime concentration at places: editors’ introduction. Journal of Quantitative Criminology, 33(3), 421–426. https://doi.org/10.1007/s10940-017-9342-0
- Braga, A. A., Papachristos, A. V., & Hureau, D. M. (2014). The effects of hot spots policing on crime: An updated systematic review and meta-analysis. Justice Quarterly, 31(4), 633–663. https://doi.org/10.1080/07418825.2012.673632
- Braga, A., Papachristos, A., & Hureau, D. (2012). Hot spots policing effects on crime. Campbell Systematic Reviews, 8(1), 1–96. https://doi.org/10.4073/csr.2012.8
- Braga, A. A., Turchan, B., Papachristos, A. V., & Hureau, D. M. (2019). Hot spots policing of small geographic areas effects on crime. Campbell Systematic Reviews, 15 (3), e1046. https://doi.org/10.1002/cl2.1046
- Browning, C. R., Byron, R. A., Calder, C. A., Krivo, L. J., Kwan, M. P., Lee, J. Y., & Peterson, R. D. (2010). Commercial density, residential concentration, and crime: Land use patterns and violence in neighborhood context. Journal of Research in Crime and Delinquency, 47(3), 329–357. https://doi.org/10.1177/002242781036590
- Brunsdon, C., & Corcoran, J. (2022). Unveiling the relationship between land use types and the temporal signals of crime: An empirical decomposition approach. Environment and Planning B: Urban Analytics and City Science, 49(3), 847–865. https://doi.org/10.1177/23998083211033304
- Buil-Gil, D., Moretti, A., & Langton, S. H. (2022). The accuracy of crime statistics: Assessing the impact of police data bias on geographic crime analysis. Journal of Experimental Criminology, 18(3), 515–541. https://doi.org/10.1007/s11292-021-09457-y
- Cai, D., & Shi, Z. (2021). Analysis of temporal characteristics of Burglary crime. Converter, 5(5), 697–707. www.converter-magazine.info https://doi.org/10.17762/converter.335
- Ceccato, V., & Wilhelmsson, M. (2020). Do crime hot spots affect housing prices? Nordic Journal of Criminology, 21(1), 84–102. https://doi.org/10.1080/2578983X.2019.1662595
- Chainey, S. (2021). Understanding crime: Analyzing the geography of crime. https://www.amazon.com/Understanding-Crime-Analyzing-Geography/dp/158948584X/ref=pd_sim_sccl_2_6/136-0070959-8479045?pd_rd_w=P6y3V&content-id=amzn1.sym.c4a59542-32d7-42e0-896e-07bdfd700573&pf_rd_p=c4a59542-32d7-42e0-896e-07bdfd700573&pf_rd_r=HFFWCR4KXXAT8P5Y8351&pd_rd_wg=xX18i&pd_rd_r=c117c7e9-e60a-4097-a2aa-ba1463564361&pd_rd_i=158948584X&psc=1
- Chainey, S., & Ratcliffe, J. (2013). GIS and crime mapping (2nd ed.). John Wiley & Sons.
- Chainey, S., Tompson, L., & Uhlig, S. (2008). The utility of hotspot mapping for predicting. Security Journal, 21(1–2), 4–28. https://doi.org/10.1057/palgrave.sj.8350066
- Chege, G. N., Mwalili, S. M., & Wanjoya, A. (2019). Bayesian spatial–temporal modelling and mapping for crime data in Nairobi county. International Journal of Data Science and Analysis, 5(6), 111–116. https://doi.org/10.11648/j.ijdsa.20190506.11
- Clouse, S. L. (2022). Built environment, land use, and crime: A Las Vegas study [UNLV Theses, Dissertations, Professional Papers, and Capstones, University of Nevada]. https://doi.org/10.34917/31813269
- Cohen, L. E., & Felson, M. (1979). Social change and crime rate trends: A routine activity approach. American Sociological Review, 44(4), 588–608. https://doi.org/10.2307/2094589
- Cozens, P., & Love, T. (2017). The dark side of crime prevention through environmental design (CPTED). Oxford Research Encyclopedia of Criminology and Criminal Justice. https://doi.org/10.1093/acrefore/9780190264079.013.2
- Crivellari, A., & Ristea, A. (2021). CrimeVec-exploring spatial-temporal based vector representations of urban crime types and crime-related urban regions. ISPRS International Journal of Geo-Information, 10(4), 210. https://doi.org/10.3390/ijgi10040210
- Cummings, A. R., Markandey, N., Das, H., Arredondo, C., Wehenkel, A., Tiemann, B. L., & Lee, G. (2019). The spill over of crime from urban centers: An account of the changing spatial distribution of violent crime in Guyana. ISPRS International Journal of Geo-Information, 8(11), 481. https://doi.org/10.3390/ijgi8110481
- Demeau, E., & Parent, G. (2018). Impacts of crime attractors and generators on criminality in Montreal. Canadian Journal of Criminology and Criminal Justice, 60(3), 387–412. https://doi.org/10.3138/cjccj.2017-0028.r1
- Duru, H., & Akbas, H. (2021). Measuring hot spots policing in non-research settings. International Journal of Law, Crime and Justice, 65, 100468. https://doi.org/10.1016/j.ijlcj.2021.100468
- ESRI. ESRI). (2022). How hot spot analysis (Getis-Ord Gi*) works. Environmental Systems Research Institute, Inc. https://pro.arcgis.com/en/pro-app/latest/tool-reference/spatial-statistics/h-how-hot-spot-analysis-getis-ord-gi-spatial-stati.htm#:∼:text=The%20Hot%20Spot%20Analysis%20tool,the%20context%20of%20neighboring%20features.
- Farrington, D. P. (1988). Advancing knowledge about delinquency and crime: The need for a coordinated program of longitudinal research. Behavioral Sciences & the Law, 6(3), 307–331. https://doi.org/10.1002/bsl.2370060304
- Felson, M., Xu, Y., & Jiang, S. (2022). Property crime specialization in Detroit, Michigan. Journal of Criminal Justice, 82(, 101953. https://doi.org/10.1016/j.jcrimjus.2022.101953
- Fenimore, D. M. (2019). Mapping harmspots: An exploration of the spatial distribution of crime harm. Applied Geography, 109, 102034. https://doi.org/10.1016/j.apgeog.2019.06.002
- Fennelly, L. J., Perry, M. A., & Fagel, M. J. (2020). Chapter 9-Encompassing effective crime prevention solutions in 2020 and beyond: Concepts and strategies. Handbook of Loss Prevention and Crime Prevention, 85–97. https://doi.org/10.1016/b978-0-12-817273-5.00009-0
- Fitzpatrick, D. J., Gorr, W. L., & Neill, D. B. (2019). Keeping score: Predictive analytics in policing. Annual Review of Criminology, 2(1), 473–491. https://doi.org/10.1146/annurev-criminol-011518-024534
- Fondevila, G., Vilalta, C., & Massa, R. (2022). On the relationship between police force presence and crime in Mexico: A spatial analysis. Police Practice and Research, 23(2), 159–173. https://doi.org/10.1080/15614263.2021.1915144
- Fullerton, C. (2022). Understanding the reality of holiday-related crimes. Articles by Lawyers. https://www.hg.org/legal-articles/understanding-the-reality-of-holiday-related-crimes-49947
- Gorr, W. L., & Kurland, K. S. (2012). GIS tutorial for crime analysis. ESRI Press.
- Gorr, W. L., Kurland, K. S., & Dodson, Z. M. (Eds.). (2018). GIS tutorial for crime analysis. (2nd ed.). ESRI Press. https://www.amazon.com/GIS-Tutorial-Crime-Analysis-Tutorials-ebook/dp/B07CN9H7W5
- Groff, E. R., & Lockwood, B. (2014). Criminogenic facilities and crime across street segments in Philadelphia: Uncovering evidence about the spatial extent of facility influence. Journal of Research in Crime and Delinquency, 51(3), 277–314. https://doi.org/10.1177/0022427813512494
- Grubesic, T. H., & Mack, E. A. (2008). Spatio-temporal interaction of urban crime. Journal of Quantitative Criminology, 24(3), 285–306. https://doi.org/10.1007/s10940-008-9047-5
- Guerette, R. T., Przeszlowski, K., Lee-Silcox, J., & Zgoba, K. M. (2021). Improving policing through better analysis: An empirical assessment of a crime analysis training and enhancement project within an urban police department. Police Practice and Research, 22(4), 1425–1442. https://doi.org/10.1080/15614263.2020.1861448
- Haim, D., Nanes., & M., Ravanilla. (2021, February 24). The impact of community policing on attitudes and public safety in the Philippines. Innovations for Poverty Action. https://poverty-action.org/study/impact-community-policing-attitudes-and-public-safety-philippines
- Hakim, H. M., Omar Khan, H., Helmi Hamzah, H., Othman, M. F., Nelson, B. R., Chambers, G. K., Atan Edinur, H., Abdullah, M. T., & Rasudin, N. S. (2019). Violent crime datasets: Incidence and patterns in Malaysia from 2006 to 2017. Data in Brief, 26, 104449. https://doi.org/10.1016/j.dib.2019.104449
- Han, Y., Hu, Y., Zhu, H., & Wang, F. (2023). A cyclically adjusted spatio-temporal Kernel density estimation method for predictive crime hotspot analysis. Annals of GIS, 29(2), 177–191. https://doi.org/10.1080/19475683.2023.2166584
- Harding, D. J. (2009). Collateral consequences of violence in disadvantaged neighborhoods. Social Forces; a Scientific Medium of Social Study and Interpretation, 88(2), 757–784. https://doi.org/10.1353/sof.0.0281
- Hart, T. C. (2021). Investigating crime pattern stability at micro-temporal intervals: Implications for crime analysis and hotspot policing strategies. Criminal Justice Review, 46(2), 173–189. https://doi.org/10.1177/0734016821996785
- Hashim, H., Wan Mohd, W. M. N., Sadek, E. M., & Dimyati, K. M. (2019). Modeling urban crime patterns using spatial space time and regression analysis. The International Archives of the Photogrammetry, Remote Sensing and Spatial Information Sciences, XLII-4/W16(4/W16), 247–254. https://doi.org/10.5194/isprs-archives-XLII-4-W16-247-2019
- He, Z., Tao, L., Xie, Z., & Xu, C. (2020). Discovering spatial interaction patterns of near repeat crime by spatial association rules mining. Scientific Reports, 10(1), 1–11. https://doi.org/10.1038/s41598-020-74248-w
- Herrmann, C. R. (2015). The dynamics of robbery and violence hot spots. Crime Science, 4(1). https://doi.org/10.1186/s40163-015-0042-5
- Hunt, J. (2019). From crime mapping to crime forecasting: The evolution of place-based policing. Journal National Institute of Justice, https://nij.ojp.gov/topics/articles/crime-mapping-crime-forecasting-evolution-place-based-policing
- Inlow, A. R. (2021). A comprehensive review of quantitative research on crime, the built environment, land use, and physical geography. Sociology Compass, 15(7), 1–18. https://doi.org/10.1111/soc4.12889
- Irandegani, Z., Mohammadi, R., & Taleai, M. (2019). Investigating temporal and spatial effects of urban planning variables on crime rate: A GWR and OLS based approach [Paper presentation]. ISPRS International Archives of the Photogrammetry, Remote Sensing and Spatial Information Sciences-ISPRS Archives, Volume XLII-4/W18, 2019 GeoSpatial Conference 2019-Joint Conferences of SMPR and GI Research, 12-14 October 2019, Karaj, Iran, 42(4/W18), 559–564. https://doi.org/10.5194/isprs-archives-XLII-4-W18-559-2019
- Jabatan Perangkaan Malaysia. (2022a). Penemuan Utama Banci Penduduk Dan Perumahan Malaysia, 2020 Negeri Selangor. https://bit.ly/PocketStatsQ1_2022.
- Jabatan Perangkaan Malaysia. (2022b). Penemuan Utama Banci Penduduk Dan Perumahan Malaysia, 2020 Negeri Wilayah Persekutuan Kuala Lumpur. https://bit.ly/PocketStatsQ1_2022
- Jabatan Perangkaan Malaysia. (2022c). Penemuan Utama Banci Penduduk Dan Perumahan Malaysia, 2020 Negeri Wilayah Persekutuan Putrajaya. https://bit.ly/PocketStatsQ1_2022
- Jafarzadegan, K., Moradkhani, H., Pappenberger, F., Moftakhari, H., Bates, P., Abbaszadeh, P., Marsooli, R., Ferreira, C., Cloke, H. L., Ogden, F., & Duan, Q. (2023). Recent advances and new frontiers in riverine and coastal flood modeling. Reviews of Geophysics, 61(2), e2022RG000788. https://doi.org/10.1029/2022RG000788
- Jubit, N., Masron, T., & Marzuki, A. (2020). Analyzing the spatial temporal of property crime hot spots. A case study of Kuching, Sarawak. Planning Malaysia, 18(4), 1–11. https://doi.org/10.21837/pm.v18i14.813
- Jubit, N., Masron, T., & Redzuan, M. S. (2023a). High risk areas of snatch theft in Kuala Lumpur, Putrajaya, and Selangor, Malaysia. Malaysian Journal of Society and Space, 19(4), 15–29. https://doi.org/10.17576/geo-2023-1904-02
- Jubit, N., Masron, T., Puyok, A., & Ahmad, A. (2023b). Geographic distribution of voter turnout, ethnic turnout and vote choices in Johor State Election. Malaysian Journal of Society and Space, 19(4), 64–76. https://doi.org/10.17576/geo-2023-1904-05
- Jubit, N., Redzuan, M. S., Ahmad, A., Salleh, M. S., & Masron, T. (2022). Tren Jenayah Harta Benda di Malaysia: Kajian di Selangor dan Kuala Lumpur. Geografi., 10(2), 35–53. https://doi.org/10.37134/geografi.vol10.2.3.2022
- Jujjuri, R. D., Tripathi, A. K., Chandrika, V. S., Majji, S., Boppuru, P. R., & Patnala, T. R. (2022). Detection of cyber crime based on facial pattern enhancement using machine learning and image processing techniques. In Using Computational Intelligence for the Dark Web and Illicit Behavior Detection. (pp. 150–165). IGI Global. https://doi.org/10.4018/978-1-6684-6444-1.ch008
- Kim, D., Jung, S., & Jeong, Y. (2021). Theft prediction model based on spatial clustering to reflect spatial characteristics of adjacent lands. Sustainability, 13(14), 7715. https://doi.org/10.3390/su13147715
- Knapp, J. (2013). Safety and urban design-the role of CPTED in the design process. Safer Communities, 12(4), 176–184. https://doi.org/10.1108/SC-07-2013-0015
- Kondo, M. C., Andreyeva, E., South, E. C., MacDonald, J. M., & Branas, C. C. (2018). Neighborhood interventions to reduce violence. Annual Review of Public Health, 39(1), 253–271. https://doi.org/10.1146/annurev-publhealth-040617-014600
- Koper, C. S., Wu, X., & Lum, C. (2021). Calibrating police activity across hot spot and non-hot spot areas. Police Quarterly, 24(3), 382–406. https://doi.org/10.1177/1098611121995809
- Lane, M., & Henry, K. (2001). Community development, crime and violence: A case study. Community Development Journal, 36(3), 212–222. https://doi.org/10.1093/cdj/36.3.212
- Lardier, D. T., Reid, R. J., Yu, D., & Garcia-Reid, P. (2020). A spatial analysis of alcohol outlet density and abandoned properties on violent crime in Paterson New Jersey. Journal of Community Health, 45(3), 534–541. https://doi.org/10.1007/s10900-019-00772-0
- Lee, Y. J., Eck, J. E., SooHyun, O., & Martinez, N. N. (2017). How concentrated is crime at places? A systematic review from 1970 to 2015. Crime Science, 6(1), 1–16. https://doi.org/10.1186/s40163-017-0069-x
- Lewis, R. A., & Carton, M. P. (2022, February 23). What are predictors of school violence? What are its consequences? National Institute of Justice Office of Justice Programs U.S. Department of Justice. https://nij.ojp.gov/topics/articles/what-are-predictors-school-violence-what-are-its-consequences
- Linning, S. J., Andresen, M. A., & Brantingham, P. J. (2017). Crime seasonality: Examining the temporal fluctuations of property crime in cities with varying climates. International Journal of Offender Therapy and Comparative Criminology, 61(16), 1866–1891. https://doi.org/10.1177/0306624X166322
- Linning, S. J., Andresen, M. A., Ghaseminejad, A. H., & Brantingham, P. J. (2017). Crime seasonality across multiple jurisdictions in British Columbia, Canada. Canadian Journal of Criminology and Criminal Justice, 59(2), 251–280. https://doi.org/10.3138/cjccj.2015.E31
- Liu, D., Song, W., & Xiu, C. (2014). Spatial patterns of violent crimes and neighborhood characteristics in Changchun, China. Australian & New Zealand Journal of Criminology, 49(1), 53–72. https://doi.org/10.1177/0004865814547133
- Luo, J. (2017). Multi-spatiotemporal patterns of residential Burglary crimes in Chicago: 2006-2016. ISPRS Annals of the Photogrammetry, Remote Sensing and Spatial Information Sciences, IV-4/W2(4W2), 193–198. https://doi.org/10.5194/isprs-annals-IV-4-W2-193-2017
- Malleson, N., Steenbeek, W., & Andresen, M. A. (2019). Identifying the appropriate spatial resolution for the analysis of crime patterns. PloS One, 14(6), e0218324. https://doi.org/10.1371/journal.pone.0218324
- Marzuki, A., Bagheri, M., Ahmad, A., Masron, T., & Akhir, M. F. (2023). Establishing a GIS-SMCDA model of sustainable eco-tourism development in Pahang, Malaysia. Episodes, 46(3), 375–387. https://doi.org/10.18814/epiiugs/2022/022037
- Masron, T., Marzuki, A., Yaakub, N. F., Nordin, M. N., & Jubit, N. (2021). Spatial analysis of crime hot-spot in the Northeast Penang Island District and Kuching District, Malaysia. Planning Malaysia: Journal of the Malaysian Institute of Planners, 19(5), 26–39. https://doi.org/10.21837/pm.v19i19.1057
- Matijosaitiene, I., Zhao, P., Jaume, S., & Gilkey, J. W. (2018). Prediction of hourly effect of land use on crime. ISPRS International Journal of Geo-Information, 8(1), 16. https://doi.org/10.3390/ijgi8010016
- Melo, S. N., de, Pereira, D. V. S., Andresen, M. A., & Matias, L. F. (2018). Spatial/temporal variations of crime: A routine activity theory perspective. International Journal of Offender Therapy and Comparative Criminology, 62(7), 1967–1991. https://doi.org/10.1177/0306624X17703654
- Mohamad Ali, S. N., Tarmidi, Z., & Mat Nor, N. A. (2020). Review of conceptual model to spatially assessing safe city level of affordable housing in Malaysia. IOP Conference Series: Earth and Environmental Science, 540(1), 012046. https://doi.org/10.1088/1755-1315/540/1/012046
- Mohd Ayob, N., Ahmad, A., & Mohamed, B. (2013). Spatial distributions of tourist in Langkawi Island. In B. Mohamed & A. Bahauddin (Eds.), Proceedings of International Conference on Tourism Development, Building The Future Of Tourism, 4 & 5 February 2013 (pp. 301–309). Sustainable Tourism Research Cluster, Universiti Sains Malaysia. https://www.semanticscholar.org/paper/Spatial-distributions-of-tourist-in-Langkawi-Ayob-Ahmad/e8063d2ba8ad3d20d02af9a82be22069c56c11ed
- Mohd Ayob, N., Masron, T., & Ahmad, A. (2014). Taburan Ciri-Ciri Sosio-Demografi Pelancong Domestik mengikut lokasi di Pulau Langkawi. International Journal of Environment, Society and Space, 2(2), 35–49. https://www.researchgate.net/publication/330132773_Taburan_Ciri-Ciri_Sosio-Demografi_Pelancong_Domestik_Mengikut_Lokasi_di_Pulau_Langkawi
- Mohd Hakim, H., Lalung, J., Omar Khan, H., Helmi Hamzah, H., Othman, M. F., Rasudin, N. S., Pati, S., Bryan Raveen, N., Mat-Ghani, S. N. A., Geoffrey Keith, C., & Hisham, A. E. (2022). Property crime incidence and patterns in Malaysia from 2007 to 2017. Planning Malaysia, 20(1), 25–35. https://doi.org/10.21837/pm.v20i20.1076
- Mohd Shamsuddin, N. H., Ali, N. A., & Alwee, R. (2017, July 14). An overview on crime prediction methods [Paper presentation]. 2017 6th ICT International Student Project Conference (ICT-ISPC). https://doi.org/10.1109/ICT-ISPC.2017.8075335
- Mokhtar, E. S., Ghazali, N., Md Sadek, E. S. S., Mohd Sidek, N. Z., Shaharudin, M. R., Ramli, L. E., & Arsad, A. R. (2023). Pemetaan Hotspot Kes Jenayah Kawasan Lembah Klang Menggunakan Kaedah Geographical Information System (GIS). Journal of Public Security and Safety, 15(1/2023), 15–11. https://www.moha.gov.my/index.php/ms/2015-06-17-02-53-03
- Muhamad Ludin, A. N., Abd. Aziz, N., Hj Yusoff, N., & Wan Abd Razak, W. J. (2013). Impacts of urban land use on crime patterns through GIS application. Planning Malaysia, 11(2), 1–22. https://doi.org/10.21837/pm.v11i2.113
- Nepomuceno, T. C. C., & Costa, A. P. C. S. (2019). Spatial visualization on patterns of disaggregate robberies. Operational Research, 19(4), 857–886. https://doi.org/10.1007/s12351-019-00479-z
- Nix, J., Huff, J., Wolfe, S. E., Pyrooz, D. C., & Mourtgos, S. M. (2024). When police pull back: Neighborhood-level effects of de-policing on violent and property crime, A research note. Criminology, 62(1), 156–171. https://doi.org/10.1111/1745-9125.12363
- Patalinghug, M. E., Gaston Sarcena, J. D., Bustamante, R. S., Melecio, K. G., Mangubat, J. M., & Patalinghug, H. F. (2023). Correlates of crime prevention and perception of safety using the Knowledge, Attitudes, and Behavior (KAB) Model. Pertanika Journal of Social Sciences and Humanities, 31(2), 607–635. https://doi.org/10.47836/pjssh.31.2.09
- Pereira, D. V. S., Andresen, M. A., & Mota, C. M. M. (2016). A temporal and spatial analysis of homicides. Journal of Environmental Psychology, 46, 116–124. https://doi.org/10.1016/j.jenvp.2016.04.006
- Prathap, B. R., & Ramesha, K. (2020). Geospatial crime analysis to determine crime density using Kernel density estimation for the Indian context. Journal of Computational and Theoretical Nanoscience, 17(1), 74–86. https://doi.org/10.1166/jctn.2020.8632
- Pratt, T. C., & Cullen, F. T. (2005). Assessing macro-level predictors and theories of crime: A meta analysis. Crime and Justice, 32, 373–450. https://doi.org/10.1086/655357
- Quick, M., Law, J., & Li, G. (2019). Time-varying relationships between land use and crime: A spatio-temporal analysis of small-area seasonal property crime trends. Environment and Planning B: Urban Analytics and City Science, 46(6), 1018–1035. https://doi.org/10.1177/2399808317744779
- Ratcliffe, J. H. (2004). Geocoding crime and a first estimate of a minimum acceptable hit rate. International Journal of Geographical Information Science, 18(1), 61–72. https://doi.org/10.1080/13658810310001596076
- Rosenbaum, D. P. (1988). Community crime prevention: A review and synthesis of the literature. Justice Quarterly, 5(3), 323–395. https://doi.org/10.1080/07418828800089781
- Sampson, R. J., & Lauritsen, L. (1994). Violent victimization and offending: Individual-, situational-, and community-level risk factors. In A. J. Reiss & J. A. Roth (Eds.), Understanding and preventing violence: Social influences. (Vol. 3). The National Academies Press. https://doi.org/10.17226/4421
- Santhana Dass, R. A. (2019). Crime trends and patterns in Malaysia. Kyoto Review of Southeast Asia, 25. https://kyotoreview.org/trendsetters/crime-trends-and-patterns-in-malaysia/
- Santos, R. B., & Santos, R. G. (2021). Proactive police response in property crime micro-time hot spots: Results from a partially-blocked blind random controlled trial. Journal of Quantitative Criminology, 37(1), 247–265. https://doi.org/10.1007/s10940-020-09456-8
- Sherman, L. W., Gartin, P. R., & Buerger, M. E. (1989). Hot spots of predatory crime: Routine activities and the criminology of place. Criminology, 27(1), 27–56. https://doi.org/10.1111/j.1745-9125.1989.tb00862.x
- Shiode, N., Shiode, S., & Inoue, R. (2022). Measuring the colocation of crime hotspots. GeoJournal, 88(3), 3307–3322. https://doi.org/10.1007/s10708-022-10806-1
- Sidhu, A. A. S. (2005). The rise of crime in Malaysia-An academic and statistical analysis. Journal of the Kuala Lumpur Royal Malaysia Police College, 1–28. https://qdoc.tips/paper-on-rise-of-crime-in-malaysia-pdf-free.html
- Soska, T. M., & Ohmer, M. L. (2018). Community approaches for addressing crime and violence: Prevention, intervention, and restoration. Handbook of community movements and local organizations in the 21st century, Handbooks of sociology and social research (pp. 469–496). Stratford: Peer Reviewed Journals & Books. https://doi.org/10.1007/978-3-319-77416-9_29
- Stucky, T. D., & Ottensmann, J. R. (2009). Land use and violent crime. Criminology, 47(4), 1223–1264. https://doi.org/10.1111/j.1745-9125.2009.00174.x
- Sun, Y., Wang, S., Xie, J., & Hu, X. (2021). Modeling local-scale violent crime rate: A comparison of eigenvector spatial filtering models and conventional spatial regression models. The Professional Geographer, 73(2), 312–321. https://doi.org/10.1080/00330124.2020.1844574
- Suryavanshi, V. M. (2001). Land use and opportunities for crime: Using GIS as an analysis tool. chrome-extension://efaidnbmnnnibpcajpcglclefindmkaj/https://vtechworks.lib.vt.edu/bitstream/handle/10919/37130/FinalMP.pdf?sequence=1&isAllowed=y
- Sypion-Dutkowska, N., & Leitner, M. (2017). Land use influencing the spatial distribution of urban crime: A case study of Szczecin, Poland. ISPRS International Journal of Geo-Information, 6(3), 74. https://doi.org/10.3390/ijgi6030074
- Tavares, J. P., & Costa, A. C. (2021). Spatial modeling and analysis of the determinants of property crime in Portugal. ISPRS International Journal of Geo-Information, 10(11), 731. https://doi.org/10.3390/ijgi10110731
- Taylor, B. G., Liu, W., Maitra, P., Koper, C. S., Sheridan, J., & Johnson, W. (2022). The effects of community-infused problem-oriented policing in crime hot spots based on police data: A randomized controlled trial. Journal of Experimental Criminology, 5, 1–29. https://doi.org/10.1007/s11292-022-09541-x
- Taylor, B., Koper, C. S., & Woods, D. J. (2011). A randomized controlled trial of different policing strategies at hot spots of violent crime. Journal of Experimental Criminology, 7(2), 149–181. https://doi.org/10.1007/s11292-010-9120-6
- Teivāns-Treinovskis, J., Amosova, J., Načisčionis, J., & Nesterova, M. (2016). Development and safety-violent crimes in crime structure. Journal of Security and Sustainability Issues, 6(2), 227–233. https://doi.org/10.9770/jssi.2016.6.2(3)
- Tom-Jack, Q. T., Bernstein, J. M., & Loyola, L. C. (2019). The role of geoprocessing in mapping crime using hot streets. ISPRS International Journal of Geo-Information, 8(12), 540. https://doi.org/10.3390/ijgi8120540
- Towers, S., Chen, S., Malik, A., & Ebert, D. (2018). Factors influencing temporal patterns in crime in a large American city: A predictive analytics perspective. PloS One, 13(10), e0205151. https://doi.org/10.1371/journal.pone.0205151
- Townsley, M. (2009). Spatial autocorrelation and impacts on criminology. Geographical Analysis, 41(4), 452–461. https://doi.org/10.1111/j.1538-4632.2009.00775.x
- Tumbas, M., Markovic, S., Salom, I., & Djordjevic, M. (2023). A large-scale machine learning study of sociodemographic factors contributing to COVID-19 severity. Frontiers in Big Data, 6, 1038283. https://doi.org/10.3389/fdata.2023.1038283
- Valente, R. (2019). Spatial and temporal patterns of violent crime in a Brazilian State Capital: A quantitative analysis focusing on micro places and small units of time. Applied Geography, 103, 90–97. https://doi.org/10.1016/j.apgeog.2019.01.006
- Wang, F. (2012). Why police and policing need GIS: An overview. Annals of GIS, 18(3), 159–171. https://doi.org/10.1080/19475683.2012.691900
- Wang, Z., & Zhang, H. (2020). Construction, detection, and interpretation of crime patterns over space and time. ISPRS International Journal of Geo-Information, 9(6), 339. https://doi.org/10.3390/ijgi9060339
- Weisburd, D., & Telep, C. W. (2014). Hot spots policing: What we know and what we need to know. Journal of Contemporary Criminal Justice, 30(2), 200–220. https://doi.org/10.1177/1043986214525083
- Weisburd, D., Groff, E. R., & Yang, S.-M. (2012). The criminology of place: Street segments and our understanding of the crime problem. Oxford University Press. https://www.academia.edu/66618554/The_criminology_of_place_Street_segments_and_our_understanding_of_the_crime_problem
- Yang, Z., Shen, N., Qu, Y., & Zhang, B. (2021). Association between rural land use transition and urban–rural integration development: From 2009 to 2018 based on county-level data in Shandong Province, China. Land, 10(11), 1228. https://doi.org/10.3390/land10111228
- Zakaria, Y. S., Ahmad, A., Said, M. Z., Epa, A. E., Ariffin, N. A., M Muslim, A., Akhir, M. F., & Hussin, R. (2023). GIS and oil spill tracking model in forecasting potential oil spill-affected areas along Terengganu and Pahang coastal area. Planning Malaysia: Journal of the Malaysian Institute of Planners, 21(4), 250–264. https://doi.org/10.21837/pm.v21i28.1330
- Zane, S. (2020). Longitudinal research in criminology. In Oxford Bibliographies: Your Best Research Starts Here. https://doi.org/10.1093/OBO/9780195396607-0287
- Zulkiflee, N. F. Z., Borhan, N., & Hadrawi, M. F. (2022). Factors affecting crime rate in Malaysia using autoregressive distributed lag modeling approach. Pertanika Journal of Social Sciences and Humanities, 30(3), 1165–1181. https://doi.org/10.47836/pjssh.30.3.13