
 ?Mathematical formulae have been encoded as MathML and are displayed in this HTML version using MathJax in order to improve their display. Uncheck the box to turn MathJax off. This feature requires Javascript. Click on a formula to zoom.
Abstract
Empirical information on food insecurity at the disaggregated geographic level is vital for effective interventions. Using a household survey, we explored the prevalence of food insecurity among smallholder farming households and analyzed the factors associated with it in northern Ethiopia. We collected data from 353 smallholder farmers and utilized the dietary intake method to assess and quantify food security. Nearly half (49.3%) of households are unable to meet the minimum energy requirement for a healthy and active life. The distribution of available calorie intake reveals that approximately 29% of farmers are precariously close to the food security line, indicating a state of vulnerability. While, factors such as education, social linkage, migration, number of livestock (mules) owned by households, access to drinking water, use of fertilizer, plain farmland and being a maize producer have positive and significant influences, large family size has negative and significant influence in smallholders’ food security status. The major coping strategies identified indicate the severity of food insecurity in the region and the resilience and adaptability of farming households in the face of food insecurity. The findings suggest the need for more sustainable solutions to address the root causes of food insecurity, such as improving agricultural productivity through high-quality crop varieties and agricultural technologies, enhanced access to education, financial and market services and strengthening social safety nets to improve food security among smallholder farmers in northern Ethiopia.
REVIEWING EDITOR:
1. Introduction
Food security is a pressing concern for national and international policymakers as the global population is estimated to exceed 9 billion by the mid-21st century (Drimie & Pereira, Citation2016). Food security exists when all people, at all times, have physical and economic access to sufficient, safe and nutritious food to meet their dietary needs and food preferences for an active and healthy life (FAO, Citation1996). Conversely, food insecurity represents limited access to food due to financial constraints or other resource shortages (FAO et al., Citation2019).
Despite global efforts toward eradicating hunger and food insecurity (FAO et al., Citation2019; FAO & OECD, Citation2018; von Braun et al., Citation2023), global food insecurity is increasing, particularly in developing countries (IFPRI, Citation2019; Prosekov & Ivanova, Citation2018; von Braun et al., Citation2023). About 821 million people, 98% of them in developing countries (FAO et al., Citation2019), faced chronic food deprivation in 2017, up from 804 million in 2016 and 784 million in 2015 (IFPRI, Citation2019). These nations struggle with delivering food security due to conflicts, poverty, natural hazards and policy problems (Ehrlich et al., Citation1993; Prosekov & Ivanova, Citation2018), leading to malnutrition and poor health that further impact physical and mental well-being and productivity (Barrett, Citation2010; Booth & Pollard, Citation2020; FAO et al., Citation2019; Hendriks et al., Citation2023; Jones, Citation2017).
Africa experiences the most severe food insecurity (FSIN & GNAFC, Citation2023; Prosekov & Ivanova, Citation2018; Wudil et al., Citation2022), with Ethiopia being a prime example. Despite significant strides in poverty reduction and spending on basic social services (WFP & CSA, Citation2019), widespread poverty and food insecurity persist, and millions are still poor and inadequately fed (IFPRI, Citation2019; Mekonnen & Gerber, Citation2017; WFP & CSA, Citation2019). Ethiopia’s vulnerability to food insecurity is exacerbated by farmers’ reliance on rain-fed agriculture characterized by low productivity and poor technology use (Ashley, Citation2016; Taghizadeh-Hesary et al., Citation2019; Wudil et al., Citation2022), coupled with current food price hikes. The Global Food Security Index (GFSI) evaluates food security across four key pillars: affordability, availability, quality and safety, and sustainability and adaptation. In its 2022 report, Ethiopia ranked 100th out of the 113 countries, with a score of 45.5 out of 100 (Global Food Security Index, Citation2022). Similarly, in the 2023 Global Hunger Index (GHI), Ethiopia ranks 101st out of 125 countries. With a score of 26.2, Ethiopia has a serious level of hunger (von Grebmer et al., Citation2023). To reverse the problem, the country has developed strategies and initiatives. The strategy for food security in Ethiopia is designed to tackle the root causes of food insecurity using a variety of methods. A primary focus of the strategy is to boost agricultural productivity, which is seen as a crucial step toward ensuring food security (Veen & Gebrehiwot, Citation2011; WFP, Citation2020; World Bank, Citation2015). The strategy also incorporates asset building and productive safety net programs to strengthen the adaptive capacity of the country’s farming communities (FDRE, Citation2019; WFP, Citation2020). In line with these goals, Ethiopia has made investments in the creation of agricultural training centers and the expansion of road and irrigation infrastructure to further sustainable development (Veen & Gebrehiwot, Citation2011; WFP, Citation2020; World Bank, Citation2015).
Food security is influenced by various environmental, economic, institutional and social factors (Barrett, Citation2010; FAO et al., 2019; Field et al., Citation2014; Prosekov & Ivanova, Citation2018; WFP & CSA, Citation2019). Achieving it, therefore, requires policies and strategies that consider these factors to ensure sufficient food supply (Babu et al., Citation2014). Moreover, identifying vulnerable households and their degree of vulnerability is crucial for policy and program design and implementation (Barrett, Citation2010; Zakari et al., Citation2014).
To accurately estimate and predict food security, household data at a disaggregated geographical level are required (Barrett, Citation2010; Jones et al., Citation2013). While many studies have been conducted in various parts of Ethiopia, most have used national and regional levels data (IFPRI, Citation2019; WFP & CSA, Citation2019), which lack information on consumption patterns (Babu et al., Citation2014) or factors influencing household-level food insecurity (Agidew & Singh, Citation2018; Barrett, Citation2010).
Food security in Ethiopia exhibits spatial variations, reflecting the diverse socio-economic and climatic conditions across the country (Ashley, Citation2016; WFP & CSA, Citation2019). Previous studies may not fully capture these variations, underlining the need for empirical research at the community level. Such localized studies can provide valuable insights for decision-makers, enabling them to make effective, targeted interventions. This study selected Bugna district as a grassroot representation for various reasons. The area is among the drought and food insecurity vulnerable areas in northern Ethiopia (Wassie et al., Citation2023), and it is found in the highland areas of the country outside of the main roads and urban centers.
The aim of this research, therefore, was to examine the food security situation among smallholder farming households who are mainly subsistence based in Bugna district, northern Ethiopia. It seeks to assess the extent of food insecurity, identify its determinant factors and coping strategies employed by these households. The findings from this study offers reliable and grassroots-level insights that can inform interventions on food security.
2. Materials and methods
2.1. Description of the study area
The location of the study area () lies between 12° 00′00″ and 12° 20′00″ latitude north and 38° 25′00″ and 39° 00′00″ longitude east. With a total population of 91,749, the district is found in a rugged and degraded topography. The altitude varies between 1,525 and 2,827 m above sea level. Rainfall has unimodal pattern (June–September) that ranges between 750 mm in the lowlands and 1,200 mm in the highland areas showing a positive association with altitude. Moreover, the mean minimum and maximum temperatures of the area were 7.5 °C and 26 °C, respectively.
Figure 1. Location of the study area: (a) map of Ethiopia and (b) Bugna district with topography highlighted and existing roads and rivers.
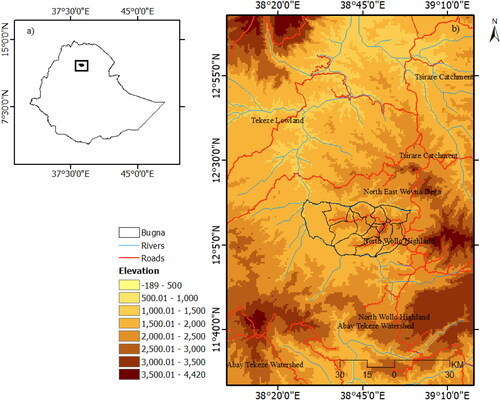
It is a drought-prone and semi-arid environment where vegetation has low coverage due to agricultural expansion and enormous erosion hazards. The area has a steep slope and shallow-depth soils including sandy (48.72%), lithosol (14.6%), regosol (19.61%), loamy (7.03%) and rocky sol (6.28%).
The agricultural system, predominantly subsistence and rain-fed dependent (BFS/USAID, Citation2017), is largely characterized by smallholder mixed farming, where crop cultivation and livestock rearing are practiced together using traditional farming tools (Andualem, Citation2016; ESS, Citation2022). The agriculture sector is highly vulnerable to variability in rainfall and temperature (BFS/USAID, Citation2017). The average landholding size was 0.67 hectare (ESS, Citation2022). This mixed farming system accounts for nearly 90% of the agricultural output (BFS/USAID, Citation2017). Teff, wheat, barley, maize and sorghum are the major cereal crops. In 2021, the average productivity (quintal/hectare) of such major crops in Bugna district and around were 15.13 for teff, 15.91 for barley, 22.77 for wheat, 29.77 for maize and 26.19 for sorghum (ESS, Citation2022). In 2019, more than 54% of the total land of the study area was cultivated and 25% covered grazing land.
The Agriculture Office of the Bugna district reported in 2020 that food insecurity is a growing problem in the area over recent decades due to a complex array of factors such as land degradation, soil erosion, deforestation and unpredictable rainfall. Accordingly, the food aid dependency of households in the district grew from 3,484 in 2009/10 to 15,056 in 2018/19. With a varied degree of the problem of food shortage, farming households faced the phenomenon at different seasons almost every year. Generally, a complex of factors such as structural, socio-economic, demographic, environmental and other factors are the underlying variables for the problem of food insecurity in Ethiopia (Abegaz, Citation2017; Ayal et al., Citation2023; Ayele, Citation2020; Sileshi et al., Citation2023).
Agriculture is the livelihood of the overwhelming majority of Ethiopians. A good performance of agriculture warrants the availability of food crops and a positive aspect of the national economy (CSA, Citation2019). A good performance of agriculture mainly depends on the rainfall seasons where good rainfall amount and distribution means good performance of agriculture. As said earlier, agriculture is subsistence and dominated by smallholder farmers, and most of the cereal crops produced was used for household consumption (CSA, Citation2020).
The rainfall pattern of the study area looks stable in the last 13 years, 2010–2022. CHIRPs precipitation data from Climate Engine.org shows that the average rainfall of the area was 894.29 mm, and average annual rainfall was above the long time average, except in 2011 and 2015. The 2011 and 2015 rainfall was short by 5% and 25%, respectively.
2.2. Methods
2.2.1. Sample size and sampling procedures
A multi-stage sampling strategy was adopted to identify households to be included in the study. Three lower administrative units, known as kebeles – Kidus Harbe, Daria and Birko were chosen. These units comprise a total of 4,351 farming households. The district agriculture office provided a list of these households, ensuring that the data used for the study was both accurate and current.
Following this, a systematic random sampling method was utilized to select 353 households proportionally from the list. This approach was used to ensure that each household had an equal opportunity to be included in the sample, thereby reducing bias.
The Kothari (Citation2004) formula was adopted for sample size determination:
(1)
(1)
Where n is the sample size, Z is the test statistics at a given confidence level (1.96 for 95%), p is the proportion of population characteristics (0.5), q = 1 – p, N is total population, and e is the margin of error (5%).
The sample size, accordingly is
2.2.2. Data collection tools
The primary data were predominantly gathered through a survey conducted at the household level in the three chosen kebeles. A self-administered structured questionnaire, comprising both closed and open-ended questions, was used to collect pertinent information. The heads of the households were queried about various aspects including demographic characteristics, socio-economic conditions, resource endowments, usage of farm technologies, access to basic services and the quantity of food consumed by the households in the week preceding the study. The questionnaire was administered in Amharic, the local language of the area. The English version of the questionnaire can be seen in Annex 1.
The data collection process was initiated only after obtaining the consent of the heads of the households. The sample households were briefed about the study’s objectives and potential contribution beforehand. They were also assured that their information would be kept confidential and used solely for educational purposes. Both male and female heads of households participated in the survey. However, to ensure data accuracy, mothers were specifically asked to respond to questions related to food consumption.
The primary data obtained from the survey were further substantiated by interviews with key informants. These included a Development Agent (DA), officers from the Productive Safety Net Program and representatives from each kebele. Interview contents are attached in Annex 2.
Secondary data such as the number of households in each kebele, the number of households dependent on food aid and beneficiaries of safety net programs were sourced from unpublished reports of the district.
3. Data analysis
3.1. Analysis of the food security variables
Food security is a complex concept that encompasses multiple dimensions and lacks a universally accepted definition (Ashley, Citation2016; Mekonnen & Gerber, Citation2017). It is structured into multiple hierarchical components: availability, access and utilization (Ashley, Citation2016; Cafiero et al., Citation2018). Access is most often evaluated at the individual and household levels (Ashley, Citation2016). Food security reflects whether individuals have access to adequate and quality food (FAO et al., 2019; IFPRI, Citation2019; Jones et al., Citation2013).
There are various measures of food security (Babu et al., Citation2014; Saint Ville et al., Citation2019; WFP & CSA, Citation2019; Zezza et al., Citation2017), some of which provide a national-level assessment of food security, while others focus on sub-national and household levels. This study employed the Average Calorie Acquisition method to determine the prevalence of household-level food insecurity in terms of dietary energy availability per capita (Ahmed et al., Citation2017; Smith et al., Citation2006; Smith & Subandoro, Citation2007). This approach measures the actual food consumed by households in terms of both quality and quantity (Ahmed et al., Citation2017; Pérez-Escamilla & Segall-Corrêa, Citation2008), enabling an analysis of the determinant factors influencing household level food security (Pérez-Escamilla & Segall-Corrêa, Citation2008).
A survey assessing household food consumption was conducted to measure dietary energy intake. This survey considered the total energy content of the food acquired by a household in the last 7 days before the interview (Ahmed et al., Citation2017; Pérez-Escamilla & Segall-Corrêa, Citation2008; Smith & Subandoro, Citation2007). The data on consumed food items were converted into metric quantities (100 g) and assigned a caloric value using the Ethiopian Nutrition and Health Research Institute (ENHRI) food composition table. The energy contents of all acquired edible foods were then summed up and divided by the number of days in the reference period, which would further be divided by the number of household members to arrive at the total energy acquired per household member (Ahmed et al., Citation2017; Smith & Subandoro, Citation2007). As individual food requirements vary by age and sex (FAO, Citation2014), adult equivalents (AE) were used to adjust for the people for whom energy or food is available. The number of household members in each age and sex category was multiplied by the corresponding adult equivalent factor to enable comparisons across households (Smith & Subandoro, Citation2007). The total number of adult equivalents for each sample household was determined by summing up the number of adult equivalents for each member of the household. Finally, the daily per capita calorie intake per person was calculated by dividing each household’s daily food energy availability by the number of household members (Ahmed et al., Citation2017; Smith & Subandoro, Citation2007). The result was then compared to the FAO’s minimum required standard calorie per adult equivalent per day, which is 2,100 kcal/day. Based on this standard, we classify a household as food secure, which was assigned a value of ‘1’, if it maintains the daily caloric threshold; otherwise, it was assigned a value of ‘0’. Thus, the response variable – the food security status of the ith household mentioned as a dummy variable – was:
(2)
(2)
where
is the food security condition of the ith household, i = 1, 2, 3, …, 353;
is the daily per capita calorie available;
is the FAO minimum required standard calories per day (2,100 kcal).
Additional food security measures were calculated as follows (Ahmed et al., Citation2017):
(3)
(3)
and
(4)
(4)
Where is the shortfall or surplus index,
is the deficiency/surplus of ith household,
is the available average daily calorie of the ith household, and n is the total number of households that are food insecure (shortfall index) or food secure (surplus index).
After the food security line was constructed and the food insecure households were identified, the Foster Greer Thorbeck (FGT) index was used to define the incidence (headcount ratio), depth (food insecurity gap) and severity (squared food insecurity gap) among households (Foster et al., Citation1984). The FGT index was calculated with the following formula:
(5)
(5)
Where n is the number of sample households; Yi is the available calorie intake per adult equivalent of the ith household; Th is the calorie requirement (2,100), q is the number of food-insecure households, and α is the weight attached to the severity of food insecurity.
The food insecurity aversion parameter ‘α’ implies the concern attached to the proportionate shortfall from the food security line. If α = 0 then, FGT measures correspond to the headcount index (incidence of food security) with no space for the depth of the shortfall shown. It is the share of households whose food consumption per adult equivalent is below the food security line (Haughton & Khandker, Citation2009).
If α = 1 then, FGT refers to the food insecurity gap – the extent to which individuals on average fall below the poverty line, and expresses it as a percentage of the poverty line (Haughton & Khandker, Citation2009). A high gap index shows a larger portion of the population being ‘extremely poor’, while a lower one shows a smaller portion of the population being ‘extremely poor’.
If α = 2 then, FGT measures the squared gap of food insecurity or severity of food insecurity. It considers not only how far the food insecure are from the line of food security but also inequality among the food insecure households (Haughton & Khandker, Citation2009).
3.2. Analysis of determinant variables of food security
To identify the determinant factors for households’ food security, we used a binary logistic model (Ahmed et al., Citation2017; Derso et al., Citation2021; Mengistu et al., Citation2022). The main reason for using the logit model was that we had a binary dependent variable. Accordingly, the model was adopted to analyze the relationship between the dependent variable (i.e. food security status) and the explanatory variables. The model predicts the log odds of the binary dependent variable taking the value of 1. The general logistic regression model can be illustrated as follows:
(6)
(6)
where
= the probability that household i is food secure, that is prob. (
),
is the intercept,
is the estimated coefficients of the independent variables,
is the vector of the independent variables used and
the error term.
The overall goodness of fit of the binary logistic model was tested using the Hosmer and Lemeshow (H-L) test, and pseudo-R2.
We identified potential explanatory variables for the logistic model by consulting scientific literature (Abegaz, Citation2017; Ahmed et al., Citation2017; Alpízar et al., Citation2020; Derso et al., Citation2021; Frelat et al., Citation2016; Smith et al., Citation2017), and accordingly, socio-demographic, economic, institutional and environmental characteristics were considered as household characteristics. We used 20 variables in the logistic model along with the summary of descriptive statistics and hypothesized relations for this study presented in . Later, age was removed as a predictor variable due to high multicollinearity effects.
Table 1. Description of the dependent and independent variables used in the logit model.
4. Results
4.1. Household characteristics
presents the descriptive statistics for the predictor variables of the study. The age and family size of the participating households range from 26 to 75 years (mean = 45.1, SD = 9.6) and from 1 to 12 (mean = 6.29), respectively. About 16% of the households had less than 2 family sizes, 14.5% had 2–4 household sizes, 35% had 4–6 household sizes, 20.7% had 6–8 household sizes and 14% had 8 or more. Approximately 39% of the households were economically inactive, aged below 15 years, or 65 and above. About 37% diversified their livelihoods in off-farm activities, 35% used fertilizer and 44% used improved seeds as inputs for their agriculture. While 87% produced wheat, 53.3% produced maize as a staple crop. The per capita average calorie intake per person per day was 2,182.26 kcal per day. displays other background characteristics below.
Table 2. Background characteristics of respondents in Bugna district, 2020.
4.2. Food security status of the households
displays the summary results of the food security indicators. Of the 353 smallholder farming households, approximately half (49.3%) were found to be food insecure as they had a per capita caloric intake of less than the threshold (2,100 kcal/day). The average daily calorie consumption of food-secure households was 2,475.6 kcal, while that of food-insecure households was 1,880 kcal. The shortfall and surplus indices were 10.5% and 18%, respectively. The Food Insecurity Gap or the depth of food insecurity was 5.2% and the Squared Food Insecurity Gap or the severity index was approximately 1%.
Table 3. Statistics of food security indicators (N = 353).
We investigated whether there were differences among households by the status of food security using Pearson’s chi-square test for the categorical predictor variables and an independent samples t-test for the continuous predictor variables. The Chi-square results, presented in , show that the level of food security has a significant relationship with some characteristics of households, including the literacy of the head of the household; access to drinking water, use of fertilizer, off-farm activities, access to credit, access to extension services, access to health services, use of improved seeds, being maize producer and being wheat producer.
Table 4. Difference among households by the status of food security for categorical variables.
According to the t-test results, , the mean household size of food-secure households (4.17) was significantly different from the mean household size of food-insecure households (6.05). The average livestock (TLU) possession of food-secure households (2.47) was also significantly different from the average livestock size owned by food-insecure households (1.77). The average crop production in quintal of food secure households (6.45) was significantly different from that of food insecure households (5.36). Also, average income (in ETB) of food secure households (13,682.34) is significantly higher than the food insecure households’ (11,250.61). Finally, the average distance from home to the market of food-secure households (3.44 km) was significantly different from the average distance to the market of food-insecure households (4.42 km).
Table 5. Difference among households by the status of food security for continuous variables.
4.3. Determinant factors of food security
The log-likelihood ratio chi-square test statistic for the model indicates that the overall model with all the predictor variables was significant. indicates that the model had a good fit, and the Hosmer and Lemeshow test result was nonsignificant (Chi2(8) 12.94, p = 0.1138)
.
Table 6. Binary logistic regression results of food security (n = 353).
According to the binary logit model, 9 of the 21 predictor variables were significant. Such variables include educational status, household size, social linkage and migration experience from the socio-demographic variables; number of mules owned by households and whether households are maize producers from the economic variables; access to drinking water and use of fertilizer from the institutional variables; and farmland topography (plain) from the environmental variables. These were all significant predictors of the status of smallholder farming households in the study district.
Other variables remain constant, the education background predictor (OR = 3.88) indicated that the odds of food security for a literate-headed household were almost four times the odds for a household headed by an illiterate one holding other predictors constant. Family size (OR = 0.74) indicated that the odds of food insecurity increased by a factor of 0.74 for each household unit added. Social linkage (OR = 3.05) indicated that the odds of food security for a household head with social interaction were three times the odds for a household head with no social linkages. The odds of food security for a household with migration experience were 2.61 times the odds for a household who did not have migration experience.
In the economic variables, the number of mules a household owned (OR = 3.24) indicated that for a unit increase in the number of mules by a household, the odds of food security increased by 3.24 times. The maize producer (OR = 2.02) indicated that the odds of food security for a maize-producing household were two times the odds for a non-maize-producing household.
In the institutional variables, access to drinking water (OR = 3.11) indicated that the odds of food security for a household with access to drinking water were three times higher than the odds for a household with no access. Use of fertilizer (OR = 5.33) indicated that the odds of food security for a smallholder farming household that used fertilizer in crop production were 5.33 times higher than the odds for a household that did not use fertilizer.
From the environmental variables, farmland topography/plain (OR = 2.7) indicated that the odds of food security for a smallholder farming household who own farmland in plain topography were almost three times higher than the odds for owning farmlands in non-plain topographies.
4.4. Coping strategies for food insecurity
Our survey results show that farmers in Bugna district cope with food insecurity in different ways. As presented in , the major coping strategies employed by the farming households to combat food insecurity are:
Figure 2. Coping strategies of food insecurity by farming households in Bugna, northern Ethiopia.
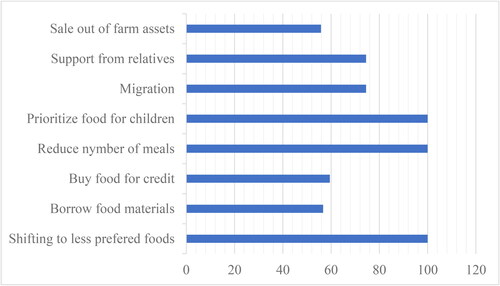
Shifting to less preferred foods: all households (100%) employ this strategy, and it could indicate lack of access to preferred food items, possibly due to cost or availability issues.
Borrowing food materials: More than half of the households (56.7%) resort to borrowing food, suggesting a strong community support system during times of shortage of food.
Buying food on credit: This is used by 59.5% of households, indicating that some households may be facing financial constraints that prevent them from buying food outright.
Reducing the number of meals: All households (100%) reported reducing the number of meals, which is a serious indicator of food insecurity.
Prioritizing food for children: All households (100%) prioritize feeding their children, highlighting the sacrifices adults are willing to make to ensure their children’s nutritional needs are met.
Migration: A significant proportion of households (74.5%) reported migration as a coping strategy, which may suggest that local conditions may be so challenging that people feel compelled to seek opportunities elsewhere.
Support from relatives: This is a strategy for 74.5% of households, which may indicate the importance of extended family networks in providing support.
Sale of farm assets: Over half of the households (55.8%) resort to selling farm assets, which could provide immediate relief but might undermine their long-term agricultural productivity.
These strategies reflect the severity of food insecurity in the Bugna district and underscore the need for interventions to improve food availability and affordability.
5. Discussions
5.1. The condition of food insecurity among smallholder farmers
The prevalence of food insecurity among smallholder farmers in northern Ethiopia is a major concern, with nearly half (49.3%) of households unable to meet the minimum energy requirement for a healthy and active life. This finding is substantiated by the fact that the average poverty gap among food-insecure households was 5.2%, with a small but significant proportion (0.81%) facing a severe food insecurity situation. This problem is not unique to northern Ethiopia; similar high levels of food insecurity were reported in various parts of the country, as evidenced by studies conducted by Agidew and Singh (Citation2018), Mengistu et al. (Citation2022), Mota et al. (Citation2019) and Sani and Kemaw (Citation2019). Moreover, this problem extends beyond national borders, with Western Africa also struggling with food insecurity, as highlighted by Zakari et al. (Citation2014). These findings suggest the need for interventions, including increasing agricultural productivity, improving access to markets, and enhancing the resilience of smallholders to shocks to improve food security among smallholder farmers in northern Ethiopia.
The distribution of available calorie intake reveals that approximately 29% of farmers are precariously close to the food security line, indicating a state of vulnerability. While the number of households with severe food insecurity is relatively small, a significant proportion of the households are clustered around the food security line, as depicted in .
Figure 3. The distribution of available kcal in AE in Bugna, northern Ethiopia, 2020.
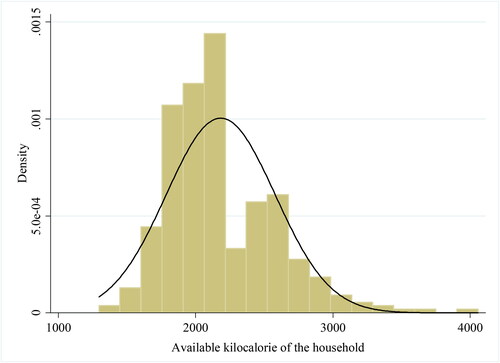
This clustering suggests a precarious balance; these households are teetering on the edge of food insecurity, and their status could easily tip toward insecurity given the poor production seasons frequently experienced in the region. However, it also implies that improvements in production could potentially push these households toward food security.
Despite this potential for improvement, it is important also to note the escalating problem of food insecurity in Sub-Saharan Africa due to factors such as conflict, political instability and severe climate events. Climate change with its frequent extreme events triggers food insecurity particularly in countries heavily relying on agriculture (Beltran‐Peña & D’Odorico, Citation2022; Hall et al., Citation2017; Pickson & Boateng, Citation2022). This underscores the need for comprehensive strategies that not only enhance agricultural productivity but also address these broader socio-political and environmental challenges (FAO & OECD, Citation2018).
5.2. Determinant factors of food security
The study’s findings reveal that food insecurity among smallholder farming households is influenced by a combination of sociodemographic, economic, institutional and physical factors. Key factors, as presented in , include literacy level, family size, migration experience, social linkages, number of mules owned by the household, access to drinking water, use of fertilizer, being a maize producer and farm topography.
Large family sizes were found to increase the risk of food insecurity, a finding consistent with previous studies (Ayele et al., Citation2020; Cheema et al., Citation2022; Derso et al., Citation2021; Mota et al., Citation2019; Mutisya et al., Citation2016). This suggests that an increase in household size may increase the number of nonproductive members like children and hence increase the burden of getting more food with limited resources. Large family size also hampers the likelihood of households’ livelihood diversification (Gebru et al., Citation2018). Similar findings have been reported in other developing countries (Ahmed et al., Citation2017; Alpízar et al., Citation2020) that households with larger family sizes are highly likely to be food insecure.
Gender wise, there was no difference in food security status among male headed and female headed households in Bugna district. Similar findings were reported in different studies (Aryal et al., Citation2018; Getaneh et al., Citation2022). In other studies, due to factors associated with social norms, knowledge and skill gaps, and low decision-making power female headed households were more vulnerable to food insecurity that their counterpart (Awoke et al., Citation2022; Bahiru et al., Citation2023; Tambe et al., Citation2023).
Education played a positive and significant role in influencing the food security condition of farming households. Education improves the level of understanding of agricultural technologies, implementation of on-farm and off-farm adaptations (d’Errico et al., Citation2018; Gebru et al., Citation2018), and labor productivity to support farming households get better food supply. This finding suggests the importance of linking education and training as components of agricultural interventions targeting the improvement of food security.
Social linkages were found to significantly influence households’ food security status. Household heads who take part in social activities such as public work programs are less likely to suffer from food insecurity (Devereux, Citation2016). Social linkages are important for information transfer among people and hence labor productivity. Lack of information was found to be positively associated with food insecurity (Pakravan-Charvadeh et al., Citation2021).
Migration experience was found to significantly influence households’ food security status. Migrating households are less likely to suffer from food insecurity. Agriculture in the study area is rain-fed based and, hence, seasonal. And farmers migrate to sell their labor and skills and generate income to support their families, hence migration can help diversify livelihoods and income sources (Jha et al., Citation2018; Vinke et al., Citation2020). Conversely, when agriculture is not mechanized and the role of new technologies is limited, human labor is essential for the processes of land preparation, weeding and harvesting (Zakari et al., Citation2014). In this case, migration reduces family labor and exposes farming households to the risk of food insecurity (Alpízar et al., Citation2020). The important thing highlighted here should be the incorporation of livelihood diversification as a policy intervention to reduce food insecurity among smallholder farmers.
Farm assets play a crucial role in ensuring food security. The sale of these assets, particularly during difficult times, can indeed lead to a variety of problems, including increased costs for services and potential loss of farmlands, which can negatively impact agriculture income and food security (Alpízar et al., Citation2020). Households that have more livestock (Ayele et al., Citation2020; Bakhtsiyarava et al., Citation2021) are highly likely to be food secure.
The ownership and health of livestock, such as mules and donkeys, are also significant factors in food security. These animals not only serve as means of transportation but also contribute to income generation and economic security (Ayele et al., Citation2020; Bakhtsiyarava et al., Citation2021; Clancy et al., Citation2022; Geiger et al., Citation2020; Gichure et al., Citation2020). Thus, encouraging farming households through diverse social protection programs to accumulate farm assets may support and reduce the problem of food insecurity.
The topography of farmland is another important factor. Farmland is an important asset for smallholder farming households’ food security (Alpízar et al., Citation2020). However, the topography and its fertility determine the level of support it gives to the farming community (Hoylman et al., Citation2019; Yuan et al., Citation2019). Our study revealed that farmers whose farmlands are not plain have a higher risk of food insecurity. Erosion and land degradation are serious problems of rugged topography (Yadav et al., Citation2019), which can lead to lower crop productivity and increased risk of food insecurity. Farmland size (landholding size), however, was not significantly influencing food security status among smallholder farmers as to our findings. Many studies (Bahiru et al., Citation2023; Getaneh et al., Citation2022; Herrera et al., Citation2021; Woleba et al., Citation2023) reported a positive influence of farmland size to food security. More land implies the possibility of growing more crops, which supports farming households for better status of food security. However, the productivity of land decreases in households having more farmland size (Awoke et al., Citation2022; Frelat et al., Citation2016). Large farmland size requires more investment costs in terms of use of fertilizer, use of improved seeds and land conservation practices. This cost leads smallholder farmers, which are mostly subsistence, into financial constraints and opt to practice agriculture extensively to result low productivity.
The type of crops farmers cultivate also influences their food security status. This study found that smallholder farmers who produce maize are less likely to experience food insecurity than those producing other crops. Improved maize varieties better contribute to household food security in South Africa (Jaleta et al., Citation2018; Sinyolo, Citation2020). However, challenges such as land degradation, water shortage and climate change can significantly affect maize production (Grote et al., Citation2021). We recommend further studies in this area.
The use of agricultural technology like fertilizer significantly influences the food security of smallholder farmers. The use of fertilizer could enhance the capacity of land to produce more food (Ehrlich et al., Citation1993; Wang, Citation2022). However, with the current surge in fertilizer prices, it is becoming difficult for farmers in Ethiopia to continue using them. Hence, policy interventions on the enhanced use of bio-organic fertilizer with reduced use of chemical fertilizer may be an option to improve production and productivity (Ye et al., Citation2020).
Lastly, access to drinking water significantly influences households’ food security status (Nounkeu & Dharod, Citation2020; Sotoudeh et al., Citation2021). Farmers with access to drinking water were found less susceptible to the risk of food insecurity in the study area. Access to drinking water impacts the health and well-being of people (Ashley, Citation2016). Improved access to drinking water reduces their vulnerability to waterborne diseases, thereby boosting their productivity (Abafita & Kim, Citation2014; Hanjra & Qureshi, Citation2010). In rural Ethiopia, where clean water is scarce, individuals spend significant time and energy collecting water, which detracts them from other crucial activities such as food production and income generation. Hence, by ensuring access to potable water, farmers can maintain their health and productivity, indirectly bolstering food security (Ashley, Citation2016; FAO et al., 2023; Tantoh, Citation2023).
5.3. Coping strategies for food insecurity
Our survey results show many copping strategies smallholder famers in Bugna district follow during the time of food insecurity. The coping strategies employed by the farming households provide valuable insights into the lived realities of these households. Shifting to less preferred foods, reducing the number of meals, and prioritizing food for children were employed universally by the smallholders to combat food insecurity. These strategies are among the severe coping mechanisms indicating a high level of food insecurity in the region (Amoah & Simatele, Citation2021). Moreover, they are short-term solutions that can result in long-term health implications due to potential nutritional deficiencies, particularly in adults (WFP, Citation2022). The strategies such as borrowing food or buying food on credit, support from relatives, and migration highlighted the role of social linkages in coping with food insecurity (Amoah & Simatele, Citation2021; Bahta, Citation2022). Sale of farm assets, however, is a distress strategy that can undermine the household’s food production capacity taken as a last resort when other options are exhausted (Ansah et al., Citation2020; Khatri-Chhetri & Maharjan, Citation2006). Generally, these strategies reflect the resilience and adaptability of farming households in Bugna in the face of food insecurity. Nevertheless, they have important policy implications. Improving the availability of food items could address the issue of shifting to less preferred foods (Shakeel & Shazli, Citation2020). Interventions related to financial support aimed at enhancing the income-generating capacity of farmers may lessen the vulnerability to debts due to borrowing money and food materials (Gajda & Jeżewska-Zychowicz, Citation2021; Shakeel & Shazli, Citation2020). Ensuring adequate food supply and nutrition through emergency food aid to farming households may reduce the reported reduction in meal frequency and prioritization of children’s nutritional needs (Loopstra, Citation2018; Shakeel & Shazli, Citation2020). Social protection programs that can also provide support in times of crisis without compromising future productivity could prevent the need for selling farm assets (Amoah & Simatele, Citation2021; Bahta, Citation2022; Loopstra, Citation2018). They also underline the need for more sustainable solutions to address the root causes of food insecurity, such as improving agricultural productivity, enhancing access to markets and financial services, and strengthening social safety nets (Amoah & Simatele, Citation2021; Bahta, Citation2022; Ndungu et al., Citation2021; WFP, Citation2022).
6. Conclusions
This study provides a comprehensive analysis of the factors influencing food security and coping strategies among smallholder farmers in northern Ethiopia. It reveals that food insecurity is still a major issue among smallholder farmers in the region, with nearly half of the households unable to meet the minimum energy requirement for a healthy and active life. A significant proportion of these households are on the brink of food insecurity, which could worsen with a poor production season, as rain-fed agriculture is the predominant source of livelihood for them. However, improvements in production could potentially push these households towards food security.
The study also reveals that food insecurity in northern Ethiopia is influenced by a combination of sociodemographic, economic, institutional and physical factors. Larger family sizes, lower literacy levels, lack of social linkages and limited migration experience can increase the risk of food insecurity. Conversely, ownership of farm assets, particularly livestock, the topography of farmland, the type of crops cultivated and the use of agricultural technology like fertilizer can enhance food security. However, challenges such as land degradation, water shortage, climate change and rising fertilizer prices pose significant threats. Access to drinking water is also crucial for maintaining health and productivity.
The coping strategies reported by the farmers are consistent with various studies on food insecurity. They reflect the resilience and adaptability of the farming households; however, the need for more sustainable solutions to address the root causes of food insecurity, such as improving agricultural productivity, enhancing access to financial and market services and strengthening social safety nets are underlined for improving food security among smallholder farmers.
Ethics approval and consent to participate
The Postgraduate Committee of the Department of Geography and Environmental Studies at Mekelle University approved the research proposal including its ethical procedures, before data collection began. Consents were obtained from the participants and their data were kept confidential.
Consent for publication
Participants were informed that data would be shared widely while kept anonymous.
Author contributions
All authors contributed to the study. MG and SB planned, prepared materials, collected data, and analyzed and drafted the manuscript. BD, HM, TWG and AGA provided critical reviews and editing on the draft and final versions of the manuscript. After several reviews and edits, all authors read and approved the final manuscript.
Acknowledgment
The authors are grateful to the smallholder farmers for participating in the survey, and they also acknowledge Mekelle University for funding the research work.
Disclosure statement
The authors declare that they have no competing interests.
Availability of data and materials
The datasets used and/or analyzed in this study are available upon reasonable request from the corresponding author.
Additional information
Notes on contributors
Misgina Gebrehiwot
Misgina Gebrehiwot is a faculty staff of Mekelle University in norther Ethiopia. He earned his M.A in Development studies from Addis Ababa University, Ethiopia and his PhD in Geography from Osmania University (India). His research areas include Urban and Regional Development, Food Security, Smallholder Agriculture Adaptation to Climate Change, Drought Analysis, and Population Studies.
Biadgilgn Demisse
Biadgilgn Demisse has been a faculty staff of Mekelle University in Ethiopia. He is a postdoctoral researcher at the Universite Libre de Bruxelles, Belgium. Currently, he works on flood mapping using open-access data, Twitter data, and open-source solutions applicable to Sub-Sahara Africa urban regions. He has worked on flood resilience, landscape changes, and researches that involve livelihood in northern Ethiopia.
Hailemariam Meaza
Hailemariam Meaza has been working at Mekelle University in Ethiopia since 2006. He holds an MSc in Sustainable Use of Natural Resources from the University of Life Sciences (Norway) (2011) and earned a PhD in Geography from Ghent University (Belgium) in 2018. His researches focus on integrated land and water management in drylands, as well as agriculture and food security.
Tafesse W. Gezahegn
Tafesse W. Gezahegn is an Assistant Professor at Mekelle University, Ethiopia. He earned his PhD in Agricultural Economics from KU Leuven, Belgium, and his MSc in Environmental Economics and Natural Resources from Wageningen University, the Netherlands. His research interests focus on the Economics of Agriculture, Natural Resources, Development, and Institutions.
Aradom Gebrekidan Abbay
Aradom Gebrekidan Abbay is working as an assistant professor of development studies at Mekelle University. He earned his PhD from Tilburg University, the Netherlands. He is interested in researches related to livelihoods, social capital, social fabric, social status, economic geography, community development, migration and food security.
Sisay Beyene
Sisay Beyene is a faculty staff of Mekdela Amba University, Ethiopia. He holds his Masters degree from Mekelle University, Ethiopia in Geography and Environmental Studies. His research interest includes food security, natural resource management and environmental sustainability.
References
- Abafita, J., & Kim, K.-R. (2014). Determinants of household food security in rural Ethiopia: An empirical analysis. Journal of Rural Development, 37(2), 129–157. https://doi.org/10.22004/ag.econ.196613
- Abegaz, K. H. (2017). Determinants of food security: Evidence from Ethiopian Rural Household Survey (ERHS) using pooled cross-sectional study. Agriculture & Food Security, 6(1), 1–7. https://doi.org/10.1186/s40066-017-0153-1
- Agidew, A.-m. A., & Singh, K. N. (2018). Determinants of food insecurity in the rural farm households in South Wollo Zone of Ethiopia: The case of the Teleyayen sub-watershed. Agricultural and Food Economics, 6(10), 1–23. https://doi.org/10.1186/s40100-018-0106-4
- Ahmed, U. I., Ying, L., Bashir, M. K., Abid, M., & Zulfiqar, F. (2017). Status and determinants of small farming households’ food security and role of market access in enhancing food security in rural Pakistan. PLoS One, 12(10), e0185466. https://doi.org/10.1371/journal.pone.0185466
- Alpízar, F., Saborío-Rodríguez, M., Martínez-Rodríguez, M. R., Viguera, B., Vignola, R., Capitán, T., & Harvey, C. A. (2020). Determinants of food insecurity among smallholder farmer households in Central America: Recurrent versus extreme weather-driven events. Regional Environmental Change, 20(22), 1–16. https://doi.org/10.1007/s10113-020-01592-y
- Amoah, L. N. A., & Simatele, M. D. (2021). Food security and coping strategies of rural household livelihoods to climate change in the Eastern Cape of South Africa. Frontiers in Sustainable Food Systems, 5, 1–10. https://doi.org/10.3389/fsufs.2021.692185
- Andualem, T. (2016). A review on cattle husbandry practices in Ethiopia. International Journal of Livestock Production, 7(2), 5–11. https://doi.org/10.5897/IJLP2015.0276
- Ansah, I. G. K., Gardebroek, C., & Ihle, R. (2020). Shock interactions, coping strategy choices and household food security. Climate and Development, 13(5), 414–426. https://doi.org/10.1080/17565529.2020.1785832
- Aryal, J. P., Mottaleb, K. A., & Rahut, D. B. (2018). Untangling gender differentiated food security gaps in Bhutan: An application of exogenous switching treatment regression. Review of Development Economics, 23(2), 782–802. https://doi.org/10.1111/rode.12566
- Ashley, J. M. (2016). Food security in the developing world. Elsevier. https://doi.org/10.1016/B978-0-12-801594-0.00001-4
- Awoke, W., Eniyew, K., Agitew, G., Meseret, B., & Read, R. (2022). Determinants of food security status of household in Central and North Gondar Zone, Ethiopia. Cogent Social Sciences, 8(1), 1–12. https://doi.org/10.1080/23311886.2022.2040138
- Ayal, D. Y., W/Michael, T., Getahun, A. B., Ture, K., Zeleke, T. T., & Tesfaye, B. (2023). Climate variability induced household food insecurity coping strategy in Gambella Zuria Woreda, Southwestern, Ethiopia. Climate Services, 30, 100382. https://doi.org/10.1016/j.cliser.2023.100382
- Ayele, A. W., Kassa, M., Fentahun, Y., & Edmealem, H. (2020). Prevalence and associated factors for rural households food insecurity in selected districts of east Gojjam zone, northern Ethiopia: Cross-sectional study. BMC Public Health, 20(1), 202. https://doi.org/10.1186/s12889-020-8220-0
- Ayele, T. (2020). A review of the trends and causes of food insecurity in Ethiopia. Food Science and Quality Management, 99, 7–12. https://doi.org/10.7176/FSQM/99-02
- Babu, S. C., Gajanan, S. N., & Sanyal, P. (2014). Introduction to food security: Concepts and measurement. In S. C. Babu, S. N., Gajanan, & P. Sanyal (Eds.), Food security, poverty and nutrition policy analysis: Statistical methods and applications (2nd ed., pp. 7–28). Elsevier. https://doi.org/10.1016/b978-0-12-405864-4.00001-6
- Bahiru, A., Senapathy, M., & Bojago, E. (2023). Status of household food security, its determinants, and coping strategies in the Humbo district, Southern Ethiopia. Journal of Agriculture and Food Research, 11, 100461. https://doi.org/10.1016/j.jafr.2022.100461
- Bahta, Y. T. (2022). Nexus between coping strategies and households’ agricultural drought resilience to food insecurity in South Africa. Land, 11(6), 893. https://doi.org/10.3390/land11060893
- Bakhtsiyarava, M., Williams, T. G., Verdin, A., & Guikema, S. D. (2021). A nonparametric analysis of household-level food insecurity and its determinant factors: Exploratory study in Ethiopia and Nigeria. Food Security, 13(1), 55–70. https://doi.org/10.1007/s12571-020-01132-w
- Barrett, C. B. (2010). Measuring food insecurity. Science (New York, N.Y.), 327(5967), 825–828. https://doi.org/10.1126/science.1182768
- Beltran‐Peña, A., & D’Odorico, P. (2022). Future food security in Africa under climate change. Earth’s Future, 10(9), 1–20. https://doi.org/10.1029/2022EF002651
- BFS/USAID. (2017). Climate-smart agriculture in Ethiopia, CSA country profiles for Africa series. https://hdl.handle.net/10568/92491
- Booth, S., & Pollard, C. M. (2020). Food insecurity, food crimes and structural violence: An Australian perspective. Australian and New Zealand Journal of Public Health, 44(2), 87–88. https://doi.org/10.1111/1753-6405.12977
- Cafiero, C., Viviani, S., & Nord, M. (2018). Food security measurement in a global context: The food insecurity experience scale. Measurement, 116, 146–152. https://doi.org/10.1016/j.measurement.2017.10.065
- Central Statistical Agency (CSA). (2019). Agricultural sample survey 2018/19: A report on area and production of major crops [Statistical Bulletin]. Addis Ababa, Ethiopia
- Central Statistical Agency (CSA). (2020). Agriculture sample survey 2019/20: Report on farm management practices [Statistical Bulletin].
- Cheema, A. R., Saleem, A., Visas, H., & Ul-Haq, J. (2022). Role of education, age, and family size on food insecurity in Pakistan: A quantile regression analysis. The European Journal of Development Research, 34(5), 2576–2597. https://doi.org/10.1057/s41287-021-00479-w
- Clancy, C., Watson, T., & Raw, Z. (2022). Resilience and the role of equids in humanitarian crises. Disasters, 46(4), 1075–1097. https://doi.org/10.1111/disa.12501
- d’Errico, M., Romano, D., & Pietrelli, R. (2018). Household resilience to food insecurity: Evidence from Tanzania and Uganda. Food Security, 10(4), 1033–1054. https://doi.org/10.1007/s12571-018-0820-5
- Derso, A., Bizuneh, H., Keleb, A., Ademas, A., & Adane, M. (2021). Food insecurity status and determinants among urban productive safety net program beneficiary households in Addis Ababa, Ethiopia. PLoS One, 16(9), e0256634. https://doi.org/10.1371/journal.pone.0256634
- Devereux, S. (2016). Social protection for enhanced food security in sub-Saharan Africa. Food Policy, 60, 52–62. https://doi.org/10.1016/j.foodpol.2015.03.009
- Drimie, S., & Pereira, L. (2016). Advances in food security and sustainability in South Africa. In D. Barling (Ed.), Advances in food security and sustainability (Vol. 1). Elsevier Inc.
- Ehrlich, P. R., Ehrlich, A. H., & Daily, G. C. (1993). Food security, population and environment. Population and Development Review, 19(1), 1. https://doi.org/10.2307/2938383
- Ethiopian Statistical Services (ESS). (2022). Area and production of major crops (Private and peasant holding, Meher season) [Statistical Bulletin]. Addis Ababa, Ethiopia
- FAO. (1996). Rome declaration on World Food Security and World Food Summit Plan of Action. Paper Presented at the World Food Summit, Rome, Italy.
- FAO. (2014). Revision of the methodology for the estimation of the Prevalence of Undernourishment. FAO Statistics Division.
- FAO, IFAD, UNICEF, WFP, & WHO. (2019). The state of food security and nutrition in the world 2019: Safeguarding against economic slowdowns and downturns. https://www.fao.org/3/ca5162en/ca5162en.pdf
- FAO, IFAD, UNICEF, WFP, & WHO. (2023). The state of food security and nutrition in the world 2023. https://doi.org/10.4060/cc3017en
- FAO & OECD. (2018). Food security and nutrition: Challenges for agriculture and the hidden potential of soil: A report to The G20 Agriculture Deputies. OECD.
- FDRE. (2019). National food and nutrition strategy. Federal Democratic Republic of Ethiopia.
- Field, C. B., Barros, V. R., Dokken, D. J., Mach, K. J., & Mastrandrea, M. D. (2014). Food security and food production systems. In C. B. Field, V. R. Barros, D. J. Dokken, K. J. Mach, M. D. Mastrandrea, T. E. Bilir, Chatterjee, K. L. Ebi, Y. O. Estrada, R. C. Genova, B. Girma, E. S. Kissel, A. N. Levy, S. MacCracken, P. R. Mastrandrea, & L. L. White (Eds.), Climate Change 2014 Impacts, Adaptation, and Vulnerability. Part A:Global and Sectoral Aspects. Contribution of Working Group II to the Fifth Assessment Report of the Intergovernmental Panel on Climate Change. Cambridge University Press (pp. 485–534). https://doi.org/10.1017/cbo9781107415379.012
- Foster, J., Greer, J., & Thorbecke, E. (1984). A class of decomposable poverty measures. Econometrica, 52(3), 761–766. https://doi.org/10.2307/1913475
- Frelat, R., Lopez-Ridaura, S., Giller, K. E., Herrero, M., Douxchamps, S., Andersson Djurfeldt, A., Erenstein, O., Henderson, B., Kassie, M., Paul, B. K., Rigolot, C., Ritzema, R. S., Rodriguez, D., van Asten, P. J., & van Wijk, M. T. (2016). Drivers of household food availability in sub-Saharan Africa based on big data from small farms. Proceedings of the National Academy of Sciences of the United States of America, 113(2), 458–463. https://doi.org/10.1073/pnas.1518384112
- Food Security Information Network (FSIN) & Global Network against Food Crises (GNAFC). (2023). Global report on food crises 2023.
- Gajda, R., & Jeżewska-Zychowicz, M. (2021). The importance of social financial support in reducing food insecurity among elderly people. Food Security, 13(3), 717–727. https://doi.org/10.1007/s12571-021-01151-1
- Gebru, G. W., Ichoku, H. E., & Phil-Eze, P. O. (2018). Determinants of livelihood diversification strategies in Eastern Tigray Region of Ethiopia. Agriculture & Food Security, 7(1), 1–9. https://doi.org/10.1186/s40066-018-0214-0
- Geiger, M., Hockenhull, J., Buller, H., Tefera Engida, G., Getachew, M., Burden, F. A., & Whay, H. R. (2020). Understanding the attitudes of communities to the social, economic, and cultural importance of working donkeys in rural, peri-urban, and urban areas of Ethiopia. Frontiers in Veterinary Science, 7, 60. https://doi.org/10.3389/fvets.2020.00060
- Getaneh, Y., Alemu, A., Ganewo, Z., & Haile, A. (2022). Food security status and determinants in North-Eastern rift valley of Ethiopia. Journal of Agriculture and Food Research, 8, 100290. https://doi.org/10.1016/j.jafr.2022.100290
- Gichure, M., Onono, J., Wahome, R., & Gathura, P. (2020). Analysis of the benefits and production challenges of working donkeys in smallholder farming systems in Kenya. Veterinary World, 13(11), 2346–2352. https://doi.org/10.14202/vetworld.2020.2346-2352
- Global Food Security Index. (2022). Country profiles. Economist Impact 2022. https://impact.economist.com/sustainability/project/food-security-index/explore-countries
- Grote, U., Fasse, A., Nguyen, T. T., & Erenstein, O. (2021). Food security and the dynamics of wheat and maize value chains in Africa and Asia. Frontiers in Sustainable Food Systems, 4, 1–17. https://doi.org/10.3389/fsufs.2020.617009
- Hall, C., Dawson, T. P., Macdiarmid, J. I., Matthews, R. B., & Smith, P. (2017). The impact of population growth and climate change on food security in Africa: Looking ahead to 2050. International Journal of Agricultural Sustainability, 15(2), 124–135. https://doi.org/10.1080/14735903.2017.1293929
- Hanjra, M. A., & Qureshi, M. E. (2010). Global water crisis and future food security in an era of climate change. Food Policy. 35(5), 365–377. https://doi.org/10.1016/j.foodpol.2010.05.006
- Haughton, J., & Khandker, S. R. (2009). Handbook on poverty and inequality. The World Bank. https://doi.org/10.1596/978-0-8213-7613-3
- Hendriks, S., Soussana, J.-F., Cole, M., Kambugu, A., & Zilberman, D. (2023). Ensuring access to safe and nutritious food for all through the transformation of food systems. In J. von Braun, K. Afsana, L. O. Fresco, & M. H. A. Hassen (Eds.), Science and innovations for food systems transformation (pp. 31–58). Springer. https://doi.org/10.1007/978-3-031-15703-5_4
- Herrera, J. P., Rabezara, J. Y., Ravelomanantsoa, N. A. F., Metz, M., France, C., Owens, A., Pender, M., Nunn, C. L., & Kramer, R. A. (2021). Food insecurity related to agricultural practices and household characteristics in rural communities of northeast Madagascar. Food Security, 13(6), 1393–1405. https://doi.org/10.1007/s12571-021-01179-3
- Hoylman, Z. H., Jencso, K. G., Hu, J., Holden, Z. A., Allred, B., Dobrowski, S., Robinson, N., Martin, J. T., Affleck, D., & Seielstad, C. (2019). The topographic signature of ecosystem climate sensitivity in the western United States. Geophysical Research Letters, 46(24), 14508–14520. https://doi.org/10.1029/2019GL085546
- IFPRI. (2019). The 2019 global food policy report. I. International Food Policy Research Institute.
- Jaleta, M., Kassie, M., Marenya, P., Yirga, C., & Erenstein, O. (2018). Impact of improved maize adoption on household food security of maize producing smallholder farmers in Ethiopia. Food Security, 10(1), 81–93. https://doi.org/10.1007/s12571-017-0759-y
- Jha, C. K., Gupta, V., Chattopadhyay, U., & Amarayil Sreeraman, B. (2018). Migration as adaptation strategy to cope with climate change. International Journal of Climate Change Strategies and Management, 10(1), 121–141. https://doi.org/10.1108/IJCCSM-03-2017-0059
- Jones, A. D. (2017). Food insecurity and mental health status: A global analysis of 149 countries. American Journal of Preventive Medicine, 53(2), 264–273. https://doi.org/10.1016/j.amepre.2017.04.008
- Jones, A. D., Ngure, F. M., Pelto, G., & Young, S. L. (2013). What are we assessing when we measure food security? A compendium and review of current metrics. Advances in Nutrition (Bethesda, Md.), 4(5), 481–505. https://doi.org/10.3945/an.113.004119
- Khatri-Chhetri, A., & Maharjan, K. L. (2006). Food insecurity and coping strategies in rural areas of Nepal. Journal of International Development and Cooperation, 12(2), 25–45.
- Kothari, C. R. (2004). Research methodology: Methods and techniques. New Age International. ISBN (13): 978-81-224-2488-1.
- Loopstra, R. (2018). Interventions to address household food insecurity in high-income countries. The Proceedings of the Nutrition Society, 77(3), 270–281. https://doi.org/10.1017/S002966511800006X
- Mekonnen, D. A., & Gerber, N. (2017). Aspirations and food security in rural Ethiopia. Food Security, 9(2), 371–385. https://doi.org/10.1007/s12571-017-0654-6
- Mengistu, S. W., Kassie, A. W., & Gonz Lez Fandos, E. (2022). Household level determinants of food insecurity in rural Ethiopia. Journal of Food Quality, 2022, 1–9. https://doi.org/10.1155/2022/3569950
- Mota, A. A., Lachore, S. T., & Handiso, Y. H. (2019). Assessment of food insecurity and its determinants in the rural households in Damot Gale Woreda, Wolaita zone, southern Ethiopia. Agriculture & Food Security, 8(1), 1–11. https://doi.org/10.1186/s40066-019-0254-0
- Mutisya, M., Ngware, M. W., Kabiru, C. W., & Kandala, N.-b. (2016). The effect of education on household food security in two informal urban settlements in Kenya: A longitudinal analysis. Food Security, 8(4), 743–756. https://doi.org/10.1007/s12571-016-0589-3
- Ndungu, C. K., Mutunga, E. J., Mwangi, M., & Kariuki, P. C. (2021). Food insecurity coping strategies and determinants of households’ choice of specific coping strategies in Kitui County, Kenya. Journal of Food Security, 9(2), 36–45. https://doi.org/10.12691/jfs-9-2-1
- Nounkeu, C. D., & Dharod, J. M. (2020). A qualitative examination of water access and related coping behaviors to understand its link to food insecurity among rural households in the west region in Cameroon. International Journal of Environmental Research and Public Health, 17(13), 4848. https://doi.org/10.3390/ijerph17134848
- Pakravan-Charvadeh, M. R., Savari, M., Khan, H. A., Gholamrezai, S., & Flora, C. (2021). Determinants of household vulnerability to food insecurity during COVID-19 lockdown in a mid-term period in Iran. Public Health Nutrition, 24(7), 1619–1628. https://doi.org/10.1017/S1368980021000318
- Pérez-Escamilla, R., & Segall-Corrêa, A. M. (2008). Food insecurity measurement and indicators. Revista de Nutrição, 21, 15s–26s. https://doi.org/10.1590/S1415-52732008000700003
- Pickson, R. B., & Boateng, E. (2022). Climate change: A friend or foe to food security in Africa? Environment, Development and Sustainability, 24(3), 4387–4412. https://doi.org/10.1007/s10668-021-01621-8
- Prosekov, A. Y., & Ivanova, S. A. (2018). Food security: The challenge of the present. Geoforum, 91, 73–77. https://doi.org/10.1016/j.geoforum.2018.02.030
- Saint Ville, A., Po, J. Y. T., Sen, A., Bui, A., & Melgar-Quiñonez, H. (2019). Food security and the Food Insecurity Experience Scale (FIES): Ensuring progress by 2030. Food Security, 11(3), 483–491. https://doi.org/10.1007/s12571-019-00936-9
- Sani, S., & Kemaw, B. (2019). Analysis of households food insecurity and its coping mechanisms in Western Ethiopia. Agricultural and Food Economics 7(5), 1–20. https://doi.org/10.1186/s40100-019-0124-x
- Shakeel, A., & Shazli, T. (2020). Coping strategies and struggle against food insecurity: The case of district Banda in Bundelkhand region, India. GeoJournal, 86(4), 1721–1742. https://doi.org/10.1007/s10708-020-10155-x
- Sileshi, M., Sieber, S., Lejissa, T., & Ndyetabula, D. W. (2023). Drivers of rural households’ food insecurity in Ethiopia: A comprehensive approach of calorie intake and food consumption score. Agrekon, 62(2), 152–163. https://doi.org/10.1080/03031853.2023.2180041
- Sinyolo, S. (2020). Technology adoption and household food security among rural households in South Africa: The role of improved maize varieties. Technology in Society, 60, 101214. https://doi.org/10.1016/j.techsoc.2019.101214
- Smith, L. C., Alderman, H., & Aduayom, D. (2006). Food insecurity in Sub-Saharan Africa: New estimates from household expenditure surveys (vol. 146). International Food Policy Research Institute.
- Smith, L. C., & Subandoro, A. (2007). Measuring food security using household expenditure surveys (Vol. 3). International Food Policy Research Institute. https://doi.org/10.2499/0896297675
- Smith, M. D., Rabbitt, M. P., & Coleman-Jensen, A. (2017). Who are the world’s food insecure? New evidence from the Food and Agriculture Organization’s Food Insecurity Experience Scale. World Development, 93, 402–412. https://doi.org/10.1016/j.worlddev.2017.01.006
- Sotoudeh, M., Amaniyan, S., Jonoush, M., & Vaismoradi, M. (2021). A community-based survey of household food insecurity and associated sociodemographic factors among 2-6 years old children in the southeast of Iran. Nutrients, 13(2), 574. https://doi.org/10.3390/nu13020574
- Taghizadeh-Hesary, F., Rasoulinezhad, E., & Yoshino, N. (2019). Energy and food security: Linkages through price volatility. Energy Policy, 128, 796–806. https://doi.org/10.1016/j.enpol.2018.12.043
- Tambe, B. A., Mabapa, N. S., Mbhatsani, H. V., Mandiwana, T. C., Mushaphi, L. F., Mohlala, M., & Mbhenyane, X. G. (2023). Household socio-economic determinants of food security in Limpopo Province of South Africa: A cross sectional survey. Agriculture & Food Security, 12(19), 1–10. https://doi.org/10.1186/s40066-023-00424-6
- Tantoh, H. B. (2023). Editorial: Climate change, land, water and food security: Perspectives from Sub-Saharan Africa. Frontiers in Sustainable Food Systems, 7, 1–3. https://doi.org/10.3389/fsufs.2023.1164983
- Veen, A. v. d., & Gebrehiwot, T. (2011). Effect of policy interventions on food security in Tigray, Northern Ethiopia. Ecology and Society, 16(1), 17. https://doi.org/10.5751/ES-03895-160118
- Vinke, K., Bergmann, J., Blocher, J., Upadhyay, H., & Hoffmann, R. (2020). Migration as adaptation? Migration Studies, 8(4), 626–634. https://doi.org/10.1093/migration/mnaa029
- von Braun, J., Afsana, K., Fresco, L. O., & Hassan, M. H. A. (2023). Science and innovations for food systems transformation (p. 948). Springer Nature. https://doi.org/10.1007/978-3-031-15703-5
- von Grebmer, K., Bernstein, J., Geza, W., Ndlovu, M., Wiemers, M., Reiner, L., Bachmeier, M., Hanano, A., Ní Chéilleachair, R., Sheehan, T., Foley, C., Gitter, S., Larocque, G., & Fritschel, H. (2023). 2023 Global hunger index: The power of youth in shaping food systems. Bonn: Welthungerhilfe (WHH); Dublin: Concern Worldwide.
- Wang, X. (2022). Managing land carrying capacity: Key to achieving sustainable production systems for food security. Land, 11(4), 484. https://doi.org/10.3390/land11040484
- Wassie, S. B., Mengistu, D. A., Birlie, A. B., & Waktola, D. K. (2023). Drought-induced agricultural livelihood vulnerability: Livelihood-based comparative analysis in Northeast highlands of Ethiopia. Cogent Food & Agriculture, 9(1), 1–29. https://doi.org/10.1080/23311932.2023.2238981
- World Food Program (WFP). (2020). Ethiopia country strategic plan (2020-2025). Document presented during the Executive Board Annual Session 2020. Rome, Italy.
- World Food Program (WFP). (2022). The Philippines food security monitoring. https://docs.wfp.org/api/documents/WFP-0000145277/download/?_ga=2.156725371.1998795336.1695230038-1715565745.1695230038
- World Food Program (WFP) & Central Statistical Agency (CSA). (2019). Comprehensive food security and vulnerability analysis (CFSVA) Ethiopia 2019. https://reliefweb.int/report/ethiopia/ethiopia-comprehensive-food-security-and-vulnerability-analysis-cfsva-2019
- Woleba, G., Tadiwos, T., Bojago, E., & Senapathy, M. (2023). Household food security, determinants and coping strategies among small-scale farmers in Kedida Gamela district, Southern Ethiopia. Journal of Agriculture and Food Research, 12, 100597. https://doi.org/10.1016/j.jafr.2023.100597
- World Bank. (2015). Ethiopia: Poverty assessment. http://hdl.handle.net/10986/21323
- Wudil, A. H., Usman, M., Rosak-Szyrocka, J., Pilař, L., & Boye, M. (2022). Reversing years for global food security: A review of the food security situation in Sub-Saharan Africa (SSA). International Journal of Environmental Research and Public Health, 19(22), 14836. https://doi.org/10.3390/ijerph192214836
- Yadav, S., Mondal, M. K., Shew, A., Jagadish, S. V. K., Khan, Z. H., Sutradhar, A., Bhandari, H., Humphreys, E., Bhattacharya, J., Parvin, R., Rahman, M., & Chandna, P. (2019). Community water management to intensify agricultural productivity in the polders of the coastal zone of Bangladesh. Paddy and Water Environment, 18(2), 331–343. https://doi.org/10.1007/s10333-019-00785-4
- Ye, L., Zhao, X., Bao, E., Li, J., Zou, Z., & Cao, K. (2020). Bio-organic fertilizer with reduced rates of chemical fertilization improves soil fertility and enhances tomato yield and quality. Scientific Reports, 10(1), 177. https://doi.org/10.1038/s41598-019-56954-2
- Yuan, Z.-Q., Fang, C., Zhang, R., Li, F.-M., Javaid, M. M., & Janssens, I. A. (2019). Topographic influences on soil properties and aboveground biomass in lucerne-rich vegetation in a semi-arid environment. Geoderma, 344, 137–143. https://doi.org/10.1016/j.geoderma.2019.03.003
- Zakari, S., Ying, L., & Song, B. (2014). Factors influencing household food security in West Africa: The case of Southern Niger. Sustainability, 6(3), 1191–1202. https://doi.org/10.3390/su6031191
- Zezza, A., Carletto, C., Fiedler, J. L., Gennari, P., & Jolliffe, D. (2017). Food counts. Measuring food consumption and expenditures in household consumption and expenditure surveys (HCES). Introduction to the special issue. Food Policy. 72, 1–6. https://doi.org/10.1016/j.foodpol.2017.08.007
Annex 1:
Questionnaire
QUESTIONNAIRE
Good morning/afternoon Sir/Madam. My name is ________________ from the University of Mekelle. I am conducting interviews in several local areas in your district.
You have been randomly selected to participate in the research study on the determinants of food security status of households in BUGINA WEREDA/district.
The objective of this study is 1. To determine the state of food insecurity of farming households in your District.
2. To examine the determinants (factors) influencing the variation in food insecurity status among households in your District.
3. To identify and rank of the coping strategies households adopt in times of insecurity.
It is purely for academic purpose and if you agree to participate, you would be asked many questions within forty-five (45) minutes.
Your views would be confidential, and will neither be linked to you in the analysis nor the findings.
If farmers give consent, proceed to part one of the questionnaire, if not leave to another household.
PART ONE:
Background Information on Household Composition
1.1. Name of household head……………………………………………………………….
1.2. Gender of the household head? 1. Male [ ] 2. Female [ ]
1.3. Age of household head? _______ Years
1.4. Marital status: 1. Married 2. Single 3. Divorced 4. Widowed
1.5. Highest education of household head? 1. Never been to school [ ] 2. Basic education [ ] 3. Secondary education [ ] 4. Tertiary education [ ]
1.6. What is the religious belief of household head? 1. Islam [ ] 2. Christianity [ ] 3. Traditional [ ] 4. Other (specify) _______
1.7. Members of the household
1.8. Which of the following housing type best describes the type of dwelling this household occupies?
1. Traditional Huts with thatch 2. Tin Roofed
PART TWO: Calorie Consumption
2.0. Now I would like to ask you about the types of foods that you or anyone else in your household ate these last 7 days.
PART THREE: Own Production & Income Sources
3.0. Over the past year, how much did your household earn from any of these products as a source(s) of your household income?
PART FOUR: Off-farm Earnings
4.0. Beside the on farm activities or during the dry season, did your household engage in any of the following as a source of income? If yes, answer the following;
5.7. What are the major reasons to participate in non/off-farm activities? ___________________ ________________________________________
5.8. For what purpose do you use the income obtained from nonfarm/off-farm activities? (Multiple responses are possible)
1. Buy food 2. Saving 3. Buy clothes 4. School fee for children
4. Pay taxes 5. Pay loan 6. Buy inputs 7. Others __________
PART FIVE: Agricultural & Household Assets
5.0. Does your household currently own any of the following assets? If Yes, please tick
Animal asset
5.12. Would you please tell me the problems encountered the livestock sector? _______________ ____
5.13. What measures do you think should be taken to overcome the problems? ________________ _
5.15. List the type of agricultural inputs you used in the 2020 crop year
5.16. If there are constraints in the use of agricultural inputs, what are the problems? /Multiple responses are possible/
1. Drought/erratic rainfall 2. The high price of inputs 3. Lack of cash
4. Indebtedness 5. Farmland is inappropriate to use of fertilizers 6. Crop disease
7. Excessive rain 8. Unavailability of improved seed 9. Untimely input distribution
5.17. How did you plow your land? 1. Using a pair of oxen/horses 2. Using hand hoe 3. Other___
5.18. In all, what is the total size of land owned by your household (acres)? __________
5.19. Slope of your land: 1 = plain 2 = sloppy 3 = mixed
5.20. How do you perceive the quality or fertility of your land? 1 = fertile 2 = medium fertile 3 = poor 4 = very poor 5 = extremely poor
5.21. Do you produce enough for your family to eat throughout the year? _____ (1) Yes (2) No
5.22. If no, what are the constraints in order of importance that prevent you from doing so?
(a) Minimum rainfall (b) Lack of plow oxen/lack of money to rent a tractor (c) lack of labor, (d) small land (e) small fertile land (f) others specify,
5.23. Was there any damage to your crop last year? _________ (1) Yes (2) No what were the major reasons for your crop damage happened last year?
5.24. Which practices commonly are used by the farmers to conserve soil erosion?
1. Crop rotation 2. Using composite 3. Soil/stone bunds 3. 4. Strip cultivation 5. Fallowing 6. Contour plowing 7. Tree planting
PART SIX: Access to Credit
6.0. Did you have access to credit in the last cropping year? (1) Yes [ ] (2) No [ ]
6.1. If yes, which kind of credit did you go for? (1) Production credit [ ] (2) Consumption credit [ ] (3) Other [ ] (specify) _________________________________________
6.3. Did you have the credit on time? (1) Yes [ ] (2) No [ ]
6.4. If No, what hindered your access to credit?
1. Cumbersome administrative processes 2. Proximity to financial institutions 3. No Collateral 4. Default/delay in paying previous loan 5. Other (specify) ____________________
6.5. What was the effect of this credit on your activities and output? ____________________ _____
PART SEVEN: Access to Social Amenities & Extension Service
(Only ONE answer for EACH ROW).
7.0. What is the main drinking water for your household? 1. Piped in 2. Tube well/borehole with pump 3. Protected dug well 4. Open/unprotected well 5. Protected spring 6. River/stream
7.1. What is the main source of lighting for the house? 1. Bottle lamp 2. Kerosene 3. Candle 4. Woodfire
7.2. What is the main source of cooking fuel for the household? 1. Wood 2. Charcoal 3. Gas 4. Kerosene 5. Dung, 6. Crop residue 7. Other (specify)
7.3. Source of information? 1. Radio 2. Television 3. No
7.4. Medicine or medical treatment? 1. Yes 0. No
7.5. Did you receive any extension service during the last cropping year? (1) Yes [ ] (2) No [ ]
PART EIGHT: Coping Strategies
Select from the options below the table to respond to the following questions.
8.0. In the past 3 months, if there have been times when you did not have enough food or money to buy food, did your household;
8.1. Do you or anyone in your household use any of the following adaptive (long-term) strategies?
Options: (1) once a month (2) About once a week (3) More than Once a week but less than every day of the week (4) Every day (5) Don’t know
9. Social networks and linkages
9.1. In which of the following community-based organization do you participate?
1. equb 2. Religious social groups/Idir
9.2. Do you participate in various community labor organizations? 1. Yes, 2. No
9.3. If yes, which of the following organizations do you take part in? / Multiple responses are possible/
1. Debo 2. Wonfel 3. Group work for disabled persons 4. Other, specify
Annex 2:
Interview contents
A. An in-depth interview with key informants (household interview)
1. Access to natural capital
Landholding size and number of plots
Ways of getting access to land
The trend of landholding size (decrease or increase or no change)
The general conditions of the available land (fertility, land fragmentation, topography, etc.)
Main problems of farmland (land degradation, protection, grazing, complaints on land closures, etc.)
Land management practices
Problems concerning exploitation of natural vegetation and interest in planting trees
Perception towards drought and erratic rainfall and temperature change
How is the availability of rainfall in the area?
How is the trend of rainfall in the area?
2. Financial capital
Trends in production (decrease, increase or no change)
Perennial crops are grown for cash crops (eucalyptus, papaya, apple, orange, etc.)
How is the purchasing power of the household during food shortage?
How do they get the cash to buy food?
Livestock owned and constraints faced
Housing situations (the type of houses, etc.)
Availability, constraints and use of credit
3. Availability and accessibility to physical capital
Health services
Schooling
Access to water for human and livestock
Agricultural extension services
Roads
Telecommunication
Electricity
4. Social relations and networks – social capital
Participation in informal institutions (Idhir, Equib, etc.)
Participation in a labor organization (wonfel, debo, etc.)
Labor support from neighbors
Discussion on cultural ceremonies (weddings, Teskir, various festivals)
5. Government intervention – political capital
Land redistribution and land tenure system
Perception towards resettlement program
6. Discussion on vulnerability to food insecurity and coping strategies
In your opinion do you think that there is food insecurity in your village in the present situations?
What do you think are the causes of food insecurity in your village?
Can you describe how these factors affect the problem of food insecurity? Which causes are more serious? Why?
How do you see your future food security conditions?
During famine which category of the community was most affected by food crises?
What responses and general steps the communities do when food crises occur in your area? (Discussion on coping and adapting strategies)
What measures have been or are being done by the government/ NGOs to solve food shortage problems? (Government and NGOs’ coping/adaptive strategies)
Do you think the government is doing enough to alleviate the problem of food security in your village? What do you think the government needs to do?
Did you participate in nonfarm and off-farm activities?
B. Interview with development agents (DAs)
Landownership and tenure issues in the woreda
Major agricultural extension services
Constraints to deliver proper extension services to the community and the individual farmer
Major problems in livestock and crop production, non-farm generating and use of common resource issues
Discussion on land degradation and people’s complaint about land closure
Do you think the communities in the woreda have enough food?
For how many months the food produced from their own produce can cover households’ food requirement?
If they are unable to cover the yearly food requirements, what do they do to satisfy their necessities?
Do you find a household who is supplemented through remittances
What kind of household is most vulnerable to food shortage?
What measures have been taken to overcome the undesirable situations (food shortages)?
What do you think are the causes of food insecurity?
Did you observe the distribution of food/cash by the governments/NGOs?
Was the food distribution to the food insecure households during food crises sufficient?
How did you perceive the attitudes of the people towards food aid?
In your opinion do you think that food aid is necessary for the community?
Do you think that the government is doing enough to alleviate the problem of food shortage in the Woerda?
How is the availability of rainfall in the area?
How is the trend of rainfall in the area?
How is the change in temperature?
I’m very much grateful for your time.