
 ?Mathematical formulae have been encoded as MathML and are displayed in this HTML version using MathJax in order to improve their display. Uncheck the box to turn MathJax off. This feature requires Javascript. Click on a formula to zoom.
Abstract
In Ethiopia, recent reports reveal that nearly 31 million people in the country failed to feed themselves and are suffering from food insecurity problems. The purpose of this study was to examine households’ determinants of food insecurity among rural households in Basketo Special District. An explanatory cross-sectional research design with a mixed research approach was employed. The study has conducted household-level survey data collection from sample households in 14 kebeles of Basketo special district, and secondary data was collected from the documents of the agriculture and extension development office of the district. A stratified random sampling technique has been employed to select 383 sample households. The consumption expenditure approach, particularly calorie acquisition by households, was used to categorize the sample households into food-secure and food-insecure households. Both descriptive and econometric analyses were used to analyze the data collected from households. Our study finds that of the total sampled households, 52.29% (194) were found to be food insecure households, whereas 47.71% (177) were food secure. More specifically, econometric analysis was held by the double hurdle model and revealed that among the fourteen explanatory variables considered, six were statistically significant. These include the age of the household head, sex of the household head, family size, market distance, access to credit, and livestock holding in the tropical livestock unit; they significantly affected households’ probability of being food insecure. From this study, it was suggested that to improve households’ food insecurity status in the study area, households should adopt family planning techniques and women’s empowerment strategies.
Background
Food security is defined as a ‘state in which all people, at all times, have physical and economic access to sufficient, safe, and nutritious food to meet their dietary needs and food preferences for an active and healthy life’(Shaw, Citation2007). Food insecurity is directly correlated with poverty, which is Ethiopia’s and other African countries’ biggest problem. Poverty kills and hurts millions of people, both directly and indirectly, through its facilitative role in other killer diseases (Negash & Alemu, Citation2013).
In 2020, approximately 3.1 billion people globally will not be able to afford a balanced diet, according to the FAO’s most current report. In 2021, an estimated 923.7 million people (11.7 percent of the world’s population) and 2.3 billion people (29.3 percent) were thought to be suffering from acute food insecurity (FAO, Citation2022). In Africa, one in five people faced hunger in 2021(3).
Ethiopia, like the majority of Sub-Saharan African (SSA) nations, is currently dealing with difficult food security issues that are still brought on by environmental catastrophes, population shifts, and socio-economic restraints that have a negative impact on people’s production systems (Wudil et al., Citation2022). Due to this, agricultural productivity has been subpar for a multitude of years, to the point where the nation is unable to sufficiently feed its population domestically, leading to both chronic and temporary food insecurity (Tolossa, Citation2001). According to studies, the majority of households in the SNNPR only have enough food to feed themselves for six to nine months of the year (Adimasu et al., Citation2019; Admasu, Citation2012; Angello, Citation2014; Demssew, Citation2014).
Basketo Special District was one of the region’s most productive areas. In the research region, a variety of crops including corn, avocado, corrorima, and others are grown. Despite good production, there are still issues with food insecurity. The concepts and problems surrounding food insecurity should be viewed as a failure of local livelihoods to ensure access to enough food at the home level rather than only as a failure or success of agriculture to produce enough food at the district, regional, and national levels (Barker, Citation2004). The majority of the district’s population was assessed to be undernourished and in need of food assistance from emergency and food security programmes, according to the BWoA assessment (BWoA, Citation2013).
Despite Ethiopia’s booming economy over the past ten years, hunger and malnutrition remain major political obstacles (Graham et al., Citation2013). Drought, pests and animal illnesses, population pressure, and poor infrastructure all contribute to Ethiopia’s issue of food insecurity brought on by low crop yields and crop losses. Rainfall patterns are also unpredictable and dynamic. These are key causes of Ethiopia’s ongoing food insecurity (Fikre et al., Citation2017).
There are different studies done about food insecurity, such as (Admasu, Citation2012; Angello, Citation2014; Fekadu & Mequanent, Citation2010) their research focuses on the factors that affect food security in rural households in central Ethiopia, and the results indicate that development initiatives aimed at increasing income diversification, expanding the supply of fertilizer, improving land productivity, and raising livestock productivity will all make a significant contribution to achieving food security. Caloric acquisition was used to gauge the degree of household food security in the research area among rural households in Southwest Ethiopia. Education level, family size, utilization of farm input, and the number of oxen owned by the household were found to be significant among the nine explanatory factors in the model (Mequanent et al., Citation2014). Additionally, studies have thus far concentrated on identifying determinants impacting food security using binary models like logit and probit. These models, however, ignored the level of food security and merely gave data on the likelihood that a household would be food secure or insecure.
This study used a double hurdle model to address methodological gaps and examine the causes and severity of food insecurity in the Basketo Special District. Furthermore, there was a paradox in the results of certain studies on the variable ownership of livestock. In a certain study, the variable number of livestock ownership has a positive link with food insecurity status, whereas in another, it has a negative relationship. Therefore, the purpose of this study is to analyze the current situation of food insecurity in households by determining the main causes of food insecurity, the level of food insecurity experienced by households in the study area, and any potential coping mechanisms employed by these households.
Research methodology
Description of the study area
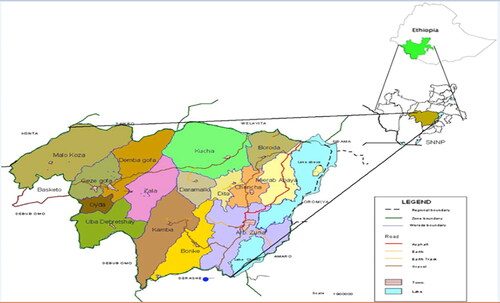
Basket Special District is a district in Ethiopia’s Southern Nations, Nationalities, and Peoples’ Region (SNNPR) named for its residents, the Basketo people. It is bordered by the Debub (South) Omo Zone on the south and west and by the Gamo and Gofa Zones on the north and east (BSWRT, 2022). The locational map of the study area is shown in . In addition to growing important commercial commodities like coffee and the spice Aframomum corrorima, which resembles cardamom, the study region also yields food crops such as enset (false banana), sweet potatoes, maize, yams, and horse beans.
Figure 1. Map of the study area.
Data sources and collection methods
We used both primary and secondary data sources. Primary data was gathered using household survey questionnaires, in-depth interviews, and focus group discussions. Secondary data was acquired from books, electronic materials (websites), published journal papers, and unpublished agricultural office documents in the study area.
Sample design
A mixed strategy was employed for this study, which is a combination of qualitative and quantitative research methodologies to create more reliable and meaningful information. According to Creswell (Creswell, Citation2004) the study provides a greater knowledge of the problem than studies that use only qualitative or quantitative methodologies. Because of the presence of diverse persons in the study area, stratified sampling was used to address the study. This means that the occupants of the area are made up of people who moved from different places and settled separately. Furthermore, distinct agro-ecological zones in the research area cause production to differ from one another, most notably in the frequency of output. To obtain a sample size that is representative of the entire population, the sample size could be computed using the simplified proportions formula (Yamane, Citation1967). According to him, the sample size for a 95% confidence level and 5% precision was:
(1)
(1)
Where n is the sample size, N represents the total number of homes, and e represents the error margin (5%). As stated in , 372 household heads were chosen at random from each designated Kebele, proportional to their overall population size.
Table 1. Proportional to sample size determination of the sample household.
Method of data analysis
Using STATA 14 version software, both descriptive and econometric models were employed to analyze the collected data. The double hurdle model was used for the econometric analysis, whereas frequency, mean, maximum, minimum, standard errors, and standard deviations were considered in the descriptive analysis (Thomas et al., Citation1988).
Measurement of food insecurity threshold level
Direct calorie intake, which is defined as the minimum calorie required for survival, was used to assess household food insecurity. This was accomplished by converting the weekly intake statistics from the nationally standardized food composition table manual into kilocalories (EHNRI, Citation1968). The transformed data was separated into adult equivalents (AE) for households. Following that, the amount of energy available for the household in kilocalories (kcal) was recorded. The acquired results were compared to the Ethiopian Health Institute’s minimal subsistence need for AE per day (i.e. 2,200 kcal). Families who consume less than the minimal required are termed food insecure, whereas families that consume more than the minimum requirement are considered food secure (Enyew, Citation2021).
Analytical methods
The study employed the double-hurdle model to demonstrate the drivers of food insecurity and the level of food insecurity at two distinct periods. The double-hurdle model was proposed for the first time by Cragg (Cragg, Citation1971). In any agricultural decision-making process, farmers face two challenges, according to this approach. As a result, the likelihood of being food insecure was computed first, followed by the probability of being food secures. A probit regression model was used in the first stage to identify factors affecting food insecurity, and a truncated regression model was utilized in the second stage to analyze the intensity of food insecurity in the research area.
Probit regression model
The probit regression model was used to investigate the determinants influencing household food insecurity. When the dependent variable is a dummy variable, the model works well. It simulates the impact of a collection of explanatory variables on the food insecurity status of study homes. The dependent variable in this study is whether the household is food insecure or food secure. The probit model is defined as follows:
(2)
(2)
Where is a vector of explanatory factors,
is a vector of estimated parameters, and
is a vector of random error terms,
is the chance of a household being food secure is 1 and 0 is the likelihood of a household being food insecure is 0.
Truncated regression model
The shortened regression model was used to investigate the level of food security. The model in this study employed food insecurity as a dependent variable to assess the factors that contributed to a change in the intensity of food insecurity in the study area. The truncated regression model is defined as follows (Lewbel & Linton, Citation2016):
(3)
(3)
Where is the vector of estimated parameters,
is a vector of explanatory factors,
is a vector of random disturbance (error) term, and
is the severity of food insecurity in households. The explanatory variables’ definition, measurement, and predicted hypothesis are all stated in .
Table 2. Descriptive statistics of study variables.
Ethical considerations
Because the study involved human participants, the research proposal and evaluation tools were reviewed and approved by the Arba Minch University Ethical Review Board. A letter was sent to the Basketo Special District to obtain official approval to conduct research activities in the district’s selected kebeles. After receiving a thorough explanation in their local language of the study’s purposes, procedures, benefits, duration, and potential risks, each participant provided verbal informed consent to participate in the study. All methods and materials were used in accordance with the guiding principles of the Helsinki Declaration and its later amendments (Bošnjak, Citation2001). The participants were also assured that they had the right to refuse or leave at any time if they felt uncomfortable. The entire data set gathered from the participants was kept confidential by omitting any means of personal identification.
Result and discussion
In this section, both descriptive and double hurdle model results were presented and discussed. The descriptive analysis employs tools such as measures of central tendency, dispersion, percentage, graphs, and frequency distribution. Econometric analysis was used to identify relevant socio-economic and institutional factors that determine food insecurity in rural farm households in the study area. So this part was devoted to answering the basic objective of the study using both descriptive and econometric analysis.
Socio-demographic and economics characteristics of household
Of our total sample households, which are 383 households, 3% (Graham et al., Citation2013) of the sample households did not respond to the survey questionnaire, and the analysis of this paper was focused on 97% (371) of the sample size. Descriptive statistics on sample household characteristics were presented in . Of the total respondents, 45.28% (168) were female, and the remaining 54.72% (203) were from male-headed households. The majority of respondents were from male-headed households. The mean age of the respondent was 40 years, with minimum and maximum ages of 17 and 65, respectively.
As can be seen from the above descriptive statistics, the mean age of households in the study area is about 39.6 years, while the mean family size of households is 6.23, with a maximum of 13 and a minimum of 1 individual. The mean family size in Basketo Special District (6.23) was greater than the national average family size (5.1). In addition to this, the mean family size in adult equivalent was 5.39, indicating high fertility in the study area. The possible justification for this was early marriage and the higher fertility level in the study area. Education as human capital has an effect on the food insecurity of the household since it increases the household’s knowledge of how to use resources in a better manner. The mean education attendance, or year of schooling, was 4.76 years. The possible implication is that the overall education level of the sample household was low. The average farm land holding size in the district is 1.29 hectares per household, which is in line with the 1.37 hectares of the national average land size for rural Ethiopia. The farm size varies from 6 hectors (the maximum farmland holding) to 0 hectors (the minimum farmland holding).
Most rural households use livestock population as a measure of wealth, and they put their assets in the form of live animals. The average livestock holding of the rural farm households in the study area was 3.64 when measured in tropical livestock units (TLU). This low livestock population in the study area was associated with a scarcity of land resources owned by each household. Family income is another indicator of a household’s economic capacity. The average total annual farm income of sample households was 14,370.4 birr, and the maximum and minimum total annual income ranges for sample households in Basketo special district were between 0 and 304,920 birr of annual income, respectively. Similarly, the average annual income from off-farm activity in the study area was 1969.21 ETB, which is significantly low compared to farm activities. This implies that off-farm activities in the study area were very low, and their contribution to the total income was nothing. The average distance travelled by sampled households to the nearest market is 9.62 kilometers. The maximum distance to the market was 30 km, which was very long (see ). Moreover, out of the total sample of 371 households, only 29 percent have access to credit, and remaining 71 percent have no access to credit in the study area.
Measuring the extent of food insecurity
To measure the household’s food security status (HFS), the direct calorie intake (DCI) method was adopted (Berhane et al., Citation2011). Accordingly, the survey resulted in has shown that from 371 sample households, 194 (52.29%) were food insecure and 177 (47.7%) were food secure. The possible justification for this condition was that the study area has high fertility, low productivity, a high dependency ratio, and a lack of off-farm activity. Associated with this, the result has underlined the existence of a mean dietary calorie consumption difference between food-insecure and food-secure households in the study area. The t-statistic (t = 30.1438) confirmed that there is a statistically significant difference between food-insecure and food-secure households with respect to average calorie consumption. Since the t-test result is highly significant, we reject the null hypothesis. This means there is sufficient evidence to conclude that there is a statistically significant difference in mean food expenditure between food-secure and food-insecure households in the study area.
Table 3. Households food insecurity status.
The amount of energy available for the household is compared with the minimum subsistence requirement per adult equivalent per day (i.e. 2,200 kcal). The finding reveals that the mean value of the energy available for food insecure and secure households was 1283.2 kcal/AE/day and 3055.56 kcal/AE/day, respectively. This indicates that food-secure households tend to spend significantly more on food compared to food-insecure households. The mean energy intake of all sample households was 2128.784 kcal, which is below the national level of mean energy consumption, which is currently standing at 3,254 kcal per adult equivalent per day nationally (WPF. World Food Programme: Productive Safety Net Programme, Citation2016).
The head count insecurity index (FGT 1) in Basketo Special District was 0.526, inferring that 52.6 percent of the population in the study area was food insecure. In other words, on average, about 52.6% of the population in the study area was food insecure, with food consumption intervals of calorie intake less than the minimum standard (2200 kcal/adult equivalent per day). Furthermore, food insecurity was reported by 92.2 percent of 168 female respondents and 20.21 percent of 203 male respondents (see below). Therefore, food insecurity was much more severe in female-headed households than in male-headed households. Since the major economic activity in the study area was agriculture in both scenarios above, it led the whole family to high depravity and food insecurity.
Table 4. Household food insecurity status by sex group.
The FGT 2 index of food insecurity indicates the severity of food insecurity by giving more weight to the more deprived households; i.e. households with a higher amount of food energy deficit from the recommended minimum allowance are given more weight in the computation of the average level of shortfall in per capita kilocalorie consumption. As a result, it takes more resources to lift those households that are more impoverished than those that are closer to the minimum recommended kcal per capita per day. The survey result identified a relative deficiency among food-insecure households of 22.4 percent. This implies that the average shortfall of food insecure households was 22.4 percent of the minimum recommended kcal per capita per day (2200 kcal/adult equivalent per day). Hence, the FGT-2 index shows food consumption inequality in a generic sense.
When comparing the consumption of head count ratio, severity index, and depth index with that of the national level (), the study area head count ratio was below the national level of head count ratio, severity index, and depth index, which were 70.62, 37, and 25 percent, respectively (Girma, Citation2012).
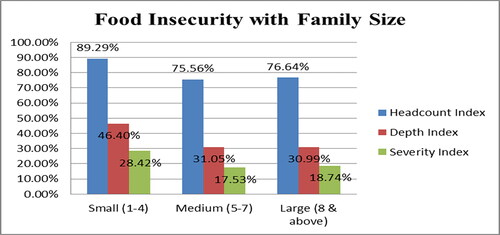
Figure 2. Food insecurity with household family size.
For briefer and further analysis, education was broken down into four subparts: households with education in the first cycle (0–4), second cycle (Adimasu et al., Citation2019; Angello, Citation2014; Demssew, Citation2014; Tolossa, Citation2001), high school (Admasu, Citation2012; Barker, Citation2004), preparatory, and 11th and above. For instance, the head count index for household heads only with first-cycle formal education was 90 percent. The poverty head count, depth, and severity for household heads in the second cycle were 0.72, 0.282, and 0.161, respectively ().
Figure 3. Household food insecurity with educational status.
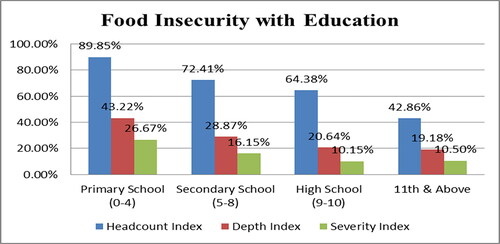
In other words, household heads in this category have a 72 percent probability of being poor. Hence, at the very minimum, education does not result in formal sector employment or higher income, so its impact on poverty reduction is insignificant. The food insecurity level was decreasing as the level of education increased. As witnessed in , the percentage of households that are food insecure decreases as the year of schooling increases. Therefore, a higher level of education is associated with a lower incidence of insecurity, and vice versa.
Post estimation test/diagnostic tests
Regarding the post-estimation tests, there are no multicollinearity problems or model misspecifications. That means the variance inflating factor (VIF) and link test showed that there is no problem of multicollinearity or model misspecification, respectively. A model specification error can occur when one or more relevant variables are omitted from the model or when one or more irrelevant variables are included in the model. It can substantially affect the estimation of regression coefficients. But autocorrelation is not an issue in binary regression models, and the researcher used robust estimation so as to account for the problem of heteroscedasticity in a probit regression model.
Determinants of household food insecurity
In estimating the factors influencing households’ status, because the random preferences are unknown and we can only predict the probability statements about the binary result of ‘secure’ and ‘insecure’, a double hurdle model was employed to estimate the probability of being food insecure or secure. This estimation results in showed that the Wald chi-square of 302.17 with a p-value of 0.0000 means that the joint significance test of all variables in the model is significant at the one percent level, implying that the variables correctly predict the model. The result of the first step of probit regression revealed that, among the fourteen explanatory variables considered, six were statistically significant. These include the age of the household head, the sex of the household head, family size, market distance, access to credit, and livestock holdings in the Tropical Livestock Unit (TLU). They significantly affected households’ probability of being food insecure at different probability levels. The signs of all explanatory variables were as expected, which was discussed in the .
Table 5. Result of probit regression model.
The findings demonstrate a negative relationship between the sex and the household’s food insecurity status at 1% level of significance. This finding is consistent with another similar study (Gladwin et al., Citation2001). The negative sign showed that male-headed households were more likely to be food secure than female-headed households. The possible explanation was the differential access to production resources, where males had more access to production resources like cultivated land than females. Family size was positively associated with household’s food insecurity status. The household who had large family size were more likely to be food insecure. The underlying reason was the fact that as family size increased, with limited resources, additional family members increased the vulnerability of households to food insecurity by contributing more to consumption than to production. This was in line with the study done in Mozambique (Garrett & Ruel, Citation1999).
The distance to the market, as expected, affected the extent of households’ food insecurity positively. Our study indicated that a household who were far from the nearest market were more likely to be food insecure. This implies that food-insecure households living far from the market center were more energy deficient than those living near the market center. Access to credit was negatively related with the household’s energy intake. This finding is in line with other similar study (Adimasu et al., Citation2019). The households who had access to credit were less likely to be food insecure as compared to the households who has no credit access. This implies that in the study area, households that had access to credit had a lower chance of being food and energy deficient as compared to those who had no access to credit.
We also argue that age differentials have a greater influence on the household’s food insecurity status. The age of the household head was positive associated with the household’s food insecurity status. Our study result shows that the older household head were more likely to be food insecure. The possible explanation was that with small pieces of land supporting the households, as the age of the household head increased, the labor force of an individual would fall so as to participate in other income-generating activities, which in turn increased household’s exposure to food insecurity.
The livestock holding showed a negative and significant relationship with household food insecurity status. The study found that the household who had large number of livestock holding in the Tropical livestock Unit were less likely to be food insecure. This demonstrated that households with a large number of livestock in the TLU had a better chance of earning more income from livestock production. This in turn helped households buy food when they faced shortages and invested in the purchase of farm input, which increased production, thus ensuring food security at the household level. This argument is supported by a study conducted in Australia (Little & Lin, Citation2017).
Factors influencing the intensity of household’s food insecurity
This section focuses on factors determining households’ food security, whether they are food secure or insecure. Truncated regression was used in this case, which is the second stage of the double-hurdle model, to analyse the problem by considering only the participant households that we used in the first stage of double-hurdle (probit regression). However, before running the final regression, it is necessary to check for the existence of statistical problems such as multicollinearity. Based on the findings further confirmed that age, sex, family size, market distance, access to credit, and livestock holding in the Tropical Livestock Unit (TLU) were the determining factors in food security status.
Table 6. Result of truncated regression model.
reveals the factors influencing the intensity of household’s food insecurity summarized by truncated regression model. From the above the sex of household heads was negatively and significant related the intensity of household’s food insecurity status at 1% level of level. Our study indicated that male headed households tend to experience lower intensity of food insecurity compared to male headed households. This finding was consistent with a study conducted by Gladwin (Gladwin et al., Citation2001). This was mainly due to a difference in access to production resources, where males had more access to production resources like cultivated land than females. Family size was positively associated with the of household’s intensity of food insecurity status at 1% level. This shows that the household’s intensity of food insecurity increased as the family size in adult equivalents increased. The result was confirmed with the work from Mozambique (Garrett & Ruel, Citation1999).
The distance to the nearest market affected household’s intensity of food insecurity status positively and significantly at the 1% probability level. The result indicated that for every unit increase in market distance, the intensity of food insecurity increase, possibly due to challenges in accessing food supplies, higher transportation costs, or limited market opportunities for selling goods or labor. Access to credit affected households’ energy intake negatively and significantly at the 1% significance level. The finding showed that having access to credit decreased intensity of food insecurity households. This implies households that had access to credit had less food energy deficiency as compared to those that had no access to credit. And the age of the household head was positively related with the intensity of household’s intensity of food insecurity status at 10% level of significance. This shows that on average older households tend to have a slightly higher intensity of food insecurity. This study confirm with a study from Damot Gale District, Ethiopia (Adimasu et al., Citation2019).
The livestock holding had a negative and significant relationship with household intensity of food insecurity status at 10% level. This association shows that the increase in the number of livestock holdings in the Tropical Livestock Unit (TLU) the decrease in household intensity of food insecurity. The households with a large number of livestock in the tropical livestock unit had a better chance of earning more income from livestock production. This in turn helped households buy foods when they faced shortages and invested in the purchase of farm input, which increased production and thus ensured food security at the household level. A similar result was also obtained by a study from Chifra District, Ethiopia (Indris & Adam, Citation2013).
The results of the study confirmed that households in the study area locally adopted different strategies to cope with food insecurity. reveals that 29.38% of the sampled households followed the mechanism of reducing consumption outside their home as a coping strategy preferred by the majority of the sampled households. The second most adopted copping strategy by the households in the study area was using low-cost medical treatment and local drugs. This strategy has been adopted by 24.23% of the households surveyed during the data collection. The third most popular change adopted by 20.62% of sample households in the study area was reducing the frequency of consumption. Fourthly, reducing the size of food served at home (11.85%) was found to be another copping mechanism of food insecurity; 10.31% of households in the study area also adopted borrowing money from others as one means of copping with the problem of food insecurity and involving themselves in petty trade (3.61%). This implies that the majority of the households were adopting a reduction in having food out of their home, low cost for medical purposes, frequency of consumption at home, borrowing money, reducing the size of food prepared at home, and lastly, participating in petty trade in their nearby local as well as common markets.
Table 7. Coping Strategies for food insecurity in the study area.
Moreover, the study result revealed that reducing outside spending for additional food was the most effective and important coping mechanism used by the large segment of households (29.38%), followed by low cost medical treatment (24.23%) and reducing the frequency of having food (20.62%). This finding goes in line with the study conducted in Western Ethiopia (Seid & Biruk, Citation2019).
Conclusion and recommendations
The probit model reveals that demographic variables such as age, sex, family size, access to credit, distance to the nearest market, and livestock holding significantly affect food insecurity in households. Older households are more vulnerable due to sharing assets with children, declining productive capacity, and a lack of access to food. Female-headed households are highly food-insecure. Family size also positively affects food insecurity. Credit use for income-generating activities is also influenced by a lack of awareness and a fear of owning government money. Policy actions to improve food insecurity include training on high-calorie food consumption, credit access, and family planning techniques.
Authors’ contributions
M.T.O. was in charge of leading the research and making revisions to all aspects of the manuscript, such as the abstract introduction, econometric model specification, and interpretation. G.B.B., K.A.T., and E.H.Z. were involved in the data collection, analysis, interpretation of the data, and in the critical evaluation of the manuscript. All authors read and approved the final manuscript.
Acknowledgments
The authors are indebted to Arba Minch University for the approval of the ethical clearance. Furthermore, they would like to thank the study participants and data collectors for their cooperation throughout the course of the study.
Disclosure statement
The authors assert that they have no competing interests to declare.
Data availability statement
The data that supports the findings of this study are available upon reasonable request from the corresponding author.
Additional information
Funding
Notes on contributors
Mihretu Tesfaye Oyato
Mihretu Tesfaye Oyato (MA) is senior lecturer and researcher in the department of Economics, Arba Minch University, Ethiopia, research interest area is food security, poverty, livelihood diversification and income inequality.
Gashahun Bogale Borano
Gashahun Bogale Borano (MSc) is a senior lecturer and researcher in the department of economics, Arba Minch University, Ethiopia.
Kebede Abate Tariku
Kebede Abate Tariku (MA) is a senior lecturer and researcher in the department of economics, Arba Minch University, Ethiopia.
Efta Hezikeal Zekariyas
Efta Hezikeal Zekariyas (MSc) is a senior lecturer and researcher in the department of economics, Arba Minch University, Ethiopia.
References
- Adimasu, A. M., Senbetie, T. L., & Yoseph, H. H. (2019). Assessment of food insecurity and its determinants in the rural households in Damot Gale Woreda, Wolaita zone, southern Ethiopia. Agric Food Secur [Internet], 8(1), 1–14. https://doi.org/10.1186/s40066-019-0254-0
- Admasu, L. A. (2012). Determinants of Rural Household Food Insecurity In The case of Lemo Woreda, hadiya Zone [Masters Thesis].
- Angello, Y. (2014). Determinants of Household Food Security : the Case of Bo Loso Sore District (Woreda), Wolaita Zone, Southern Nations Nationalites and Peoples Regional State (Snnprs) of Ethiopia. A Thesis By Yisehak Angello Addis Abeba [Masters Thesis], Ethiopia.
- Barker, D. (2004). Food security in sub-Saharan Africa (S. Devereux, S. Maxwell, & L. Degrad Dev (Eds.), vol. 15, pp. 197–199). http://www.sinab.unal.edu.co:4508/doi/10.1002/ldr.597/abstract
- Berhane, G., Paulos Kt, Z., & Tamiru, S. (2011). Foodgrain consumption and calorie intake patterns in Ethiopia Ethiopia Strategy Support Program II (ESSP II). Dev Strateg Gov Div Int Food Policy Res Institute, Ethiop Strateg Support Progr II, Ethiop [Internet]. www.ifpri.org
- Bošnjak, S. (2001). The Declaration of Helsinki - The cornerstone of research ethics. Arch Oncol, 9(3), 179–184.
- BWoA. (2013). Basket woreda of agriculture: Demographic report of the Woreda, southern Ethiopia.
- Cragg, J. G. (1971). Some statistical models for limited dependent variables with application to the demand for durable goods. Econometrica, 39(5), 829. https://doi.org/10.2307/1909582
- Creswell, J. w. (2004). Educational research: Planning, coducting, and evaluating quantitative and qualitative reseatch (4th ed., C. Robb, P. A. Smith, M. Buchholtz, & K. Mason (Eds.), pp. 1–14). Pearson.
- Demssew, M. W. (2014). Studies on determinants and status of food insecurity among rural households : The case of dilla zuria woreda in Gedeo Zone, Snnpr, Ethiopia a thesis submitted to Indira Gandhi National Open University, School of Continuing Education, Department of Ru. Masters Thesis.
- Graham, J., Rashid, S., & Malek, M. (2013). Disaster response and emergency risk management in Ethiopia. In P. Dorosh & S. Rashid (Eds.), Food and agriculture in Ethiopia: Progress and policy challenges, (pp. 256–279. University of Pennsylvania Press. https://doi.org/10.9783/9780812208610.256.
- EHNRI. (1968). Food composition table for use in Ethiopia, Part III: A research project sponsored by the government of Ethiopia through former Ethiopian Nutrition Institute (ENI) and Ethiopian health and nutrition research institute (EHNRI), 1–34.
- Enyew, A. (2021). Determinants of household food insecurity in rural Ethiopia the case of Masha District of Sheka Zone Snnpr. Ethiopia.
- FAO. (2022). The state of food security and nutrition in the world. FAO.
- Fekadu, B., & Mequanent, M. (2010). Determinants of food security among rural households of central Ethiopia: An empirical analysis. AgEcon Search, 49(4), 299–318.
- Fikre, L. O., Gezahegn, B. Y., Fikadu, M. A., & Adugna, E. B. (2017). Why does food insecurity persist in Ethiopia? Trends, challenges and prospects of food security in Ethiopia. J Dev Agric Econ, 9(12), 341–354.
- Garrett, J. L., & Ruel, M. T. (1999). Are determinants of rural and urban food security and nutritional status different? Some insights from Mozambique. World Dev, 27(11), 1955–1975.
- Girma, G. G. (2012). Determinants of food insecurity among households in Addis Ababa City. Ethiopia. Interdiscip Descr Complex Syst, 10(2), 159–173.
- Gladwin, C. H., Thomson, A. M., Peterson, J. S., & Anderson, A. S. (2001). Addressing food security in Africa via multiple livelihood strategies of women farmers. Food Policy, 26(2), 177–207. https://doi.org/10.1016/S0306-9192(00)00045-2
- Indris, S., & Adam, B. (2013). Assessment of food insecurity and coping mechanisms among pastoral households of Afar national regional state: The case of Chifra District, Ethiopia. Journal of Agricultural Science, 23, 145–156.
- Lewbel, B. Y. A., & Linton, O. (2016). Nonparametric censored and truncated regression author. The Econometric Society Stable, 70(2), 765–779.
- Little, L. R., & Lin, B. B. (2017). A decision analysis approach to climate adaptation: a structured method to consider multiple options. Mitigation and Adaptation Strategies for Global Change, 22(1), 15–28. https://doi.org/10.1007/s11027-015-9658-8
- Mequanent, M., Endalew, B., & Koricho, T. (2014). Determinants of household food security among southwest Ethiopia rural households. Food Sci Technol, 2(7), 93–100.
- Negash, T., & Alemu, S. (2013). Determinants and coping strategies of household food insecurity in rural areas of tigray: The case of rural Adwa woreda. Journal of Agricultural Science, 23, 119–144.
- Seid, S., & Biruk, K. (2019). Analysis of households food insecurity and its coping mechanisms in Western Ethiopia. Agric Food Econ, 7, 5.
- Shaw, D. J. (2007). World food summit, 1996. In World food security: A history since 1945 (pp. 347-360). Palgrave Macmillan UK.
- Thomas, B., Hill, R., & Johnson, R. S. (1988). Review reviewed work (s): Advanced econometric methods. Journal of Applied Economics, 3(2), 165–168.
- Tolossa, D. (2001). Causes of seasonal food insecurity in oromiya zone of amhara region: Farmers’ view. International Conference on Contemporary Development Issues in Ethiopia, August 16-18, 2001, Kalamazoo, Michigan.
- WPF. World Food Programme: Productive Safety Net Programme. (2016). Quick fact sheet: Last updated. September 2013.
- Wudil, A. H., Usman, M., Rosak-Szyrocka, J., Pilař, L., & Boye, M. (2022). Reversing years for global food security: A review of the food security situation in Sub-Saharan Africa (SSA). International Journal of Environmental Research and Public Health, 19(22), 14836. https://doi.org/10.3390/ijerph192214836
- Yamane, T. (1967). Statistics, an introductory analysis (2nd ed.).