
 ?Mathematical formulae have been encoded as MathML and are displayed in this HTML version using MathJax in order to improve their display. Uncheck the box to turn MathJax off. This feature requires Javascript. Click on a formula to zoom.
Abstract
This study was conducted to analyze the determinants of urban household income diversification and its relation to household food security status in Ethiopia. A cross-sectional research design and mixed research method of the sequential transformative strategy were used. A multistage sampling procedure was used to select 200 households. Primary data were collected with the aid of household surveys, key informant interviews, and focus group discussions. The study used descriptive statistics, Simpson diversity index, per-capita calorie consumption, ordered logistic regression model, and simple linear regression model to analyze the socio-economic data, level of income diversification, food security status, determinants of income diversification, and the effect of income diversification on household food security respectively. The overall mean of household income was 70,241.5 birr. The Simpson diversity index result showed that 8%, 24%, 53.5%, and 14.5% of the households were no, less, average, and high diversifiers respectively with a mean of 0.36. The per-capita calorie consumption result indicated that 53% of households were food secure and 47% of households were food insecure. The ordered logistic regression model revealed that education level (B = 0.72, p < 0.01), access to credit (B = 2.9, p < 0.01), information access (B = 0.7, p < 0.05), landownership (B = 2.1, p < 0.01)and access to training (B = 1.1, p < 0.01) had positive effect while access to market (B = −1.1, p < 0.05) had negative effect. The result of simple linear regression analysis result revealed that income diversification (B = 0.2, p < 0.01) has a positive and significant effect on food security. To improve urban food security, the government and scholars should consider the livelihoods of the urban poor, and further studies should be conducted in urban areas.
IMPACT STATEMENT
Ethiopia’s urban areas are currently witnessing an increase in food insecurity. This is because the government pays fairly little attention to the urban poor, and the majority of research on the influence of income diversification and its relation to food security concentrates on the country’s rural poor. The government and practitioners fail to realize the secret crisis of urban food insecurity in Ethiopia. This is because there are not enough statistics on overall poverty; it’s often assumed that people living in cities are usually better off, which magnifies the issue. Chronic food insecurity and low standards of living have significant political and economic problems. Thus the purpose of this study is to provide clues on income diversification and its relation to food security in Yejube town, Amhara region, to development planners, policymakers, and specialists in food security.
REVIEWING EDITOR:
Introduction
Nowadays welfare of the poor across the world is subjected to more challenging shocks and stressors (Constas et al., Citation2014). According to Doss et al. (Citation2018) and Hamilton et al. (Citation2020), Political violence, climate change, and food price crises are all shocks that have an immediate and negative impact on the availability of food, its accessibility, and utilization, as well as disrupting the stability of food supply of urban poor in sub-Saharan Africa. Like other African countries, Ethiopia is a country that suffered from different climate variability and other shocks. Currently, food insecurity has been intensifying in urban areas of Ethiopia since 2004 (Birhane et al., Citation2014), accompanied by a high food price, recurrent droughts, low productivity due to limited use of agricultural inputs, unemployment, and inflation of food prices (Mohamed, Citation2017; Ocho et al., Citation2017). Due to this fact, a large portion of the country’s population has suffered from chronic and transitory food insecurity. As a result, the name of the country has been repeatedly mentioned in connection with famine and food insecurity across the globe (Atara et al., Citation2020). Accordingly, more than 10 million people required emergency food assistance in 2016, following the El Niño drought in 2015 affected many parts of Ethiopia. On the other hand, works of literature indicate that about 10% of Ethiopians are chronically food insecure and this figure rises to more than 15% during drought years and 2,238,761 children require treatment for severe acute malnutrition (Endalew & Gashaw, Citation2016). It accounts that 33 million people face this challenge and more than 35% of the total households face food insecurity at the national level (Endalew & Gashaw, Citation2016).
To deal with those problems, ensuring urban food security (Berlie, Citation2020) through engaging in multiple sources of income with reliable amounts (Dev et al., Citation2017), is essential. According to Gebru et al. (Citation2018), diversification into non-farm activities plays a significant role in enhancing households’ income. In this regard, several authors (e.g. Aababbo & Sawore, Citation2016; Adem et al., Citation2018; Ahmed, Citation2016; Demissie & Legesse, Citation2013; Teshome & Khalil, Citation2013) in Ethiopia, and (Agbola et al., Citation2008; Alobo et al., Citation2020; Dev et al., Citation2017) abroad, studied on the level and determinants of income diversification. In line with, determinants of income diversification and its effect on households’ food security, scholars (e.g.Adem et al., Citation2018; Adem & Tesafa Citation2020; Agbola et al., Citation2008; Asmamaw, Citation2019; Bassie, Citation2014; Dev et al., Citation2017; Etea et al., Citation2019) studied in rural areas. Those scholars found income diversification has positive effects on households’ food security. On the other hand, a few scholars (Bigsten et al., Citation2005; Bigsten & Makonnen, Citation1999; Dunn, Citation1997; Ersado, Citation2003) tried to study income diversification strategies in urban settings. Those studies were limited to a mere description of the extent and the change in the extent of income diversification at the household level. In addition, there is no empirical evidence as to the major motivations and factors that prompt urban households in general and poor urban households, in particular, to have diversified or multiple sources of income in Ethiopia.
From these points of view, the first gap observed is recent studies on the determinants of income and food security mainly focused on rural areas. The second gap that can be mentioned is to date; there are limited studies on urban household income diversification strategies neither in Ethiopia nor in Yejube town. Therefore, it is believed to be essential to examine determinants of income diversification and its relation to urban households’ food security in urban contexts. Thus, ‘The general objective of this study was to examine determinants of urban household income diversification and its relation to food security in the Yejube town administration’ and the result of this study may serve as a reference for further research. The research questions of the study were developed based on the objectives as follows; What is the status of household income diversification in the study area?; What are the determinants of household income diversification in the study area? and What is the food security status of households in the study area?
Conceptual framework of the study
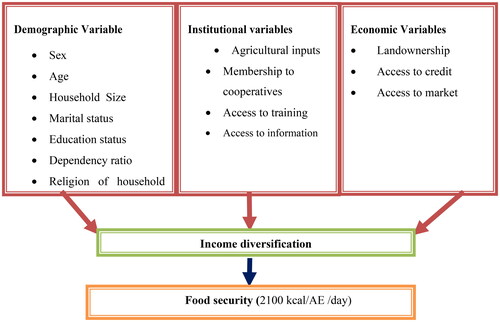
The conceptual framework for this study was constructed in the context of the study area drawn from demographic, institutional, and economic variables considering the effects of these variables on the income diversification status of households. Furthermore, the food security status of households was determined using dietary energy supply (2100 kcal/AE/day) as a cut-off point (≥2100 kcal/AE/day, food secure and <2100 kcal/AE/day, food insecure) with income diversification status (no, low, average, and high diversification) of households in the study area ().
Figure 1. Conceptual framework of the study.
Source: Modified from Demissie and Legesse (Citation2013).
Research methodology
Description of the study area
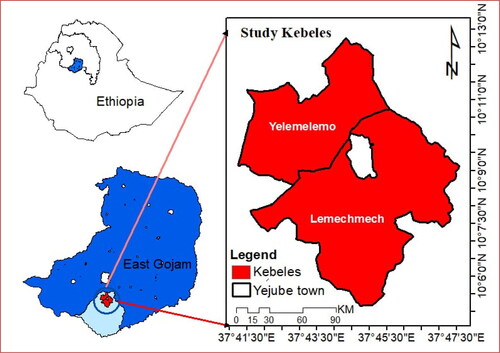
The study area, Yejube town, is located in Baso Liben Woreda, East Gojjam Zone of Amhara National Regional State at a distance of 27 km from Debre Markos in the South direction, 292 km from Bahir Dar, and 317 km from Addis Ababa (Elemineh et al., Citation2020). Yejube is located at 10˚9′0′′N and 10˚10′0′′N latitude; and 37˚44′0′′ E and 37˚46′0′′E longitude (Mekuriaw, Citation2019); with an elevation of 2211 meters above sea level. Trade is the main economic activity in the town. Traders purchase different cereals mainly from the farmers and sell them to the mainstream market in Debre Markos and Addis Ababa. This fuels other economic activities like small hotels and restaurants. According to the Central Statistics Agency, Yejube town has a total of 2071 households with a total number of populations 11,045, including 5765 males and 5280 females. Around 90 percent of the town residents are Orthodox Christians. The rest are Muslims and Protestants. Yejube town has a mean annual temperature of 15.5–20 °C. The mean annual rainfall ranges from 900 and 1200 millimeters and its pattern is unimodal ().
Figure 2. Map of the study area.
Source: Author computation, 2021.
Research design
This study applied a cross-sectional research design since the role of a cross-sectional research design is to manage the collection of relevant data with minimal consumption of effort, time, and money considering the research objectives (Kothari, Citation2004). The purpose of adopting a cross-sectional research design for the study was to analyze the determinants of income diversification and its relation to food security at a given point in time. In line with this, the explanatory sequential mixed method was employed. The explanatory sequential mixed method is one in which the researcher first conducts quantitative research, analyzes the results, and then builds on the results to explain them in more detail with qualitative research. It is considered explanatory because the initial quantitative data results are explained further with the qualitative data. It is considered sequential because the initial quantitative phase is followed by the qualitative phase.
Sampling techniques and sample size determination
Sampling techniques
In this study, a multi-stage sampling procedure was employed to select sample households. The study attempted to select a sample following the laws of the statistical theory of sampling that help to make valid inferences about the population based on the information or data obtained from the sample and to ascertain the degree of accuracy of the results. ‘Firstly among other regions of Ethiopia Amhara region is selected since it is the second food insecure region next to Tigary and still suffers from food shortages every year’ (Welderufael, Citation2015). Moreover, in this region, more than 2 million people requested food assistance every year between 1995 and 2014 (Kasie et al., Citation2017). Gojam is one of the zones located in the Amhara region including east and west gojam. From East Gojjam and West Gojam zones, East Gojam was selected since the prevalence of food-insecure households in East Gojam was greater than in West Gojam (Motbainor et al., Citation2016). Secondly, among east Gojam woreda towns, Yejube was selected purposively. Since urban food insecurity has become rampant in small towns in Ethiopia (Tegegne, Citation2015); the livelihood and food security status of Yejube town should be investigated. Besides, there was no prior study conducted on determinants of household income diversification and its relation to food security status in the study area.
Thirdly, the two urban Kebeles in the town were selected. Later, the sampled households were selected using systematic random sampling methods by taking lists of households from each Kebele administration office. Systematic sampling was employed as it enables to selection of a sample from a larger population systematically and randomly. The first unit of the household was used as a starting point and was selected through a simple random sampling technique by taking every 5th interval and repeating the process until the sampled number was fulfilled. This ensures the representation of the total population in the study area’.
Sample size determination
This study applied a simplified formula provided by Yamane (Citation1967) to determine the sample size. This study used a 7% precision level to minimize cost and save time. In addition, the probability proportional to sample size method was applied to draw the sample households. Hence, a total of 200 households were selected.
where n = the sample size; N = the finite population; e = the level of significance or limit of tolerable error; 1 = unit or a constant.
Since the number of households within kebeles is not equal, taking proportion is important. To take a sample proportional to the total population of the kebele, the following formula was applied. If Pi represents the proportion of the population included in stratum i, and n represents the total sample size, the number of elements selected from stratum i is equal to n multiplied by Pi or n × Pi (Kothari, Citation2004) ().
Table 1. Distribution of sample households across kebeles.
Pi = ni/Nwhere Pi refers to the proportion of the population included in kebele 01 and 02; ni = refers to the number of sample household; N = is the total number of the population; Pi = 200/2071 = 0.096.
Data sources and data collection
Primary data source
Primary data were collected using quantitative techniques of the structured household survey, focus group discussion, and key informant interviews.
Household survey
The survey questionnaire was translated into Amharic to collect the primary data. Then the data collectors were introduced and clarified the objective of the study to the household head. Before going to the final data collection schedule, a pilot survey was conducted and a pre-test was done to check the reliability of the data and to evaluate whether the household understood the question or not. As explained by Perneger et al. (Citation2015); if someone needs to develop a new questionnaire, it should be tested by a sample of (about 30–50) before going to the pre-final version of the translated questionnaire. Therefore, the questionnaire was pre-tested with randomly selected 15 male-headed and 15 female-headed households who were not members of the sampled households.
Key informant interview (KII)
This study employed key informant interviews to get information on personal thoughts, experiences, and attitudes related to factors that determine urban household income diversification activities and its relation to food security status. Face-to-face key informant interviews were held with two extension workers, one expert from the trade and industry office, one from the Amhara Credit and Saving Association, and one from the town job creation and food security office. Besides, two kebele leaders and six elders were interviewed using semi-structured interview questions. Key informants were selected purposively since they are expected to have deep knowledge about the subject matter.
Focus group discussions (FGDs)
Two separate FGDs were held in kebele 01 and 02 having 8 members for each. The participants were drawn from different sexes, ages, occupations, and varying durations of stay in the specific community. The participants respectfully requested their consent, time, and the information they provided.
Data analysis
Descriptive statistics
In this study, descriptive analysis was manipulated with the statistical software STATA 14.1. For description and presentation, the data counts, percentages mean, and standard deviations were used. The inferential statistical significance of the variables in the descriptive part was tested using the chi-square test. Furthermore, data were presented using tables and figures.
Simpson Diversity Index (SDI) is used to measure the level of income diversification. Among the various indices available, this study prefers SDI to the other approaches; as it takes into consideration both the number of income sources as well as how evenly the distributions of the income between the different sources are (Aboaba et al., Citation2019; Agyeman et al., Citation2014; Dev et al., Citation2017; Etea et al., Citation2019; Obalola, Citation2020). The value of SDI ranges between zero and one (1). Thus, zero denotes specialization (only one source of income, where Z = 1), and one is the extremity of diversification. Furthermore, SDI was preferred due to its wider applicability, computational simplicity, and robustness, to capture the income diversification of the households, following (Aboaba et al., Citation2019), the SDI was specified as:
(1)where SDI is a measure of income diversification, and Z is the income share of each activity, and Z is expressed mathematically as
, n is the number of income sources, ki is the income from each activity, and kt is the household’s total income.
When SDI is less than 0.01 there is no diversification; between 0.01 and 0.25 low diversification, between 0.26 and 0.50 average diversification, and when greater than 0.50 there is high diversification (Aboaba et al., Citation2019).
Food security analysis method
In this study, the daily calorie intake approach was used to measure the food security status of households based on the food security line defined in terms of the daily calorie intake recommended by FAO (Citation2005). This is due to the daily calorie intake method is better than the food expenditure method as it represents the actual food consumption pattern of households. In addition, the consumption method is less vulnerable to measurement errors since respondents’ data is measured and recorded during the 7-day approach in each household (Zegeye & Hussien, Citation2011). The government of Ethiopia has set the minimum acceptable weighted average food requirement per person per day as 2100 kcal/AE/day (FDRE, Citation1996) which is estimated to be 225 kg of food (grain equivalent) per person per year. The food security line which is 2100 kilocalories was used as a cutoff point after converting all household members into adult equivalent units (Aragie & Genanu, Citation2017; Debela & Abebe, Citation2017; Etea et al., Citation2019; Habtewold, Citation2019; Onunka & Olumba, Citation2017). The formula of adult equivalent is as follows.
(2)
(2)
where AEU = Adult equivalent unit, A = Number of adults above the age of 15 years, C = Number of children below the age of 15 years in a household.
Estimation of the calories acquired by a given household was done by using the following formula.
(3)
(3)
where Ci = level of kilocalorie acquired by the ith household in the study area. Aij = the weight in kilograms of the food commodity j by the ith household. Bj = the standardized food energy content of the jth food commodity.
Calorie acquired encompasses the calorie amount of all food acquired (own produced, purchased, and obtained as a gift and other transfers). According to Coates Jennifer and Bilinsky (Citation2007), there are two steps to constructing a food security index such as identification and aggregation. Identification is the process of defining a minimum level of food necessary to maintain a healthy life and this is known as the food security line which is 2100 kcal/AE/day. Aggregation is the process of deriving the food security statistics for households. The household daily calorie intake was obtained from the survey and where the quantity of food consumed by the household was estimated in the 7 days. The calorie content was estimated by using the nutrient composition table of commonly eaten foods in Ethiopia. Weekly per capita calorie is calculated by dividing the estimated total household calorie intake by the family size (all adult equivalent) and to get the household’s daily per capita calorie intake divided the household’s per capita calorie intake by seven (Babatunde et al., Citation2007).
Econometrics model analysis
Under this subsection, the study used an ordered logistics regression model to analyze the determinants of urban household income diversification by taking income diversification status as a categorical dependent variable with explanatory variables. This study conducted the entire necessary model diagnosis test including the model specification test for the overall model fit (goodness of fit), multi-colinearity problem, and link test or test for a model specification error test. The explanatory variables were checked for the existence of multi-collinearity or association between the dependent variables to identify the determinant factors affecting household income diversification status by using Variance Inflation Factor (VIF) as the rule of thumb, (a variable those have 1 VIF not correlated, between 1 and 5 moderately and greater than 5 have highly correlated) (Education, Citation2010).
From this respect as the mean of VIF was 1.28 has medium colinearity for each variable. Multicollinearity indicator- VIF ranged from 1.07 to 1.53 and the Tolerance index ranged from 0.65 to 0.93. As a result, it suggested that regression coefficients did not suffer from Multicollinearity among the independent variables. Hence, all explanatory variables were used for estimating the model. Furthermore, the adjusted R-square result (0.765) indicates that the ordered logit model was observed as an appropriate measure of the predictive power of ordered response models. This implies that 76.5% of the variation in income diversification was explained by the model. According to Singh (Citation2007), adjusted R2 of above 75 percent is very good; 50–75 percent is good; 25–50 percent is fair, and below 25 percent is poor and in the given case, the model can be termed as very good. As explained by Megan (Citation2010) chi-square value criterion was also used to evaluate the effectiveness of the model. The result revealed that the chi-square value of (X2 = 133.75, p = 0.000) shows that variables in the model are fit to explain the income diversification status of households, also the value of the probability of chi-square of p = 0.000 shows the overall significance of the model at 1% probability level (p < 0.01). This result supports the working hypothesis; that a household’s income diversification is determined by some explanatory variables. As a result, the model revealed six explanatory variables that significantly determined household income diversification. Additionally, the estimated cut-off points (μ) satisfy the conditions that μ1 < μ2 < μ3 implying that these categories are ranked in an ordered way (Knight et al., Citation2005).
The ordered logistic regression model was used to examine the determinants of urban household income diversification on the income diversification status of urban households. The ordered logistic regression technique is used when the dependent variable is ordered categorical, in which case the events of the dependent variables are ordered (Aboaba et al., Citation2019; Babatunde & Qaim, Citation2009; Bealu, Citation2019; Davendra et al., Citation2005; Greene, Citation2000, Citation2003; Obalola, Citation2020). In this study, the dependent variable is income diversification status, which includes, income sources from on-farm only, off-farm, non-farm, on-farm + non-farm, and on-farm + off-farm + non-farm income-generating activities. The ordered logistic regression model is used to predict an ordinal dependent variable given one or more independent variables. The following assumptions were checked. The dependent variable is measured on an ordinal level. The dependent variables are categorical or ordinal, Non-multi-collinearity while the independent variables are highly correlated with each other, proportional odds i.e. that each independent variable has an identical effect at each cumulative split of the ordinal dependent variable (Gujarati, Citation2004).
The effect of explanatory variables on income diversification status was estimated with the ordered logit model, this was used because income diversification status outcome was ordered or ranked. Following (Greene, Citation2000) the ordered logit model was specified as:
(4)
(4)
Y* = income diversification status of households (0, 1, 2, 3); Prob (Yi = j) = J = income diversification status of households in the order set as: j = 0, if no income diversification; j = 1, if low income diversification; j = 2, if average income diversification, and j = 3, if high income diversification. δj = parameters to be estimated, εj = error term. Xj = vector of explanatory variable conditioning the choice of the jth alternative including. δ1 = sex of household head, δ2 = age of household head, δ3 = marital status of household head, δ4 = household size, δ5 = dependency ratio, δ6 = level of education, δ7 = access to training, δ8 = access to credit, δ9 = access to information, δ10 = religion of household, δ11 = access to agricultural inputs, δ12 = membership to cooperative, δ13 = access to market, and δ14 = land ownership.
Marginal effects were generated to determine the predictive power of variables in the model. The probabilities of respondents being in any of the identified categories were determined using the natural log of the cumulative distribution. Following Borooah (Citation2002) and Obayelu (Citation2012), the marginal effects of changes in the independent variables are computed as where: 0, 1, 2, 3 are the various categories (no income diversification, low-income diversification, average income diversification, and high-income diversification), χ is the independent variable, μ0, μ1, μ2 are the cut-off values for the ordered logit model and f is the cumulative probability function. The marginal effect for the dummy variable was calculated by taking the probabilities for each category at 0 and 1 and taking the difference (Obayelu, Citation2012).
(5)
(5)
(6)
(6)
(7)
(7)
(8)
(8)
Definition of variables
Dependent variables
Income diversification status is a dependent categorical variable and indicates the level of income diversification of a household engaged in on-the-farm, off-farm, nonfarm, on-farm, and farm + off-farm + nonfarm income-generating activities. It is measured by the Simpson Diversification Index (SDI) as ordered values with four levels of categories such as ‘No diversification (SDI ≤ 0.01); Low level of diversification (SDI = 0.02–0.25); Average level of diversification (SDI = 0.26–0.50) and high level of diversification (SDI > 0.50)’ (Aboaba et al., Citation2019). These were used to estimate determinants of income diversification using the ordered logistic regression model.
Household food security
Household food security is a continuous variable measured in calorie availability per adult equivalent per day in kcal. It was a dependent variable and examined taking income diversification as an explanatory variable.
Explanatory variables
Based on the information obtained from an in-depth review of both theoretical and empirical literature on the similar topics of this study, the potential explanatory variables of income diversification status are identified and described and their relationship with the dependent variables is hypothesized as follows ().
Table 2. Definitions and hypothesized relationship of variables.
Results and discussions
Mean share of household income sources
The sample households obtain their income from different sources with varied proportions. The overall mean of households’ income was 70241.5 ETB. The result obtained in this study was greater than the national data which was 9549 ETB found by the study of Bassie (Citation2014). As indicated in , the survey result revealed that the mean of non-farm, off-farm, on-farm, on-farm + non-farm, and on-farm + off-farm + non-farm were 35132.4, 12410.2, 12522.7, 5856.1, and 4319.9 ETB respectively.
Table 3. Mean share of household income sources.
Measurement of income diversification
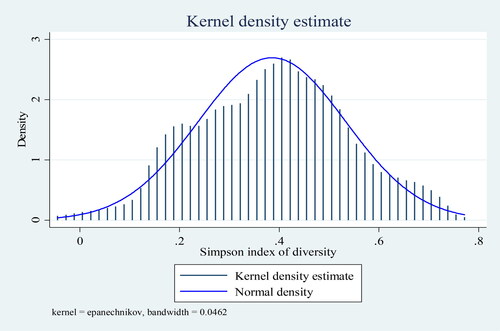
As indicated in income diversification status was calculated by using the Simpson diversity index (SDI). The first specific objective (measure the income diversification status of households) is intended to be addressed here accordingly; the SDI result revealed that more than half 53.5% of the households typically diversify their income source on average (0.26–0.50). It implies the majority of households in the study area engage in a variety of income-generating activities to enhance their livelihood status. The percentage of no, low and high diversifiers were 8, 24, and 14.5 respectively. The mean SDI among the households was 0.36 which implies that the majority of the households averagely diversify their income source. This result is in tandem with the findings of Aboaba et al. (Citation2019).
Table 4. Level of households income diversification status.
As compared with the result of other previous studies, the result is more than the mean income diversification index of 0.338 Agyeman et al. (Citation2014) in Ghana, 0.25 Dev et al. (Citation2017) in Bangladesh, 0.24 Adem et al. (Citation2018) in Ethiopia, 0.316 of Obalola (Citation2020) Nigeria and 0.02 of Ayana et al. (Citation2021) in Nigeria, but less than Babatunde and Qaim (Citation2009) of 0.479 in Nigeria and 0.5775 of Addisu (Citation2017) in Ethiopia.
As per the result of focus group discussions and key informant interviewees, several factors hinder households’ income diversification in the study area. These include; high credit interest rates, lack of initial capital, lack of awareness, inability to promote a culture of work on different activities, and lack of job opportunities in the study area. As a result, the income diversification status of households in the study area is not as high as Babatunde and Qaim (Citation2009) of 0.479 in Nigeria and 0.5775 of Addisu (Citation2017) in Ethiopia. One key informant from the Credit and Savings Association said that;
Because of the frustration of the high credit interest rate; households don’t want to take credit to improve their income diversification status. They want to rely on their single income sources. This made them trapped by food insecurity. They worry about their daily consumption rather than enhancing their capacity to escape from food insecurity. (Key informant interview, 2021)
Furthermore; one elderly Key informant from kebele 02 forwards her concern regarding the scarcity of initial capital in the study area as follows.
I do not have the resources to raise my children but I believe in myself and I am still strong. I believe that if I get opportunities and startup capital, I am capable of working. I am now doing petty trade on market day only due to financial constraints, but if I get capital support I want to be engaged in a more rewarding trade by expanding what I am doing now. (Key informant interview, 2021)
Contrary to what is stated above, an FGD participant from kebele 01, a man who is dependent on his parents and is a bachelor’s degree holder spoke the following;
I have been employed but the monthly salary I used to get was not enough to cover my basic expenses. So I left my job. I must get a job with a monthly salary of not less than Birr 4461 to meet my basic needs. Right now I am expecting a better job. Until I get a good job I better continue to depend on my family. (FGD, 2021)
It is also possible to show the household Simpson diversity index on a continuous scale by using a kernel density graph. The following graph shows the distributions of the overall Simpson diversity index in the study area ().
Figure 3. Distribution of Simpson index of diversity.
Determinants of urban household income diversification
As expected, the result of the ordered logistic regression model revealed that the educational level of the household head had a positive (0.72) association with income diversification status at p < 0.01 or 1% (p = 0.000) significant level. The positive coefficient of education agrees with the results of studies earlier reported by Minot et al. (Citation2006) and Zerihun (Citation2017) indicated that education gives individuals access to many different economic activities, either as a formal requirement for wage-earning jobs or because it helps them in setting up and managing their small businesses. The positive sign also indicated that when the level of education increases the level of income diversification also increases. This result is also consistent with the works of (Akinyemi et al., Citation2021; Idowu et al., Citation2011; Winters et al., Citation2009), where the level of education was found to be an important determinant factor of the level of income diversification.
The marginal effect result of educational level revealed that as the educational level of the household head increased by one year, keeping other variables constant, the probability of being in no income diversification status categories decreased (less likely) by 3.9%, in low-income diversifier categories was decreased (less likely) by 6.3% (). This result was similar to the findings of Oluwatayo (Citation2009) and Demissie and Legesse (Citation2013). They stated that educated persons specialized in one activity rather than diversification. On the other hand, keeping the influence of other variables constant, as the educational status of a household head increased (more likely) by one year, the probability of being in average income diversification categories increased (more likely) by 2.7%; in high-income diversifiers, categories increased (more likely) by 6.6% (). This result is in harmony with the study of Elias (2016) and Yishak (Citation2017) indicated that educated persons have better skills, experience, knowledge, and capability to search for different sources of income and jobs. Besides this, the result agrees with the prior findings of Ahmed (Citation2016; Yishak, Citation2017). On the contrary, this result contradicts Oluwatayo (Citation2009); Demissie and Legesse (Citation2013) by arguing that educated persons specialize in one activity rather than diversification.
Table 5. Determinants of urban household income diversification.
As per the result shown in , access to credit affected the level of income diversification of the household’s head positively (2.96) and was significant at p < 0.01 or 1% (p = 0.000) probability level. The increase in access to credit results in an increase in income diversification. This result is in line with the findings of Akinyemi et al. (Citation2021). Keeping other variables constant, the marginal effect of access to credit indicated that as access to credit increased by 1 birr, the probability being no income diversification categories decreased (less likely) by 12.6% (−0.12.6); in low-income diversifiers, categories were decreased(less likely) by 25.8% (−0.258). This result contradicts the result reported by Demissie and Legesse (Citation2013), who noted that credit can reduce liquidity constraints and increase the capacity of households to start an off-farm business. On the other hand, controlling the influence of other explanatory variables constant, as credit access was increased by 1 birr the probability of a household head to be average income diversification categories increased(more likely) by 11.44%, in high-income diversifier were increased (more likely) by 27% (0.27). This result is in line with the findings of Babatunde and Qaim (Citation2009); Zerai and Gebreegziabher (Citation2011) who noted that credit can reduce liquidity constraints and increase the capacity of households to start a non-farm business.
As hypothesized, access to landownership is significant at p < 0.01 or 1% (p = 0.000) probability level and has a positive effect (2.12) on the level of income diversification status and the positive sign indicates that as ownership of land increases income diversification as an increase (). This result is supported by the study of Akinyemi et al. (Citation2021) who conclude that a household’s farm size positively influences income diversification. Keeping the influence of other explanatory variables constant, the result of the marginal effect of access to land ownership revealed that as landownership is increased by 1 hectare the probability of being no income diversification was decreased (less likely) by 9.2% (−0.092), in low-income diversifier categories was decreased (less likely) by 18.5% (−0.185). The result is consistent with the study of Adugna and Wagayehu (Citation2012) who argued that when the landholding size of a household increases by one hectare the probability of engaging in off-farm and non-farm livelihood activities decreases because farmers with larger farmland sizes were encouraged to involve more on farming activities.
On the contrary, this result contradicts the study of Ellis and Allison (Citation2004) which indicated that there is a positive relationship between the share of income generated from non-farm income sources and the size of landholding since households that have large land size could get more income from agricultural production and could easily inter into off-farm and non-farm activities. On the other hand, as landownership increased by 1 hectare the marginal effect of being average income diversification categories increased(more likely) by 8%, in high-income diversifiers categories was increased (more likely) by 19.3% (0.193) (). This result is congruent with the findings of Andersson (Citation2012; Winters et al., Citation2009) who stated that larger landholdings have mainly been linked to increasing income diversification.
Confirmation of the prior expectation, access to training was found to be significant at p < 0.01 or 1% (p = 0.001) probability level and has a positive effect (1.138) on the level of income diversification status. Households’ income diversification status improves as their access to training increases. As indicated in , keeping the influence of other explanatory variables constant, the result of the marginal effect of access to training revealed that as training access is increased by one unit, the probability of being no income diversification categories decreased (less likely) by 4.8% (−0.048), in low-income diversifier categories was decreased (less likely) 9.9% (−0.099). On the other hand as training access, increased by one unit the marginal effect of being average income diversification categories increased (more likely) by 4.3%, in high-income diversification categories was increased (more likely) by 10.3% (0.103) (). This result is congruent with Agyeman et al. (Citation2014), and Dimova and Sen’ (Citation2010) studies indicated that farm households require government and private sector support to increase the gains made in participating in various diversification strategies through training to raise their living standards. The result is also confirmed by Asmamaw (Citation2019) noted that the training service was positive and significant at a 1 percent probability level.
In agreement with the prior expectation, market access has a statistically significant and negative effect (−1.00) with household income diversification status at less than 5% (p = 0.028) probability level inferring that the decrease in access to the market leads to a decrease in income diversification. as indicated in . The marginal effect in indicates that, if households’ access to the market was increased by one unit the probability of being no income diversification categories increased (more likely) by 4.2%, in low-income diversifiers categories were increased (more likely) by 8.7%. This result is supported by the findings of Demissie and Legesse (Citation2013) and Gebreyesus (Citation2016) who revealed that walking distance to the nearest market yielded a positive and significant influence on the level of livelihood diversification. The likely reason for a positive and significant relationship between market distance and non-farm and off-farm activities could be that residing nearer to the market enables farm households to engage in non-farm and off-farm activities mainly trading and service provision. Nearness to the market center provides access to additional income via non-farm and off-farm employment opportunities, easy access to information on inputs, and transportation (Dorward et al., Citation2003; Gemechu et al., Citation2016).
On the other hand, the probability of being in average income diversification categories decreased (less likely) by 3.9% in the high-income diversifier category decreased (less likely) by 9% (−0.09) as access to the market increased by one unit. It is confirmed by the study of Gebru et al. (Citation2018) who explained that the more households are distant from the market center, the more disadvantaged from diversifying their livelihood income into non-farm options. Furthermore, the result indicated that household heads who have market access were less likely to be in the no and low-income diversifier and more likely to be in the average and high-income diversifier category in the study area.
The result of the ordered logistic regression model in showed that access to information has a statistically significant positive relationship with household income diversification status at less than p < 0.05 or 5% (p = 0.039). Increased access to information leads to an increase in income diversification. It shows that if access to information of sampled households there is the more likely to be in average and high and less likely in the none and low-income diversification category.
The marginal effect in shows that as access to information about households increases by one unit keeping other variables constant, the probability of being in the no-income diversification categories decreased (less likely) by 3% in the low-income diversification category decreased (less likely) by 6.3% (−0.063). On the other hand, as access to information increased by one unit, the probability of being in average income diversification categories increased (more likely) by 2.7% (0.027), and in the high-income diversification category increased (more likely) by 6.5% (0.065). This result is in line with the findings of Asmamaw (Citation2019).
Food security status of households
To identify food secure and food insecure households, the following activities were undertaken; food items consumed for seven days were obtained from respective households. After being converted to kcal/day basis as made ready to calculate kcal/AE/day. Household size which was collected in number was converted to adult equivalent. Finally, the household whose caloric consumption is greater than or equal to 2100 kcal/AE/day was categorized as food secure; on the other hand, a household with caloric consumption is less than 2100 kcal/AE/day was categorized as food insecure households.
In this section, the third specific objective of the study (analyze the food security status of households) is anticipated to be addressed here. Based on the recommended daily calorie intake of 2100 kcal, it was observed that 53% of the respondents were food secure and the remaining 47% were food insecure. However, the majority of households were food secure in the study area; the food insecurity situation in the study area was found to be greater than the national level households’ food insecurity level (35%) as reported by Endalew and Gashaw (Citation2016).
The output of this study was similar to the findings of (Aragie & Genanu, Citation2017; Debela & Abebe, Citation2017; Habtewold, Citation2019) who reported that the majority of households consumed more than 2100 kcal/AE/day. On the other hand, this result is different from (Addisu, Citation2015; Echebiri & Onwusiribe, Citation2017; Etea et al., Citation2019). Those authors reported that the majority of households consumed below 2100 kcal/AE/day.
Based on the findings of KII, there were several ways in which people responded to food insecurity in the study area. For instance, poor household heads spend a lion’s share of their income on food items other than basic necessities. This was common among interviewees which gave out to show the severity of food insecurity within poor households where food shortages had become a permanent feature of daily life. In this regard, one key informant from Job creation and food security offices stated as follows ().
Table 6. Households food security status.
Due to skyrocketing inflation of food and non-food items, an average worker’s wage was inadequate to buy sufficient food for most households. Consequently, they become food insecure and forced to consume the same or monotonous meals. As a result, poor households in the study area found themselves spending a large share of their little income on food. (Key informant interview, March 2021)
Moreover, the depth of household food insecurity in Yejube town was not only reflected in the prevalence of households that were food insecure but also the limited number and quality of food groups consumed by households. A key informant from the kebele 01 administration office expressed the severity of the household’s food security situation in such a way:
The price of cereals and other goods is too expensive these days. Each day households worry about how to feed their family and where to get money. They cannot think of buying expensive foodstuff such as teff for injera, and bean or pea pulses for shirowat. They buy cheap cereals such as millet, maize, and guaya (vetch). Regularly they use meals made of these cheap cereals while they consume some meat and teff injera occasionally during holidays. (KII, March 2021)
Relationship of income diversification and food security status
As shown in , among high-income diversifier households, 89.7% were food secure while the remaining 10.3% were food insecure. This result is in line with a study conducted by Etea et al. (Citation2019). Those authors indicated that an increase in income diversification increases the food security conditions of the households. Furthermore, this result agrees with previous studies by Robaa and Tolossa (Citation2016) and Onunka and Olumba (Citation2017), the findings of their study declared that income diversification enhances the food security condition of households. On the other hand, the food security and insecurity status of average income diversifier households were 55.1% and 44.9% respectively. In addition to this, the percentage of the food security and insecurity status of no and low diversifiers were found to be 18.7, 37.5, 81.3, and 62.5 respectively. The chi-square test ( result showed that there is a statistically significant association between income diversification status and household food security. Furthermore, Pearson correlation analysis results showed that income diversification status has a strong relationship with household food security at a 1% significant level (). This indicated that as income diversification increased, the food security status of the household also increased. This result is in agreement with the findings of (Aboaba et al., Citation2020; Asfaw et al., Citation2017; Asmamaw, Citation2019; Dev et al., Citation2017; Etea et al., Citation2019; Gani et al., Citation2019).
Table 7. Relationship of income diversification and food security status.
Conclusions and recommendations
Conclusions
This study attempts to analyze the determinants of income diversification and its relation to household food security in Yejube town, Amhara region, Ethiopia. Based on the result of descriptive analysis, households in the study area generate income from the farm only, non-farm, off-farm, non-farm, on-farm, and non-farm + on-farm + off-farm income generating activities with a share of 11.5%, 61.50%, 10.5%, 9.50% and 7% respectively. Moreover, the result of the Simpson index of diversity shows that more than half (53.5%) of respondent households were average income diversified while, the remaining households with high, low, and none diversifier share 14.5%, 24%, and 8% respectively. In line with this, the mean income diversification status of households in the study area was 0.36, which falls under the average diversification status category. Similarly, households’ food security status revealed that 53% and 47% of households were food secure and insecure with a mean of 2539.307 and 1880.254 kcal/AEU/day respectively.
Furthermore, the ordered logistic regression model result revealed that six explanatory variables including educational level, access to credit, access to information, access to market, land ownership, and access to training positively and significantly influence the income diversification status of households at less than 1% and 5% probability level. However, market access has a negative and significant effect on the level of income diversification at less than 5% significant levels. In addition, a chi-square test result indicates that income diversification has a positive effect on food security. Besides the study conclusion indicates that households’ food security status improves as income diversification increases.
Recommendations
Recommendations were suggested for consideration in light of the findings. The recommendation should be assumed to give insight for future policy formulation regarding the enhancement of livelihoods and ensuring food security and also help to inputs for further investigation in the study area in particular and at the country level in general. Thus, these policy recommendations are possibilities to mitigate issues related to food security problems of people living, in Yejube town and the people who live on the same characteristics in another area of the country. The research findings show that access to training is positive and significant, and it is vital for enhancing households’ levels of income diversification in the study area. Therefore, policies, strategies, and programs should primarily focus on planning and providing training for extension workers, households, and livelihood and food security experts in the study area. The positive and significant outcome of credit access suggests it is essential for enhancing households’ income diversification status. Therefore, strengthening credit associations is advisable to improve the livelihoods of households.
On the other hand, income diversification was positive and significant to food security. Thus to improve the welfare of food-insecure households, governmental and nongovernmental organizations should pay special attention to launching an urban productive safety net program in the study area. According to the results of the study, access to information is considered one of the significant factors as a result the concerned body has to work more to increase access to information in the study area to explore the existing opportunities for income diversification through non-farm income-generating activities.
The study also suggests that household market accessibility is crucial for enhancing income diversification. To encourage households to diversify their income status, it is necessary to implement transportation services and better infrastructure. The finding also shows that land ownership has a positive and significant impact on households’ income diversification and it means that to ensure food security, households need to diversify their income sources from their small plots of land. To achieve this, concerned bodies should focus on developing appropriate urban farming strategies and policies that enable households to diversify their income from limited plots of land. Finally, additional research should be carried out to acquire more empirical findings on the determinants of household income diversification and its relation to the food security status situation in Yejube town administration as well as to other cities in Ethiopia.
Disclosure statement
No potential conflict of interest was reported by the author(s).
Data availability statement
The dataset supporting the conclusions and recommendations of the study is included in the article.
Additional information
Notes on contributors
Derib Muluneh Liyew
Derib Muluneh Liyew holds a BSc and MSc degree in disaster risk management and sustainable development from Bahir DarUniversity. Mr. Derib is working as a researcher and training coordinator in the city government of Addis Ababa Disaster risk management training institute. His research intention focuses on rural and urban livelihood, food security, and disaster-related issues.
Yilebes Addisu Damtie
Yilebes Addisu Damtie is my principal advisor. He is a senior lecturer and researcher at Bahir Dar University, institute of disaster risk management and food security studies. He published many articles on urban and rural Livelihoods, Food security, shocks and Vulnerability, and early warning.
References
- Aababbo, Y. E., & Sawore, A. M. (2016). Assessing determinant factors of income diversification among rural farm households in Ethiopia: The case of Leemo and Anileemo Districts, Hadiya Zone, South Nation Nationalities People Region. International Journal of Science and Research, 5(12), 1–19. https://doi.org/10.21275/ART20163308
- Aboaba, K. O., Adenle, S. M., Sowunmi, E. O., & Akinade, A. I. (2019). Nexus between poverty and livelihood diversification among rural households in Nigeria: A multidimensional poverty index approach. International Journal of Advanced Research and Publication, 3(5), 168–175.
- Aboaba, K. O., Akamo, A. A., Fadiji, D. M., & Obalola, T. O. (2020). Food security and income diversification nexus: USDA approach. Scientific Papers Series-Management, Economic Engineering in Agriculture& Rural Development, 20(3), 13–23.
- Addisu, Y. (2017). Livelihood strategies and diversification in western tip pastoral areas of Ethiopia. Pastoralism, 7, 9. https://doi.org/10.1186/s13570-017-0083-3
- Addisu, Y. (2015). Food insecurity and its determinants in households of Ethiopia: The case of Libo Kemkem District. Amhara National Regional State, 41, 95–101.
- Adem, M., & Tesafa, F. (2020). The intensity of income diversification among small-holder farmers in Asayita Woreda, Afar Region, Ethiopia Intensity of income diversification among small-holder farmers in Asayita Woreda, Afar Region. Cogent Economics & Finance, 8(1), 1759394. https://doi.org/10.1080/23322039.2020.1759394
- Adem, M., Tadele, E., Mossie, H., & Ayenalem, M. (2018). Income diversification and food security situation in Ethiopia: A review study. Cogent Food & Agriculture, 4(1), 1513354. https://doi.org/10.1080/23311932.2018.1513354
- Adugna, E., & Wagayehu, B. (2012). Causes of household food insecurity in Wolaita. Full-length research paper. Journal of Stored Products and Postharvest Research, 3(3), 35–48.
- Agbola, P. O., Awotide, D. O., Ikpi, A. E., Kormawa, P. M., Okoruwa, V. O., & Babalola, D. A. (2008). Effect of income diversification strategies on food insecurity status of farming households in Africa: Result of analysis from Nigeria (No. 725-2016-49415). https://ageconsearch.umn.edu/record/44388.
- Agyeman, B. A. S., Asuming-Brempong, S., & Onumah, E. E. (2014). Determinants of income diversification of farm households in the Western Region of Ghana. https://econpapers.repec.org/scripts/redir.pf?u=https%3A//ageconsearch.umn.edu/record/195729/files/3_Agyeman.pdf;h=repec:ags:qjiage:195729
- Ahmed, B. (2016). What factors contribute to the smallholder farmers’ farm income differential? Evidence from East Hararghe. Oromia, Ethiopia Contribution/Originality, 6(7), 112–119. https://doi.org/10.18488/journal.2/2016.6.7/2.7.112.119
- Akinyemi, M., Olayinka, J. A., Junaidu, M., Ekpa, D., Bodaga, T., & Ibrahim, U. M. (2021). The determinants of livelihood income diversification among rural farming households in Osun State, Nigeria. Fudma Journal of Sciences, 5(2), 79–84. https://doi.org/10.33003/fjs-2021-0502-527
- Alobo, S., Bignebat, C., Alobo, S., & Patterns, C. B. (2020). Patterns and determinants of household income diversification in Rural Senegal and Kenya. HAL Id : hal-01608295 patterns and determinants of household income. https://agritrop.cirad.fr/568230/1/document_568230.pdf
- Andersson, D. (2012). Seasonality and farm/non-farm interactions in Western Kenya. Journal of Modern African Studies, 50(1), 1–23.
- Aragie, T., & Genanu, S. (2017). Level and determinants of food security in North Wollo Zone (Amhara Region – Ethiopia). Journal of Food Security, 5(6), 232–247. https://doi.org/10.12691/jfs-5-6-4
- Asfaw, A., Simane, B., Hassen, A., & Bantider, A. (2017). Determinants of non-farm livelihood diversification: evidence from rainfed-dependent smallholder farmers in north-central Ethiopia (Woleka sub-basin). Development Studies Research, 4(1), 22–36. https://doi.org/10.1080/21665095.2017.1413411
- Asmamaw. (2019). Determinants of income diversification and its implication on rural households food security in Gubalafto Wereda, Northern Ethiopia. Asmamaw.
- Atara, A.,Tolossa, D., &Denu, B. (2020). Analysis of rural households’ resilience to food insecurity: Does livelihood systems/choice/ matter? The case of Boricha woreda of sidama zone in southern Ethiopia. Environmental Development, 35, 100530. https://doi.org/10.1016/j.envdev.2020.100530
- Ayana, G. F., Megento, T. L., & Kussa, F. G. (2021). The extent of livelihood diversification on the determinants of livelihood diversification in Assosa Wereda, Western Ethiopia. GeoJournal, 87(4), 2525–2549. https://doi.org/10.1007/s10708-021-10379-5
- Babatunde, R. O., & Qaim, M. (2009). Patterns of income diversification in rural Nigeria: Determinants and impacts. Quarterly Journal International Agriculture, 4, 305–320.
- Babatunde, R., Omotesho, O., & Sholotan, O. (2007). Socio-economic characteristics and food security status of farming households in Kwara State, North-Central Nigeria. Pakistan Journal of Nutrition, 6(1), 49–58. https://doi.org/10.3923/pjn.2007.49.58
- Bassie, Y. (2014). Determinants of household income diversification and its effect on food security status in Rural Ethiopia: Evidence from Ethiopia longitudinal rural household survey. Addis Ababa University.
- Bealu, T. (2019). Analysis of livelihood diversification practice to promote rural households’ food security: The case of Hawassa Zuria District of Sidama Zone, Ethiopia. Journal of Development and Agricultural Economics, 11(1), 1–8. https://doi.org/10.5897/JDAE2018.0926
- Berlie, A. B. (2020). The invisible crisis of urban food security in Amhara Regional State, Ethiopia. Journal of Hunger & Environmental Nutrition, 18(4), 600–619. https://doi.org/10.1080/19320248.2020.1838983
- Bernard, A., & A., S., Edward. (2014). Determinants of income diversification of farm households in the Western Region of Ghana. Quarterly Journal of International Agriculture, 1, 55–72.
- Bigsten, A., & Makonnen, N. (1999). The anatomy of income distribution in urban Ethiopia. African Development Review, 11(1), 1–30. https://doi.org/10.1111/1467-8268.00001
- Bigsten, A., Kebede, B., & Shimeles, A. (2005). Dynamics of income distribution in urban Ethiopia 1994 - 1997. In Poverty, income distribution and labor markets in Ethiopia (pp. 100–132). Nordic Africa Institute, Uppsala. http://www.nordicafricinstitute.com/publications/download.HTML/91-71.
- Birhane, T., Shiferaw, S., Hagos, S., & Mohindra, K. S. (2014). Urban food insecurity in the context of high food prices: A community based cross sectional study in Addis Ababa, Ethiopia. BMC Public Health, 14(1), 680. (https://doi.org/10.1186/1471-2458-14-680
- Borooah, V. K. (2002). Logit and probit: Ordered and multinomial models (No. 138). Sage.
- Coates Jennifer, A. S., & Bilinsky, P. (2007). Household Food Insecurity Access Scale (HFIAS) for measurement of food access: indicator guide (p. 34). Food and Nutrition Technical Assistance Project, Academy for Educational Development.
- Constas, M., Frankenberger, T., & Hoddinott, J. (2014). Resilience measurement principles: Toward an agenda for measurement design. Food Security Information Network, Resilience Measurement Technical Working Group, Technical Series, 1.
- Davendra, G., Smale, M., Maxted, N., Cole, M., Sthapit, R., Jarvis, D., & Updhyay, M. P. (2005). Socioeconomic and agro-ecological determinants of conserving diversity on-farm: The case of rice genetic in Nepal. Nepal Agricultural Research Journal, 6, 1–10.
- Debela, M., & Abebe, W. (2017). Determinants of rural female-headed households’ food security in Ambo District, West Shewa Zone, Oromia Regional State, Ethiopia. Journal of Science and Sustainable Development, 5(1), 73–87.
- Demissie, A., & Legesse, B. (2013). Determinants of income diversification among rural households: The case of smallholder farmers in Fedis district, Eastern hararghe zone. Ethiopia, 5(March), 120–128. https://doi.org/10.5897/JDAE12.104
- Dev, T., Sultana, N., & Hossain, E. (2017). Analysis of the impact of income diversification strategies on food security status of rural households in Bangladesh: A case study of Rajshahi District. American Journal of Theoretical and Applied Business, 2(4), 46–56. https://doi.org/10.11648/j.ajtab.20160204.13
- Dimova, R., & Sen, K. (2010). Is household income diversification a means of survival or a means of accumulation? Panel data evidence from Tanzania (pp. 1–34). Brooks World Poverty Institute Working Paper 122.
- Dorward, A., Wobst, P., Lofgren, H., Tchale, H., & Morrison, J. (2003). Modeling pro-poor agricultural growth strategies in Malawi: Lessons for policy and analysis. Wye, Ashford, UK, Center for Development and Poverty Reduction. Department of Agricultural Sciences.
- Doss, C., Oduro, A. D., Deere, C. D., Swaminathan, H., Baah-Boateng, W., & Suchitra, J. Y. (2018). Assets and shocks: A gendered analysis of Ecuador, Ghana and Karnataka, India. Canadian Journal of Development Studies / Revue Canadienne D’études Du Développement, 39(1), 1–18. https://doi.org/10.1080/02255189.2017.1316244
- Dunn, E. (1997). Diversification in the household economic portfolio. http://www.microlinks.org/ev02.php?ID=7188 201 &ID2=DO TOPIC.
- Echebiri, R. N., & Onwusiribe, C. N. (2017). Effect of livelihood diversification on food security status of rural farm households in Abia State Nigeria. Scientific Papers Series Management, Economic Engineering in Agriculture and Rural Development, 17(1), 159–166.
- Education, I. O. (2010). Regression with stata Chapter 2: Regression diagnostics. https://stats.oarc.ucla.edu/stata/webbooks/reg/chapter2/stata-webbooksregressionwith-statachapter-2-regression-diagnostics/
- Elemineh, D. A., Edmealem, H., & Mulusew, M. (2020). Prevalence and associated factors of agricultural technology adoption and Teff productivity in Basso Liben District, East Gojjame Zone (pp. 1–21). https://www.biorxiv.org/content/10.1101/2020.10.28.358770v1.full
- Ellis, F., & Allison, E. (2004). Livelihood diversification and natural resource access. Food and Agriculture Organization of the United Nations, Livelihood Support Programme Working Paper 9, Overseas Development Quintile, University of East Anglia.
- Endalew, B., & Gashaw, T. (2016). Ethiopia: Review. Radix International Education and Research Consortium, 4(December 2015), 2250–3994.
- Ersado. (2003). Income diversification in Zimbabwe: Welfare implications from urban and rural areas (FCND Discussion Paper 152). International Food Policy Research Institute.
- Etea, B. G., Zhou, D., Abebe, K. A., & Sedebo, D. A. (2019). Household income diversification and food security: Evidence from rural and semi-urban areas in Ethiopia. Sustainability, 11(12), 3232. https://doi.org/10.3390/su11123232
- FAO. (2005). The state of food insecurity in the world. Food and Agriculture Organization of the United Nations.
- FDRE. (1996). Federal democratic republic of Ethiopia: Food security strategy document. FDRE.
- Gani, B. S., Olayemi, J. K., & Inoni, O. E. (2019). Livelihood diversification strategies and food Insecurity status of rural farming households in Northeastern Nigeria. Economics of Agriculture, 66(1), 281–295.
- Gebreyesus, B. (2016). Determinants of livelihood diversification: the case of Kembata Tambaro Zone, Southern Ethiopia. J Poverty Invest Dev, 23(0), 1–10.
- Gebru, G. W., Ichoku, H. E., & Phil-Eze, P. O. (2018). Determinants of livelihood diversification strategies in Eastern Tigray Region of Ethiopia. Agriculture & Food Security, 7(1), 1–9. https://doi.org/10.1186/s40066-018-0214-0
- Gemechu, F., Zemedu, L., & Yousuf, J. (2016). Determinants of farm household food security in Hawi Gudina district, West Hararghe zone, Oromia Regional National State. Ethiopia. Journal of Agricultural Extension and Rural Development, 8(2), 12–18.
- Greene, W. H. (2003). Econometric analysis (5th ed.). New York University.
- Greene, W. H. (2000). Models with discrete dependent variables. In Econometric analysis. New York University.
- Gujarati, D. (2004). Basic econometrics (4th ed.). McGraw-Hill Companies.
- Habtewold, T. M. (2019). Determinants of food security in the Oromiya Region of Ethiopia (Issue April 2018). Springer Singapore. https://doi.org/10.1007/978-981-10-8126-2
- Hamilton, H.,Henry, R.,Rounsevell, M.,Moran, D.,Cossar, F.,Allen, K.,Boden, L., &Alexander, P. (2020). Exploring global food system shocks, scenarios and outcomes. Futures, 123, 102601. https://doi.org/10.1016/j.futures.2020.102601
- Idowu, A. O., Awoyemi, T. T., Omonona, B. T., & Fausi, A. O. (2011). Non-farm income diversification and poverty among rural farm households in Southwest Nigeria. European Journal of Social Sciences, 21(1), 163–177.
- Kasie, T., Agrandio, A., & Garcia, I. (2017). Household resilience to food insecurity: Shock exposure, livelihood strategies, and risk response options: The case of Tach-Gayint District, Amhara Region, Ethiopia. University of Jaume I.
- Knight, E., House, L., Nelson, M. C., & Degner, R. (2005). An evaluation of consumer preferences regarding goat meat in the South. Food Distribution Research, 37(1), 88–96.
- Kothari, C. R. (2004). Research methodology, methods, and techniques (pp. 13–14). New Age International Publishers.
- Megan, G. (2010). Three essays on buyer power theory, dominant HMOs, and technology transfer. Unpublished Ph.D. Dissertation submitted to Department of Economics, Northeastern University. http://hdl.handle.net/2047/d20000287.
- Mekuriaw, T. (2019). Analysis of current and future water demand scenario in Yejube Town, Ethiopia. International Journal of Advanced Science and Engineering, 06(02), 1291–1304. https://doi.org/10.29294/IJASE.6.2.2019.1291-1304
- Minot, M., Epprecht, M., Anh, T., & Trung, L. (2006). Income diversification and poverty in the northern uplands of Vietnam. International Food Policy Research Institute.
- Mohamed, A. A. (2017). The food security situation in Ethiopia: A review study. International Journal of Health Economics and Policy, 2(3), 86–96.
- Motbainor, A., Worku, A., & Kumie, A. (2016). Level and determinants of food insecurity in East and West Gojjam zones of Amhara Region, Ethiopia: A community-based comparative cross-sectional study. BMC Public Health, 16, 503. https://doi.org/10.1186/s12889-016
- Obalola, T. O. (2020). Food security and income diversification nexus: USDA approach. Scientific Papers Series Management, Economic Engineering in Agriculture and Rural Development, 20(3), 13–24.
- Obayelu, A. E. (2012). Households’ food security status and its determinants in North-Central Nigeria. Food Economics, 9(4), 241–256. https://doi.org/10.1080/2164828X.2013.845559
- Ocho, F. L., Yadessa, G. B., Abdissa, F. M., & Bekele, A. E. (2017). Why does food insecurity persist in Ethiopia? Trends, challenges, and prospects of food security in Ethiopia. Journal of Development and Agricultural Economics, 9(12), 341–354.
- Oluwatayo, I. B. 2009. Poverty and income diversification among households in rural Nigeria: A gender analysis of livelihood patterns [Paper presentation]. Conference Paper No.41, IESE
- Onunka, C. N., & Olumba, C. C. (2017). An analysis of the effect of livelihood diversification on the food security status of the rural farming households in Udi L. G.A of Enugu state. International Journal of Agricultural Science Research, 7, 389–398.
- Perneger, T. V., Courvoisier, D. S., Hudelson, P. M., & Gayet-Ageron, A. (2015). Sample size for pre-tests of questionnaires. Quality of Life Research, 24(1), 147–151. https://doi.org/10.1007/s11136-014-0752-2
- Robaa, B., & Tolossa, D. (2016). Rural livelihood diversification and its effect on household food security. A case study at Damota Gale Woreda, Wolayta, Southern Ethiopia. Eastern Africa Social Science Research Review, 32(1), 93–118. https://doi.org/10.1353/eas.2016.0001
- Singh, K. (2007). Quantitative research methods. Sage Publications India Pvt. Ltd.
- Tefft, J., Jonasova, M., Adjao, R., & Morgan, A. (2017). Food systems for an urbanizing world. World Bank.
- Tegegne, E. (2015). Livelihoods and food security in the small urban centers of Ethiopia: The case of Durame, Wolenchiti, and Debresina Towns [Dissertation]. Department of Geography and Environmental Studies.
- Teshome, B. E., & Khalil, A. (2013). Determinants and patterns of income diversification among Smallholder Farmers in Akaki District, Ethiopia. Journal of Research in Economics and International Finance, 2(4), 68–78.
- Welderufael, M. (2015). Analysis of households vulnerability and food insecurity in Amhara Regional State of Ethiopia: Using value at risk analysis. Ethiopian Journal of Economics, 23, 37–78.
- Winters, P., Davis, B., Carletto, G., Covarrubias, K., Quiñones, E. J., Zezza, A., Azzarri, C., & Stamoulis, K. (2009). Assets, activities and rural income generation: Evidence from a multicountry analysis. World Development, 37(9), 1435–1452. https://doi.org/10.1016/j.worlddev.2009.01.010
- Yamane, T. (1967). Statistics: An introduction analysis (2nd ed.). Harper and Row.
- Yishak, G. (2017). Rural farm households’ income diversification: The case of Wolaita Zone, Southern Ethiopia. Social Sciences, 6(2), 45–56.
- Zegeye, T., & Hussien, H. (2011). Farm households’ food insecurity, determinants, and coping strategies: The case of Fadis District, Eastern Oromia, Ethiopia. Ethiopian Journal of Agricultural Economics, 8(1), 1–35.
- Zerai, B., & Gebreegziabher, Z. (2011). Effect of nonfarm income on household food security in eastern Tigrai, Ethiopia: An entitlement approach. Food Science and Quality Management, 1(10), 1–23.
- Zerihun, B. (2017). Non-farm diversification in Ethiopia: What determines participation and returns? Conference paper economic development in Africa. The Centre for African and Oriental Studies., Addis Ababa University.