
 ?Mathematical formulae have been encoded as MathML and are displayed in this HTML version using MathJax in order to improve their display. Uncheck the box to turn MathJax off. This feature requires Javascript. Click on a formula to zoom.
Abstract
Agroecological conditions are crucial for food production and the foundation for food security in Ethiopian subsistence farming. This study examines the food security status and determinants in Hamassa watershed agroecological zones (AEZs). The study collected primary and secondary data from 328 randomly selected household heads and used various analytical tools including the Food Balance Model, t-test, chi-square test, Foster–Greer–Thorbecke Index and binary logit model. The result showed that 54.27% of households were food insecure, with the midland having the highest food insecurity at 68%, followed by lowland and highland at about 57% and 40%, respectively. About 27.7% of households had energy deficiency, and 15.5% were classified as severely food insecure (severity level). Specifically, the midland agroecology showed the highest food insecurity depth and severity due to small land size and population pressure. Results showed that water availability, climate change perception, land size, development agent, sex, education, Tropical livestock units and oxen were positive and significant factors in food security. On the other hand, age, household size, income from crop sales, total land size and social capital negatively and significantly affected food security. The food insecurity status and severity are different for different agroecologies, requiring tailored technical, institutional and policy interventions.
Reviewing Editor:
1. Introduction
Food security is ensured when ‘all people, at all times, have physical, social and economic access to sufficient, safe and nutritious food which meets their dietary needs and food preferences for an active and healthy life’ (Clay, Citation2002). Thus, food insecurity takes place when food is not enough, sufficient and limited diet to satisfy hunger, which is closely related to poor socioeconomic conditions, limited household resources and low disposable income (Annapoorani & Lakshmi, Citation2017; Hameed & Salam, Citation2020). Due to these reasons, the increase in the global food insecure population number rose to between 720 and 811 million in 2020, which is a 9.9% increase, but it was 8.4% in 2019 (UNICEF Citation2021). Moreover, among one billion undernourished people globally, 98% of whom live in developing countries (DC), Sub-saharan Africa, including Ethiopia, takes the largest share of the risk (Al et al. Citation2008). Furthermore, deaths due to food insecurity surpassed deaths caused by war in the world, which accounts for 20,000 deaths each day (Falcon & Naylor, Citation2005; Kogan et al., Citation2019). Therefore, there should be no discussion of development issues while people’s lives are being threatened by food insecurity. Instead, we should focus on addressing the urgent need for food security, which is a critical component of development (Pérez-Escamilla, Citation2017). This includes dimensions of life and livelihood, such as health, education and economy.
Food security is an issue of development at any level. Malthus claimed that the population outstrips the food supply, which could devastate human life unless checked and controlled (Russell & Russell, Citation2000). Though this view was criticized, the necessity of its theme is well noted by his opponents that sufficient food supply in the development process has been substantiated by expressing technology as an option to increase food supply (Galor & Weil, Citation2000). Moreover, food security is also a political issue; the first world leader to sit on the issue in 1974 substantiated it by the increased number of hungry people in the world at a time when it was sensed to be a source of political insecurity (Jones et al., Citation2013; Tolossa, Citation2005). Thus, it can be contested that food is not only nutrition, but it can be an issue of politics, education, economy, health and infrastructure – in its intertwined relations, and food insecurity solutions cannot be a single one but an integrated approach (Rasul & Sharma, Citation2016). This approach would be of special benefit to sub-Saharan African countries, which lag in development, for its’ devastating food insecurity (Kogan et al., Citation2019). Ethiopia is among them, seeking it as a mechanism of way out from food insecurity trap. (Kogan et al., Citation2019).
Ethiopia’s food insecurity is connected to small-scale subsistence farming with largely rain-fed and traditional practices, which makes the country vulnerable to climate change and variability since its livelihood has high sensitivity and low resilience (Esayas et al., Citation2019; Yesuph et al., Citation2023). Drought, the Belg rain drying pattern, and flooding in recent times in Ethiopia are frequent (Esayas et al., Citation2019); for example, in 2006, more than 10,200 people were affected, with 256 deaths (Zeray & Demie, Citation2016). Moreover, rain patterns changed in intensity, location, commencement and termination. Furthermore, high water scarcity with low water storage and increased deforestation decrease production by escalating food insecurity in the country (Chartres & Andrew, Citation2015). The climate impact on food security is multidimensional (El-Bilali et al., Citation2020), coupled with land degradation due to high population pressure (Bojago, Citation2021), causing land fragmentation to exacerbate food insecurity (Amenu & Mamo, Citation2021; El-Bilali et al., Citation2020; Giller et al., Citation2021).
In connection with these, studies recommend the spatial variations of food security/insecurity analysis to identify the most vulnerable areas/places so as to prioritize limited resources to alleviate the problem (Alemu et al., Citation2017; Cai et al., Citation2020). The food insecurity spatial pattern across geographical locations is investigated by the study (Atoloye et al., Citation2015; Muleta, Citation2022). Among various factors of spatial variation of production, in turn, food security/insecurity, agroecology characteristics are crucial for types and amount differences of crops produced for those countries which rely on rain-fed subsistence farming, on which their food consumption solely depends (Adane et al., Citation2015). Agroecology is the well-functioning ecosystem processes and services by improving agroecosystems through harnessing natural processes, creating beneficial biological interactions and synergies among their components, which reduce dependencies on external inputs, emphasizing complex agricultural systems to sponsor their own soil fertility, productivity and crop protection (Gallardo-López et al., Citation2018). Therefore, it is clear that agroecology as a practice in agriculture is the solution to low-economy countries relaying on rain fed agriculture like Ethiopia by reducing the cost of production while increasing the productivity of crops and alleviating food insecurity (Alemu et al., Citation2017).
The food insecurity concerned studies in Ethiopia, including the study area context, analyzed the demographic, socioeconomic and institutional factors widely (Zeray & Dawit, Citation2017; Leza & Kuma, Citation2015; Gazuma & Astatike, Citation2019; Balta, Citation2016; Abo & Kuma, Citation2015; Woldemichael, Citation2019). Nevertheless, agroecology-based analysis as a factor is to the level of nonexistence. However, it is a crucial factor in the food production processes and is the foundation for food security of subsistence smallholder farming in Ethiopia (Alemu et al., Citation2017; Kerr et al., Citation2021; Madsen et al., Citation2021). Agroecological variations are considered in this paper for food security analysis to address the gap in existing empirical studies. A recent study claims that the vitality of context-specific food insecurity analysis is recommended to accurately address the problem and also foster successful investment and management (Beyene, Citation2015; Alemu et al., Citation2017). Thus, this study aimed to detect spatial variations of food insecurity among agroecological zones (AEZs) of the Hamassa watershed, Ethiopia. The pattern of food security analysis in AEZs from this study will contribute to policymakers and local administrators designing effective interventions and making informed decisions in improving the food insecurity situation of the country at large and in specific localities.
2. Materials and methods
2.1. The study area description
2.1.1. Location and physical characteristics
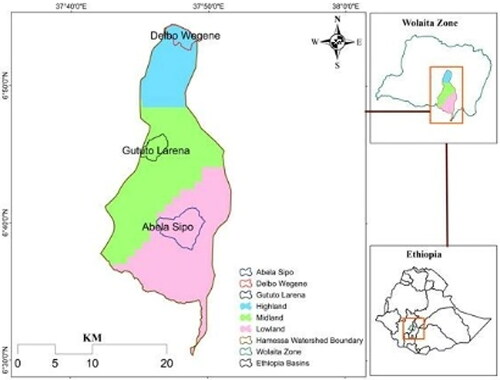
This study was conducted in the Hamassa watershed, which lies within 6° 31′13″ to 6° 54′28″ N of Latitude and 37° 42′01″ to 37° 53′23″E of longitude. The watershed is located in the Wolaitta Zone, starting from central Wolaitta to the southeast, and shares areas from districts of Sodo Zuriya, Humbo, Abala Abaya, Hobicha (a small section is included), and some part of Sodo town administration (see ). It is 330 km from Addis Ababa, the capital city of Ethiopia. The watershed’s elevation ranges from 2850 m average mean sea level (used as mamsl; hereafter) on top of Damota mountain to 1000 mamsl around Lake Abaya. The upper stream parts of the watershed are characterized by mountain and dissected terrain with steep slopes, and the lower stream part that includes the midland and lowland agroecology has gentle slopes with decreasing elevation trend till Abaya Lake. The higher altitude in the watershed is to the northern part, and the elevation continuously decreases to the south-eastern part till the south tip of the watershed. Based on traditional classification, it can be grouped into three AEZ: highland, midland and lowland (Hurni, Citation1998). The midland and lowland agroecology are dominant in the watershed. The watershed total area is 375.75 km2. The area shares in sq. km of highland, midland, and lowland agroecology are 61.97, 158.60 and 155.17. Soil types in the study area are Fluvisols, Leptosols, Luvisols, Nitisols and Verisols. The wider area of the watershed is covered with vertisols, which have 325.62 km2 of the total 375.75 km2.
Figure 1. Location map of the study area (CSA, 2007).
2.1.2. Farming activities
The farming system of the Hamassa watershed is a subsistence-level rain-fed mixed crop-livestock production system. The Hamassa watershed’s two crop-growing rainy seasons mirror Wolaita’s microsplit characteristics. ‘Kiremt’ is the major rain season, which is equally important in crop production, but crops are less produced than in the ‘Belg’ season due to its cold temperature and intensive rain. The ‘kiremt’ rain includes June, July, and August, whereas February to May is the ‘Belg’ rain season, a major production season, but rain is less than ‘kiremt’. The mean annual rainfall varies from 801 mm at Bilate tena to 1400 mm at Wolaitta Sodo. The long-term annual average rainfall and maximum and minimum temperature are 1276 mm, 26 °C, and 14 °C, respectively. There is no significant temperature variation across the Zone, but the rainfall variability is very high, and its amount is continuously decreasing to the east till the Bilate area; contrary to this, the amount of rainfall is high around Damota mountain due to the Orographic effect (Brandt et al., Citation2012; Yesuph et al., Citation2023). The precipitation pattern in the studied area is fully influenced by the equatorial climate systems of the Indian and Atlantic oceans (Brandt et al., Citation2012).
2.1.3. Population pressure
Brandt et al. (Citation2012) explained that population pressure, intense farming + and high erosion seriously affect the area, especially the upper part of the mountain. Due to this pressure, natural vegetation, wild bovids, carnivores and other huge creatures can only be seen in or close to ravines, rocky outcrops, steep slopes and other locations that are too difficult to settle, plow or hoe. The population of Wolaita is estimated to be 2,353,427, and the crude population density of the Zone is 450 per square km. The most densely populated woredas are Damot Pulasa (722/ km2)(Dana et al., Citation2020) and Humbo (194/km2)(Regasa, Citation2015). According to the 2006 and 2007 estimation, Wolaitta Zone population density is 450 and 464, respectively (Dana et al., Citation2020).
2.2. Ethical approval statement
The study was granted ethical clearance by the College of Development Studies Institutional Review Board (CoDS-IRB) at Addis Ababa University, and was found to meet the necessary standards, thereby qualifying for Ethical Clearance with No. 035/01/2023. The ethical clearances and standards of the CoDS-IRB mandate that informed consent be obtained from participants, and permit researchers to implement appropriate informed consent procedures, including oral, verbal or written. Thus, with the IRB’s approval, oral consent was obtained from the participants for this study. The oral consent of the participants was obtained through the use of an audio recording device, specifically the ZTE Blade A71 mobile device (model-ZTE A7030 with Serial number 320225317551). The decision to forego ethical clearance was deemed irrelevant, as adherence to ethical standards and considerations, especially in the context of publication processes, is crucial. Prior to data collection, the study objectives were clearly communicated to the respondents, ensuring that their identities would remain confidential in all documentation. Oral consent was obtained from those who volunteered and trusted the project’s ethical declaration following the IRB’s consent, which through informed consent suggested oral consent that I have taken audio record, as mentioned in the preceding sentences. Oral consent was sought due to some respondents’ inability to read and write, as well as to address time constraints in reaching all respondents.
2.3. Sampling procedure and data sources
A multi-stage sampling procedure has been applied in the selection of representative samples. The watershed understudy has been chosen using purposive sampling, and the three sample kebeles were randomly selected from three AEZs within the watershed (each Kebele representing the three different agroecology). Finally, the representative sample households were randomly selected proportionately to total household heads and the gender of household heads. The sample size was determined using the (Cochran, Citation1977) formula to calculate a representative sample for proportions as:
where n。 = the sample size; z = the selected critical value of desired confidence level; p = the estimated proportion of an attribute that is present in the population; q = 1− p and e = the desired level of precision.
Based on (Cochran, Citation1977) sample size determination techniques, 328 sample households were selected for the study.
2.4. Data collection
Quantitative and qualitative data were collected from primary and secondary sources to support the research project, respectively. The quantitative data (primary data) for this research was mainly generated from the structured household survey, and the qualitative data were collected from key informants’ interviews (KII, hereafter), Focus Group Discussions (FGD, hereafter) and observation. The qualitative data as secondary sources were gathered from different literature and reports from government offices.
2.5. Tools and techniques of data analysis
There were four parts to the model selection process used in this study. To begin with, choosing a suitable household food balance model (HHFBM) for classifying food secure and food insecure households was done. In addition, chi-square and t-tests were involved to see the existing relationship and mean differences between food-secure and food-insecure households, respectively. Furthermore, the binary logistic model was chosen to identify the factors influencing food security status in the study area. The Foster_greer-Torbeck model was also selected to know the depth, incidence and severity of food insecurity in the study area across AEZs. STATA version 13 and Microsoft Excel were used to examine all quantitative data.
2.5.1. Household food balance model (HHFBM)
The net food available (NFA) for the households was computed using a mathematical equation known as HFBM (Mulugeta, Citation2010). To calculate NFA, three steps were used. First, HFBM determines NFA for each household; it is the difference between the gross available food and food disposed of for various reasons. Second, the NFA was converted to total kilocalories for each household and then to adult equivalent (ADE) based on conversion factors provided by Ethiopian Health and Nutrition Research Institute food composition table (EHNRI) FDRE 1996 document (as cited in Adane et al., Citation2015: 362). Third, the kilocalories per kilogram calculated in step two compared with the minimum per day per ADE subsistence calories required by an adult to live a healthy and active life in Ethiopia. According to Federal Democratic Republic of Ethiopia (FDRE) 1996 document 2100 kcal set as the minimum subsistence kcal requirement for an active and healthy life. This threshold is used as a cut-point between food security and food insecurity by the Ethiopian government. The HFBM model equation that was used in this study is:
1
1
where
NFA = net food available (quintal/household/year) during the year
GP = Total grain production (quintal/household/year) during the year
GB = Total grain bought (quintal/household/year) during the year
FA = Quantity of food aid obtained (quintal/household/year) during the year
GG = Total grain obtained through gift or remittance (quintal/household/year)
HL = Post-harvest losses due to grain pests, disasters, thievery (quintal/household/year)
GS1 = Quantity of grain reserved for seed (quintal/household/year) during the year
GS2 = Amount of grain sold (quintal/household/year) during the year
GO = Grain given to others within a year (quintal/household/year) during the year
GS3 = Given to Social events within a year (quintal/household/year) during the year.
2.5.2. Binary logit model estimation
Food secure or insecure is a binary categorical response variable (dependent variable), defined in this study as 1 when a household is food secure, otherwise 0. The logistic regression is chosen for this study among many different options of models for categorical dependent variable analysis. It has also been applied by scholars such as Guyu and Muluneh (Citation2016) and Amare Simane (Citation2017). It was chosen for the reason that it can be used if the predictors are mixed, and more importantly, it does not make any assumption for the distribution of predictors(normally distributed variables not mandatory, rather it works with either of two), while other models like discriminant analysis and probit competing for categorical dependent variable require an assumption of distribution (Sodjinou et al., Citation2015). The estimable form of the cumulative logistic probability model is specified as follows based on Gujarati 1995(cited in Amare & Simane, Citation2017: 289):
(1)
(1)
where Li = logit means log of the odds ratio, which is not only linear in Xi but also linear in the parameters. It shows how to log odd in favor of food security change as the independent variable change by a unit Xi = the individual i = 1, 2,…., 22; are independent variables Pi = the probability household being food secure and (1-Pi) = the probability of a household being food insecure: αo = intercept or constant term, that implies the collective impact of independent factors on household food security status and εi = error term.
In the process of maximum likelihood parameter estimation, the problem of multicollinearity, the variance inflation factor (VIF) and the contingency coefficient for continuous and dummy variables were made, respectively. The VIF exceeding the value of 10 was not found (no multicollinearity problem). The contingency coefficient value above 0.25 was found and discarded from the analysis parameter estimation for their strong relationship among independent variables. It is always required to check for contingency coefficient with the expectation of a strong relationship among independent variables may produce blurred result (Ranganathan et al., Citation2017), which masks the true picture of estimation on dependent variables.
The t-test and chi2 test examined the mean significance differences and relationships between food-secure and food-insecure households, respectively. Moreover, the descriptive statistics frequency, minimum, maximum, mean and standard deviation were computed to observe the variations between food-secure and food-insecure households.
2.5.3. Foster–Greer–Thorbecke (FGT) index
This study used the Foster–Greer–Thorbecke (FGT) index (Foster et al., Citation1984) to compute the depth, incidence, and severity of food insecurity. The FGT measure is given as:
(2)
(2)
where
n is the number of sample households;
Yi is the measure of per adult equivalent calorie intake of food in the ith household;
z is 2100 kcal, which is cut off point between food secure (FS) and food insecure (FIS) households;
q is the number of food insecure households for food to measure food deficit; otherwise, it is the number of food secure households to estimate surplus.
In the FGT index, yi ≥ z that the specified household is food secure; otherwise, the household is food insecure. In the formula above, n denotes the number of food insecure households for the food shortfall (food gap) index, and it can also denote the number of food secure households for the food surplus index. It is indicated with the support of formula having the value of α equal to 1 hereunder to compute the incidence of food insecurity indicating the distance of households from required adult equivalent energy that it takes the assumption having an equal weight of food insecurity of all food insecure households:-
(3)
(3)
Below herewith is a description of the severity of food insecurity α having the value of 2:-
The above computation steps were also done for surplus calories that enable inter-AEZs comparisons and among the food secure and food insecure groups within the same agroecology to have deep insight into it.
2.5.4. Variables definition and working hypothesis
Next to the analytical methods setting, defining the potential predictor variables is important (see ). As a result, experts and authors’ knowledge of the local food security situation in identifying potential factors affecting food security, along with a literature review of economic theory and past research findings. Based on a critical literature review, the following potential factors to food security are hypothesized.
Table 1. Definitions, types and expected signs of variables.
Age of the household head: The age of the head of the family is a continuous variable measured in years. Age was found to have a considerable impact on household food security in a previous study (Mekonnen et al., Citation2021). In other words, a household becomes more risk-averse and has more experience predicting farming weather as he ages. As a result, there is a good possibility that this household will have enough food. Consequently, it is hypothesized that a household head positively impacts food security.
Sex of the household head: It is a dummy variable that has a value of 1 for men and 0 for women. A household head is a person, man or woman, who oversees or provides financial assistance. According to the reviewed literature, households led by women are more likely to experience food insecurity (Mengistu & Kassie, Citation2022; Hana & Dereje, Citation2016). Accordingly, it was anticipated that there is a positive relationship between the sex of the male household head and food security, and the same hypothesis was given in this article.
Education of household head: It is harnessed as a categorical variable in this study. According to a significant body of research, household heads with higher levels of education are thought to have a better chance of diversifying their household’s sources of income, adopting better production techniques of agriculture, accepting technical advice from extension workers, and managing their farm better than those who lack these skills (Hana & Dereje, Citation2016; Mengistu & Kassie, Citation2022). The higher education level of households is expected to relate positively to food security.
Household family size: It is expressed in the number of households who live and eat under the same roof for at least six months in the study year. Along with limited agricultural inputs, the substance economy/ rain-fed agriculture with large family size suffers from a shortage of food, which is less contributed from household labor (Hana & Dereje, Citation2016). Thus, it is hypothesized that household size can negatively affect food security.
Dependency ratio: When smallholder subsistence farming households accommodate more dependent people, it is clear that the likelihood of households being food insecure is increasing, which has been substantiated by scholars such as (Ayele, Citation2020; Hana & Dereje, 2016; Mengistu & Kassie, Citation2022; Toma et al., Citation2023; Mekonnen et al., Citation2021). Aged < 64 and age >15 are categorized as dependent, and ages between 15 and 64 are independent economically (Harasty & Ostermeier, Citation2020). Therefore, the dependency ratio is hypothesized to affect households’ food security negatively.
Cultivated land size/total land owned refers to the total land or only cultivated owned by household heads measured in hectares. Compared to small-sized land, households with large-sized land are more likely to have food security by having more production; of course, the amount of production is determined by basic capital inputs for food production (Gunes & Guldal, Citation2019). It is hypothesized that farmers with large land sizes are likely to be more food secure than small.
Livestock holding: It is measured in TLU, a source of milk and milk products for diet. In addition, during drought/crop failure, the food shortage of households is managed by selling livestock to purchase grain (Mebrie & Ashagrie, Citation2023; Melese et al., Citation2021). Livestock ownership is hypothesized to be positively connected to households’ food security.
Ox: It is a continuous variable with a numerical value, and in most developing nations, Ox remains the main agricultural draft power. Ox is mainly for draft power rather than a source of diet and income for food unless obliged for some cases like debt, and it is for this reason that Ox is discarded from the livestock section in the analysis and the same research output presented in this regard (Mebrie & Ashagrie, Citation2023). The availability of Ox at the household (HH) level contributes significantly to the direct or indirect success of agricultural activities and food security (Mebrie & Ashagrie, Citation2023; Melese et al., Citation2021). Therefore, the HH’s access to more Ox enhances the likelihood that the HH will have enough food. HHs’ food security condition is anticipated to be positively impacted by the number of Ox owned.
Access to credit: It takes the form of a dichotomous variable with a value of 1 for those with credit access and otherwise 0. Access to credit promotes production and productivity through investing in farming and nonfarm income-generating activities (Amare & Simane, Citation2017). As a result, food security and access to credit are expected to have a positive relationship.
Access to extension service: This is a dummy variable and is a typical monthly visit by extension agents to a residence. Farm households are more likely to adopt new technology and increase their output when they use the advice services provided by extension agents (Amare & Simane, Citation2017). The extension services are expected to increase household awareness of the benefit of using new agricultural technology and improved varieties and have a favorable impact on food security. Hence, contact with the extension agents is predicted to impact food security frequently.
Off-farm/nonfarm income: This variable is continuous in this study. The majority of farmers often rely on their farms for income. To buy clothing, inputs, food, and products connected to food, they occasionally look outside the farm for off- or nonfarm incomes (Astatike & Gazuma, Citation2019). Numerous studies have shown that the performance of families and their members in managing food insecurity – strategies that may be used to diversify their sources of income – depends on their access to offarm/nonfarm activities (Fekede et al., Citation2016). On the other side, nonfarm activities may reduce investments in conservation and divert labor from agriculture, both of which pose risks to food availability. Thus, it is hypothesized that off-farm/nonfarm income might negatively or positively affect households’ food security.
Livestock income: It is a continuous variable in the study, and annual income from this source, as would be true from any other sources, can have a positive contribution to the household food security status of smallholding subsistence farming. Their relationship has been confirmed by studies (Melese et al., Citation2021; Mengistu & Kassie, Citation2022), and a positive relation is hypothesized for the food security of smallholder farming.
Crop income: This is a continuous variable, and the increased crop production and productivity have positive implications for the food security of smallholder subsistence farming (Ogunniyi et al., Citation2018). Therefore, income from crop sales is hypothesized to be positive for food security in this study.
Soil and water conservation practices: A dummy variable taking a value of 1 if a household engages in soil and water conservation activities and a value of 0 otherwise. Inadequate soil management, crucial for agriculture and greatly impacts food security, is a barrier to food production in Ethiopia; erosion and soil degradation are problems (Tofu & Wolka, Citation2023; Hurni et al., Citation2010). By preserving soil fertility, any soil conservation techniques will lessen the problem of land degradation. On the other hand, this will increase agricultural productivity (Madara, Citation2012). Soil conservation methods increase the likelihood that a household will have access to food.
Drought Occurrence: It represents the frequent occurrence of drought in the studied area over the last 25 years. The experience demonstrates the link between pronounced weather unpredictability and food insecurity. The drought badly impacts the country’s food security (Esayas et al., Citation2019). Drought has a major impact on the country’s annual per capita food supply, according to experience. Therefore, it is believed that the drought frequency in the region has a detrimental impact on food security.
Social capital: Membership in social groups (‘Edir and Equb’ in this study as a dummy variable) served as a stand-in for social capital. Food security is maintained at the individual and household levels by social capital and neighborhood institutions operating at the community level (Niles et al., Citation2021). Evidence was also sought to support the idea that social capital helps people achieve food security (Dzanja et al., Citation2015). Social capital is thought to be positively correlated with household food security.
Distance to market: It is measured by kilometers from home to the market center. The closer the market is, the better opportunity for the households in non/off-farm employment and easy access to sell goods produced, especially perishable goods or products (Fekede et al., Citation2016). Families sometimes discount perishable commodities because of the effect of the distant market, which is seen to harm food security.
Distance to water: Pure, usable water (Linderhof et al., Citation2021) and its nearer distance to the water point (Jambo et al., Citation2021) would become an opportunity for food security. The presence of usable water at short distances positively contributes to food security, be it in the case of small-scale irrigation to enhance production or for home consumption, including personal hygiene. Thus, an increase in the distance of the water point is hypothesized to influence households’ food security negatively.
Migration: This is a dummy variable in this study, and it documented that migration can negatively affect agricultural production and food security by loosening social cohesion and losing labor effect on farming (Abebe, Citation2021). On the other hand, migration has been seen as an advantage in coping with food insecurity problems in rural households (Craven & Gartaula, Citation2015). Thus, migration in smallholder subsistence farming could be positive or negative.
Agroecology variation: is a discrete variable whose variation results in variation in crop production and, in turn, food security in smallholder farming (where midland agroecology is better off than lowland) in another part of the country (Amare & Simane, Citation2017). In contrast, the food security situation of highlanders in some parts of Ethiopia experiences severe food insecurity due to land fragmentation (Giller et al., Citation2021). Thus, the hypothesis of this study on the food security situation across AEZs would be positive or negative as indicated in .
3. Results
3.1. Status of households’ food insecurity
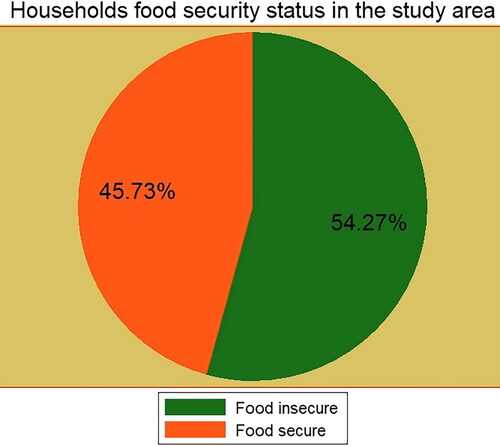
Based on the methods presented earlier, from the total households in the study area, 54.27% and 45.73% are food insecure and food secure, respectively (). The food-insecure households failed to fulfill the minimum recommended daily calorie (2100 kcal/AE/day).
Figure 2. Food secure and food insecure households.
The chi-square test in indicates the difference between food-secure and food-insecure households using the table’s dummy variables. There is a significant difference across AEZs in food security status within the watershed. Many food secure households are male-headed, have higher educational attainment, and are migrants to food shortage. Among the dummy variables, development agent visits, water availability, soil and water conservation, and climate change (drought) are highly used by food-secure households.
Table 2. Relation between discrete variables and food security analysis using chi2 test.
According to the t-test analysis in , the continuous variables like household size, income from cow, Ox holding, TLU, total land size, cultivated land size and age have significant mean differences between food secure and food insecure households. This implies that food-insecure households face a shortage of natural and financial assets, which exposes them to well-being insecurity.
Table 3. Relation between determinants of a continuous variable and household food security.
presents the summary of food insecurity at different levels of severity. The food insecurity incidence occurs at 40%, 68.05% and 57.3% in the study area’s highland, midland and lowland agroecology, respectively, which explains the percentage of households that could not meet recommended adult equivalent energy per day.
Table 4. The households’ food insecurity headcount ration incidence, depth and severity category by AEZs in percent.
The food insecurity gap was estimated to see how far the households experiencing food insecurity go below the recommended daily calorie intake. With the right targeting, the food insecurity gap offers the chance to estimate the resources needed to end food insecurity. Thus, the computed figure for the food insecurity gap was 17.7%, 35.4% and 29.4% in highland, midland and lowland agroecology, respectively. These results indicate that food insecurity might be eradicated if it were able to mobilize resources that could satisfy the percentage mentioned above of the caloric needs of every household experiencing food insecurity and distributes them to each household to bring them up to the recommended daily calorie requirement level.
Again, to focus on the sample households with the greatest levels of food insecurity, the severity of food insecurity was determined using a higher weight, α = 2. According to the analysis, the households’ severity of food insecurity in highland, midland and lowland agroecology was 9.8%, 20.5% and 16.2%, respectively. As can be assured from the results, midland agroecology is severely facing food insecurity, followed by lowland agroecology. In comparison, highland agroecology is better off than the lowland and midland, which does not mean that highland agroecology attained food security. Unless it is for comparison, 40% of the food insecure population ignites frustration, showing to what extent the area is affected by food insecurity problems.
and show the descriptive differences among AEZs and food security status. The average ADE kcal of midland agroecology of food secure and food insecure households is lower than in the highland and lowland.
Table 5. Descriptive statistics of food secure and food insecure ADE kcal by AEZs.
Table 6. Food secure and food insecure households’ total available and disposed crop (kg) comparison by AEZs.
As indicated in , both disposed and available crops in kilograms found to be the same that midland agroecology is lower than the two.
3.2. Factors determining food security status in the study areas
The 22 determinant factors were considered in the logistic model analysis to identify factors significantly influencing food security status in the study area in . Among them, 13 variables, including TLU, Ox, sex, milk-yielding cow, development agent advice, water availability and climate change (drought), household size, crop income, total land size, agroecology and education, were found to be significantly determining food security status of the study households.
Table 7. Logistic regression model parameter estimation of determinants of household food security.
Agroecology: In the analysis, agroecological variation significantly influences factors of food security in the study area. On average, food security status in midland agroecology is rated to be more severe than the highland and lowland agroecology, whereas the midland and lowland are closer in food security status than the highland agroecology. The midland food insecurity situation is worse, only for comparison, unless and otherwise, the whole study area under food insecurity treats. For example, the household’s food insecurity in the highlands is 40% (), which is better off in the analysis but in the food security, meaning the 40% food insecure households in specific areas can cause more than enough pain. According to the odds ratio in favor of food security, changing from Highland to Midland agroecology decreases the household’s likelihood of food insecurity by 0.426.
Age: It is a continuous variable measured in the number of years, which is a unit increase in age decrease the food security probability by an odds ratio of 0.9 with p value of 0.043. The study found the same result (Sani & Kemaw, Citation2019). This might be young people has ample energy to carry out the agriculture practice, even out of field having supporting non-agriculture activities beside.
Household size: the odds ratio in favor of food security presenting the one unit/one person increase in the household lowers the probability of being food secure by 0.534, which negatively and significantly affects the p value (p = 0.541). The decreasing food security probability of household size increase by one unit ADE probably is the less productive small-sized land (Rahmato, Citation2007) that escalates food demand exceeding food supplies. This finding is similar to other empirical findings (Amare & Simane, Citation2017).
Income from crop production: it was hypothesized that income from crop sales positively and significantly impacted food security. However, the result revealed contrastingly, keeping other factors constant, that one birr increase in crop income decreases the probability of food security by an odds ratio of 0.999.
Ox and TLU: Ox and milk-yielding cows were given separate special attention in the livestock group of smallholder farming that their availability plays a crucial role in households’ food security than any other home or domesticated animals. Moreover, the quantitative analysis from the household survey confirmed that one unit increase in Ox and TLU increases the probability of household food security by an odds ratio of 3.2 and 7.1 with a probability of 0.008 and 0.000, respectively.
Total land size or cultivated land size: These land associate variables were taken as different variables separately because of the area knowledge that uncultivated lands like homesteads, grazing lands, cliffs, rocky outcrops, steep slopes, and land covered with trees and shrubs present that unlikely contribute to food security. As had been suspected, total land size is less likely to contribute to households being food secure by an odds ratio of 0.68 with 0.025 p-values, whereas a unit increase in cultivated land size contributes to households’ food security by an odds ratio of 1.47 with-value0.072. The positive cultivated land size contribution to food security was also found by study (Guyu & Muluneh, Citation2016). This is because the larger the cultivated land size, the more farm product positively contributes to food security. The negative total land size (including cultivated and non-cultivated) adverse influence on households’ food security may be an unproductive and uncultivated land seizure.
Education: Changing from degree level to all other education ladders in this study diploma and secondary education level negatively and insignificantly contributing to food security except primary and read and write education level, which is significant. The change from the primary school category to the read and write category decreases food security probability by an odds ratio of 0.08 with a p-value of 0.048.
Sex of household head: Male-headed households are more likely to be food secure than female-headed ones by 24.6 times with a significance level of p-value 0.01. The same research output from studies (Mengistu & Kassie, Citation2022) confirms that male-headed households increase the probability of being food secure more than females. This might be associated with lower education levels, another home to levels that hold back from holding back in economic regard.
Social capital (mainly Edir in the study area, which is working in human death and funeral): This variable negatively influences food security by 0.107 times with a p-value of 0.015 than the households not taking part in social institutions.
DA advice, water availability, and climate change: households with ‘yes’ replay to DA advice, water access, and climate perception increase their likelihood of being food secure by 8.5, 6.1 and 26.7 times with the p-value of 0.001, 0.014 and 0.000, respectively. The same result was found in the study of positive development agent advice, water access (Amare & Simane, Citation2017), and climate change perception, increasing food security probability (Esayas et al., Citation2019). This might be the DA’s advice to create awareness for using new technologies and climate perception of household head support to critically think crop calendar and other appropriate preparedness and the short distance water availability contribute to food security by increasing production through irrigation, home gardening, and home consumption.
4. Discussion
This study assessed spatial variation of food security/insecurity within AEZs of the Hamassa watershed. Overall, 54.27%, which is a high proportion, of households in the study area were found food insecure. This result is higher than the study finding from Wolaita (49.6%) (Debebe & Zekarias, Citation2020) and lower than the 62% finding from Damot Gale (Mota et al. Citation2019). This varied pattern of food insecurity result might be the result that food security is the function of various explanatory variables, including variation in agroecology (Muleta, Citation2022). Though proportions vary from area to area, all together, it implies that food security intervention is required in every place, even in areas of enough production; for example, people suffer from micronutrient deficiency due to inappropriate habits of consumption (Omari et al., Citation2017).
Another important finding is looking at AEZs’s pattern of 40%, 68.05% and 57.3% food insecurity incidence occurred in highland, midland and lowland, respectively. According to the analysis, the households’ severity level and depth of food insecurity in highland, midland, and lowland agroecology were 9.8%, 20.5%, 16.2% and 17.7%, 35.4% and 29.4%, respectively. In all three cases the food security situation is worse in the midland agroecology. In such a situation, the result from both descriptive and logit regression assured the same conclusion that midland agroecology suffers from food insecurity in comparison to other AEZs. The high population pressure might explain the disproportionate food insecurity in the midland caused land fragmentation (Abebe and Shanko), which reduced farm production and escalated food insecurity; study findings substantiate this claim (Phan et al. Citation2022). Unless the midland food security status is standing opposite to the study by Amare, the food security status similarity is going in the same direction study (Amare & Simane, Citation2017). The research findings assured that some parts of Ethiopian highlands experience worse food security due to land fragmentation, which supports the findings of this research that the midland food security is more severe than the lowland (Giller et al., Citation2021). The better food security in the highlands might be the Wolaita zone administration and World Vision are highly working on soil and water conservation practices and the carbon trading project funded by Australia about 10 years back (Abo and Tegegn Hailu, Citation2017; Solomon et al., Citation2022) on the ragged topography of highland in the study area (all in all mountain covered) than midlands, which is flat land, cause for high population pressure and the resultant land fragmentation and food insecurity. Therefore, the data imply that there is an urgent appeal for soil and water conservation (as started in the highland) and family planning practices in the midland and lowland area, having special attention to the midland.
The result from the t-test indicated a significant mean difference among food secure and food insecure HHs regarding the continuous variables age, HH size, Ox, TLU, and income from crop. Thus, the government and the individuals’ patronage of people experiencing poverty, who face natural and financial asset in the study area could not be left to choose. Moreover, these variables are significant in the logit regression that indicated the one unit increase in Ox, and TLU increases the probability of household food security by an odds ratio of 3.2 and 7.1 with a probability of 0.008 and 0.000, respectively. Ox and milk-yielding cows were given separate special attention in the livestock group of smallholder farming that their availability plays a crucial role in households’ food security than any other in the study area, which was supported by KII and FGD participants. Midland agroecology informant stated that a man should only marry or have children if he owns at least one milk-yielding cow and one Ox, in addition to available land. The empirical findings from different areas have the same conclusion of Ox (Mebrie & Ashagrie, Citation2023; Melese et al., Citation2021) and TLU (Abdulla, Citation2015; Fekede et al., Citation2016). On contrary, a unit increase in age, HH size, and income from crops decrease food security by 0.9, 0.534 and 0.9 with a probability of 0.043, 0.000 and 0.000, respectively. The case of crop income is connected to the study area to low production from an unproductive small size of land (Rahmato, Citation2007), which was sold unwillingly for non-food purchase and debt (Eldridge et al., Citation2022), which FGDs substantiated that households in the study area sell food crops for debt and other mandatory non-food items still food is not enough for home consumption, to compensate this gap they borrow money from individuals and public to cover or pay it in the coming year which put a household in a vicious circle of poverty and food insecurity. It is might be for this reason that crop income found to be against the hypothesis. Age is negatively and significantly related to food security, implying that the younger age has more energy for both agriculture and non-agriculture activities to ensure food security, which is in line with the study (Sani & Kemaw, Citation2019).
Among the dummy variables, the DA consultation, water availability and climate change perception, HHs with ‘yes’ responses increase the probability of food security by an odds ratio of 8.5, 6.4 and 26.7 with 0.000, 0.014 and 0.000 probability, respectively. Education is also positively contributing to food security; change from the primary school category to the read and write category decreases food security probability by an odds ratio of 0.08 with a p value of 0.048. Another empirical finding supporting this finding (Amare & Simane, Citation2017). This might be that education helps to increase soil and water conservation practice, climate perception and applying DA consultation into practice. The social capital is negatively contributing to food security by adding a ratio of 0.0107 with a p value of 0.017, which contrasts the given hypothesis and findings from other studies that the positive and significant contribution of social capital to food security (Nosratabadi et al., Citation2020; Dzanja et al., Citation2015; Kehinde et al., Citation2021). The findings difference might be mainly in the study area of this research, institutions for emergency social cases are mandatory, and households are obligated to members than other types that its membership is willing, which was indicated in the FGD of the study area, especially the midland agroecology area. This might be in the current research area; the dead man’s funeral day lasted at least 3 d, and households, especially in the same social institution, were not allowed to farm or market. The membership of social institutions in other research areas might be related to economic nature and other supporting methods.
The main implication of this study is that the food security situation is unpredictable by good conditions of rainfall, soil and other conducive factors unless examined specifically in specific localities, for example, midland agroecology, which is thought to be conducive in regard to rainfall, temperature and vegetation cover, is more severe food insecure than lowlands in this study. Based on this research, it is important to analyze the temporal variation of food security according to the nature of specific AEZs as a future area of research. Additionally, supporting models in food security analysis is important for future projects because a single indicator/model may not address the complex and multidimentional food security issues as a proxy measure (Wineman, Citation2016; Kini, Citation2022). However, this study has some limitations as cross-sectional data is used, which cannot help examine food security on a temporal basis. The use of a minimum subsistence kcal requirement for an active and healthy life (2100) may not represent all household members due to their varied activity levels, ages, and gender, off course, helps to estimate where the households status would be based on standard already set as a proxy, which requires the support of another model beside this one to nearly address the complex and multidimentional issues of food security.
5. Conclusion and recommendations
Most households in the study area were food insecure, 54.27%. From AEZ’s viewpoint, 40%, 68.05% and 57.25% of food-insecure households were found in highland, midland and lowland agroecology, respectively. The Foster–Torbeck–Greer index, similarly, yielded the highest proportion of food insecure populations in the mid-land both in-depth and severity. Generally, by bringing all AEZs together, 27.7% of households were below the recommended ADE kcal/energy deficiency, and 15.5% were the most food insecure section in the area.
The overall result showed that agroecology and its associated physical characteristics like climate change perception, soil and water conservation, and water availability were significant factors determining food security status in the study area. Thus, agroecology-based farming practices and traditional and scientific backgrounds are considered urgent and vital viable bits of advice to be implemented. Also, soil and water conservation practices as part of climate adaptation with other comprehensive adaptation mechanisms need to be extended to midland and lowland agroecology to alleviate the lives and livelihood in midland and lowland areas, having special attention to midland.
The study found that large family size and small farmland size were critical food insecurity problems in the midlands. Proper family planning, strategies, and decisions to deliver optimum land size are required to achieve households’ food self-sufficiency. This implication works for all study areas, but based on the study results, prioritizing the midlands could be fair.
Income from crop sales was negative and significant in the study, associated with credit payments and non-food item purchases, even if the households are in a food shortage situation. The crucial policy implication would be prioritizing off-farm options or labor-intensive employment and technologies for large populations in the area. Thus, the off-farm option availability and income gain from it stops or at least reduces crop sales to support home consumption of crops produced.
The livestock size, especially milk-yielding cows and Ox for draft power, was positive and significant to food security. It is a source of income, milk products and meat for home consumption and market in mixed farming societies like the study area. Therefore, to raise the production and productivity of livestock and ultimately increase food security, farmers should be encouraged to engage in livestock farming by providing them with improved livestock production technologies (health services, improved breeds and feeds).
In conclusion, the food insecurity status and severity differ for different agro-ecologies as viewed from the analysis result. In connection with this, technical, institutional and policy interventions are to recommend respective AEZs. Thus, future research is required for agroecology-wise food security analysis determinants that help act according to the nature of specific AEZs.
Author contribution statement
Authors, Tegegn Bergene, Belay Simane and Meskerem Abi, have contributed to the project from conception and design to final approval, and Husen Maru contributed to the project from study area description to analysis and final approval.
Acknowledgments
The authors are grateful and appreciate the farmers in Sodo Zurya, Humbo, and Abala Abaya Districts who participated in the household survey. We also would like to thank Addis Ababa University and Wolaita Sodo University for the financial support for the corresponding author to conduct this study.
Disclosure statement
The authors declare no conflict of interest.
Data availability statement
Data used in this study are available from the corresponding author based on reasonable requests.
Additional information
Funding
Notes on contributors
Tegegn Bergene
Tegegn Bergene Zema is a PhD student in the Center for Food Security Studies, College of Development Studies, Addis Ababa University, Ethiopia. His areas of interest in research are food security, agriculture, climate change, and land degradation.
Belay Simane
Professor Belay Simane is a full professor in Agronomy and Environmental Sciences in the Department of Environment and Development, College of Development Studies at Addis Ababa University. He received his Ph.D. in Agronomy and Environmental Sciences Wageningen Agricultural University, Wageningen, Netherlands (1993. Professor Belay has published more than 143 peer-reviewed articles in international journals. His Research interest is around Ecosystem-based climate change analysis: mitigation and adaptation options, community based watershed management and environmental management system.
Meskerem Abi
Dr. Meskerem Abi has received his PhD from Wageningen University and Research center, The Netherlands. She is currently advising PhD students in the rank of assistant professor in the department of Center for Food Security Studies. She is serving as associate dean of college of Development Studies. She has published more than 24 peer-reviewed articles in international journals. Moreover, here research interest is in areas of food security related issues, land degradation, soil and water conservation, sustainable land management, watershed management, adaptation related issues, social capital, institutional analysis, farmers knowledge and strategies, sustainable agriculture, rural development.
Husen Maru
Dr. Husen maru has received his PhD from Addis Ababa University, Ethiopia. He is currently advising PhD students in the rank of assistant professor in the department of geography and Environmental studies at in Wolaita Sodo University. He is serving as senior researcher in Wolaita Sodo University and DAB Development Research and Training PLC. He has published more than 11 peer-reviewed articles in international journals.
References
- Abdulla, A. M. (2015). Determinants of household food security and coping strategies: The case of Bule-Hora District, Borana Zone, Oromia, Ethiopia. European Journal of Food Science and Technology, 3, 1–20.
- Abebe, W. (2021). Food insecurity in the horn of Africa and its impact on peace in the region. IPSS Policy Brief, 15, 1–8.
- Abo, T., & Kuma, B. (2015). Determinants of food security status of female-headed households: the case of Wolaita Sodo town, South Nations, Nationalities and Peoples Region, Ethiopia. International Journal of Scientific Footprints, 3, 8–24.
- Abo, T., & Tegegn Hailu, S. (2017). Climate Change Mitigation in Ethiopia: To What Extent Do Carbon Sequestration Projects Put Impact on Smallholder Farm Households’ Income? Journal of Environment and Earth Science, 7, 1–9.
- Adane, D. M., Atnafe, A. D., & Ahmed, H. M. (2015). The status of food availability in the face of climate change and variability in Choke Mountain Watersheds, Central Ethiopia. Journal of Development and Agricultural Economics, 7(10), 358–372. https://doi.org/10.5897/JDAE2015.0672
- Alemu, Z. A., Ahmed, A. A., Yalew, A. W., & Simanie, B. (2017). Spatial variations of household food insecurity in East Gojjam Zone, Amhara Region, Ethiopia: Implications for agroecosystem-based interventions. Agriculture & Food Security, 6(1), 1–9. https://doi.org/10.1186/s40066-017-0113-9
- Al, W., Orking, G., & Clima, O. (2008). Climate change and food security: A framework document (p. 3). FAO Rome.
- Amare, A., & Simane, B. (2017). Assessment of household food security in the face of climate change and variability in the upper blue-Nile of Ethiopia. Journal of Agricultural Science, 7, 285–300.
- Amenu, B. T., & Mamo, G. S. (2021). Impacts of population pressure on agricultural production and farming practices of households: The case of Essera Woreda in Dawro Zone, SNNPR, Ethiopia. Earth Sciences, 10(6), 298–314. https://doi.org/10.11648/j.earth.20211006.16
- Annapoorani, R., & Lakshmi, S. S. (2017). An Analytical Study of State Wise Variations in Food Security in India. International Journal of Research in Agricultural Sciences, 4, 2348–3997.
- Astatike, A. A., & Gazuma, E. G. (2019). The impact of off-farm activities on rural household income in Wolaita Zone, Southern Ethiopia. Journal of World Economic Research, 8(1), 8–16. https://doi.org/10.11648/j.jwer.20190801.12
- Atoloye, A. T., Ogunba, B. O., & Samuel, F. (2015). Spatial pattern of household food insecurity and childhood malnutrition in Akinyele local government area, Nigeria. International Journal of Health Sciences, 3, 235–250. https://doi.org/10.15640/ijhs.v3n1a15
- Ayele, A. W. (2020). Determinant factors of food security among households in Northern Ethiopia: An application of binary logistic regression model. Journal of Global Economics, 8, 4–10.
- Balta, A. (2016). Determinants of Rural Household Food Security in Wolaita Zone, South Ethiopia. Journal of Poverty, Investment and Development, 29, 1–9.
- Beyene, F. (2015). Determinants of food security under changing land-use systems among pastoral and agro-pastoral households in eastern Ethiopia. Environment, Development and Sustainability, 17(5), 1163–1182. https://doi.org/10.1007/s10668-014-9596-8
- Bojago, E. (2021). Opportunities and challenges of rehabilitation of degraded land in the case of Offa Woreda, Wolaita Zone, Ethiopia. Texas Journal of Multidisciplinary Studies, 1, 43–56.
- Brandt, S. A., Fisher, E. C., Hildebrand, E. A., Vogelsang, R., Ambrose, S. H., Lesur, J., & Wang, H. (2012). Early MIS 3 occupation of Mochena Borago Rockshelter, Southwest Ethiopian Highlands: implications for Late Pleistocene archaeology, paleoenvironments and modern human dispersals. Quaternary International, 274, 38–54. https://doi.org/10.1016/j.quaint.2012.03.047
- Cai, J., Ma, E., Lin, J., Liao, L., & Han, Y. (2020). Exploring global food security pattern from the perspective of spatio-temporal evolution. Journal of Geographical Sciences, 30(2), 179–196. https://doi.org/10.1007/s11442-020-1722-y
- Chartres, C. J., & Andrew, N. (2015). Sustainable intensification: Overcoming land and water coonstraints on food production. Food Security, 7(2), 235–245. https://doi.org/10.1007/s12571-015-0425-1
- Clay, E. (2002). Food security: Concepts and measurement. Trade Reforms and Food Security: Conceptualising the Linkages, 2002, 25–34.
- Cochran, W. G. (1977). Sampling technique, 1977 (Vol. 4, pp. 1–442). John Wiley&Sons.
- Craven, L. K., & Gartaula, H. N., and (2015). Conceptualising the migration-food security nexus: lesson from Nepal and Vanuatu. Australian Geographer, 46(4), 455–471. https://doi.org/10.1080/00049182.2015.1058797
- Dana, D., Andre, H., & Lika, T. (2020). Rapid rural population growth and its determinant factors in Wolaita zone, Ethiopia. Journal of Science and Inclusive Development, 2, 1–20. https://doi.org/10.20372/jsid/2020-46
- Debebe, S., & Zekarias, E. H. (2020). Analysis of poverty, income inequality and their effects on food insecurity in southern Ethiopia. Agriculture & Food Security, 9(1), 1–12. https://doi.org/10.1186/s40066-020-00269-3
- Dzanja, J., Christie, M., Fazey, I., & Hyde, T. (2015). The role of social capital in rural household food security: The case study of Dowa and Lilongwe Districts in Central Malawi. Journal of Agricultural Science, 7(12), 165–176. https://doi.org/10.5539/jas.v7n12p165
- El-Bilali, H., Bassole, I. H. N., Dambo, L., & Berjan, S. (2020). Climate change and food security. Agriculture & Forestry, 66, 197–210. https://doi.org/10.17707/AgricultForest.66.3.16
- Eldridge, E., Rancourt, M.-E., Langley, A., & Héroux, D. (2022). Expanding perspectives on the poverty trap for smallholder farmers in Tanzania: The role of rural input supply chains. Sustainability, 14(9), 4971. https://doi.org/10.3390/su14094971
- Esayas, B., Simane, B., Teferi, E., Ongoma, V., & Tefera, N. (2019). Climate variability and farmers’ perception in Southern Ethiopia. Advances in Meteorology, 2019, 1–19. https://doi.org/10.1155/2019/7341465
- Falcon, W. P., & Naylor, R. L. (2005). Rethinking food security for the twenty-first century. American Journal of Agricultural Economics, 87(5), 1113–1127. https://doi.org/10.1111/j.1467-8276.2005.00797.x
- Fekede, G., Lemma, Z., & Jemal, Y. (2016). Determinants of farm household food security in Hawi Gudina district, West Hararghe zone, Oromia Regional National State, Ethiopia. Journal of Agricultural Extension and Rural Development, 8(2), 12–18. https://doi.org/10.5897/JAERD2014.0660
- Foster, J., Greer, J., & Thorbecke, E. (1984). A class of decomposable poverty measures. Econometrica, 52(3), 761–766. https://doi.org/10.2307/1913475
- Gallardo-López, F., Hernández-Chontal, M. A., Cisneros-Saguilán, P., & Linares-Gabriel, A. (2018). Development of the concept of agroecology in Europe: A review. Sustainability, 10(4), 1210. https://doi.org/10.3390/su10041210
- Galor, O., & Weil, D. N. (2000). Population, technology, and growth: From Malthusian stagnation to the demographic transition and beyond. American Economic Review, 90(4), 806–828. https://doi.org/10.1257/aer.90.4.806
- Gazuma, E. G., & Astatike, A. A. (2019). Socioeconomic determinants of food insecurity among rural households in Wolaita Zone, Southern Ethiopia. Economics, 8(2), 55–61. https://doi.org/10.11648/j.eco.20190802.13
- Giller, K. E., Delaune, T., Silva, J. V., van Wijk, M., Hammond, J., Descheemaeker, K., van de Ven, G., Schut, A. G. T., Taulya, G., Chikowo, R., & Andersson, J. A. (2021). Small farms and development in sub-Saharan Africa: Farming for food, for income or for lack of better options? Food Security, 13(6), 1431–1454. https://doi.org/10.1007/s12571-021-01209-0
- Gunes, E., & Guldal, H. T. (2019). Determination of economic efficiency of agricultural enterprises in Turkey: A DEA approach. New Medit, 18(4), 105–115. https://doi.org/10.30682/nm1904h
- Guyu, F. D., & Muluneh, W. (2016). Determinants of seasonal food insecurity in the green famine belt of Ethiopia: The case of households in Belo-jiganfoy district, Benishangul-gumuz region. African Journal of Food Science, 10(11), 278–291. https://doi.org/10.5897/AJFS2016.1434
- Hameed, A., & Salam, A. (2020). Estimating the socio-economic factors of food insecurity in Pakistan: a regional level analysis. FWU Journal of Social Sciences, 14, 81–94.
- Hana, M. E., & Dereje, H. B. (2016). Analysis of Household Food Insecurity and its Covariates in Girar Jarso Woreda, Oromia Reginal Stata, Ethiopia. Journal of Economics and Sustainable Development, 7, 16–30.
- Harasty, C., & Ostermeier, M. (2020). Population ageing: Alternative measures of dependency and implications for the future of work (pp. 1–50). Geneva: ILO, Working paper 5.
- Hurni, H. (1998). Agroecological belts of Ethiopia. Wittwer Druck AG, Bern, Switzerland, 1, 1–43.
- Hurni, H., Abate, S., Bantider, A., Debele, B., Ludi, E., Portner, B., Yitaferu, B., & Zeleke, G. (2010). Land degradation and sustainable land management in the highlands of Ethiopia. North -Soutj Perspectives Global Change and Sustainable Development, 2010, 187–207.
- Jambo, Y., Alemu, A., & Tasew, W. (2021). Impact of small-scale irrigation on household food security: evidence from Ethiopia. Agriculture & Food Security, 10(1), 1–16. https://doi.org/10.1186/s40066-021-00294-w
- Jones, A. D., Ngure, F. M., Pelto, G., & Young, S. L. (2013). What are we assessing when we measure food security? A compendium and review of current metrics. Advances in Nutrition (Bethesda, MD), 4(5), 481–505. https://doi.org/10.3945/an.113.004119
- Kehinde, A. D., Adeyemo, R., & Ogundeji, A. A. (2021). Does social capital improve farm productivity and food security? Evidence from cocoa-based farming households in Southwestern Nigeria. Heliyon, 7(3), e06592. https://doi.org/10.1016/j.heliyon.2021.e06592
- Kerr, R. B., Madsen, S., Stüber, M., Liebert, J., Enloe, S., Borghino, N., Parros, P., Mutyambai, D. M., Prudhon, M., & Wezel, A. (2021). Can agroecology improve food security and nutrition? A review. Global Food Security, 29, 100540. https://doi.org/10.1016/j.gfs.2021.100540
- Kini, J. (2022). Multidimensional food security index: A comprehensive approach. Asian Journal of Agricultural Extension, Economics & Sociology, 40, 317–331. https://doi.org/10.9734/ajaees/2022/v40i121798
- Kogan, F., Guo, W., & Yang, W. (2019). Drought and food security prediction from NOAA new generation of operational satellites. Geomatics, Natural Hazards and Risk, 10(1), 651–666. https://doi.org/10.1080/19475705.2018.1541257
- Leza, T., & Kuma, B. (2015). Determinants of rural farm household food security in Boloso Sore District of Wolaita Zone in Ethiopia. Asian Journal of Agricultural Extension, Economics & Sociology, 5(2), 57–68. https://doi.org/10.9734/AJAEES/2015/14833
- Linderhof, V., De Lange, T., & Reinhard, S. (2021). The dilemmas of water quality and food security interactions in low-and middle-income countries. Frontiers in Water, 3, 1–17. https://doi.org/10.3389/frwa.2021.736760
- Madara, A. (2012). Effects of soil and water conservation practices on food security of small scale households: A case study of Machakos County, Kenya. University of Nairobi.
- Madsen, S., Bezner Kerr, R., LaDue, N., Luginaah, I., Dzanja, C., Dakishoni, L., Lupafya, E., Shumba, L., & Hickey, C. (2021). Explaining the impact of agroecology on farm-level transitions to food security in Malawi. Food Security, 13(4), 933–954. https://doi.org/10.1007/s12571-021-01165-9
- Mebrie, T., & Ashagrie, E. (2023). Rural household food security status and its determinants in Libokemkem woreda of the Amhara region, North Western Ethiopia. Journal of Poverty and Social Justice, 31(2), 252–275. https://doi.org/10.1332/175982721X16760300561102
- Mekonnen, A., Tessema, A., Ganewo, Z., & Haile, A. (2021). Climate change impacts on household food security and farmers adaptation strategies. Journal of Agriculture and Food Research, 6, 100197. https://doi.org/10.1016/j.jafr.2021.100197
- Melese, M., Tilahun, M., & Alemu, M. (2021). Household food insecurity and coping strategies in Southern Ethiopia. Agriculture & Food Security, 10(1), 1–12. https://doi.org/10.1186/s40066-021-00296-8
- Mengistu, S. W., & Kassie, A. W. (2022). Household level determinants of food insecurity in rural Ethiopia. Journal of Food Quality, 2022, 1–9. https://doi.org/10.1155/2022/3569950
- Mota, A. A., Lachore, S. T., & Handiso, Y. H. (2019). Assessment of food insecurity and its determinants in the rural households in Damot Gale Woreda, Wolaita zone, Southern Ethiopia. Agriculture & Food Security, 8(1), 1–11. https://doi.org/10.1186/s40066-019-0254-0
- Muleta, S. G. (2022). (Un) sustainability of rural household food security in Kurfa Chele Woreda: East Hararghe Zone, Ethiopia (pp. 1–283) [Unpublishe PhD thesis]. UNISA.
- Mulugeta, M. (2010). Food security attainment role of urban agriculture: A case study from Adama City. Ethiopian Journal of Business and Economics (The), 1, 68–106.
- Niles, M. T., Rudnick, J., Lubell, M., & Cramer, L. (2021). Household and community social capital links to smallholder food security. Frontiers in Sustainable Food Systems, 5, 1–14. https://doi.org/10.3389/fsufs.2021.583353
- Nosratabadi, S., Khazami, N., Abdallah, M. B., Lackner, Z., Band, S. S., Mosavi, A., & Mako, C. (2020). Social capital contributions to food security: A comprehensive literature review. Foods, 9(11), 1650. https://doi.org/10.3390/foods9111650
- Ogunniyi, A., Omonona, B., Abioye, O., & Olagunju, K. (2018). Impact of irrigation technology use on crop yield, crop income and household food security in Nigeria: A treatment effect approach. AIMS Agriculture and Food, 3(2), 154–171. https://doi.org/10.3934/agrfood.2018.2.154
- Omari, R., Quorantsen, K. E., & Omari, P. K. (2017). Nutrition knowledge and food consumption practices and barriers in rural Ghana: The case of foods for preventing vitamin a and iron deficiencies. African Journal of Food, Agriculture, Nutrition and Development, 17(01), 11639–11656. https://doi.org/10.18697/ajfand.77.15815
- Pérez-Escamilla, R. (2017). Food security and the 2015–2030 sustainable development goals: From human to planetary health. Current Developments in Nutrition, 1(7), e000513. https://doi.org/10.3945/cdn.117.000513
- Phan, N. T., Lee, J. Y., & Kien, N. D. (2022). The impact of land fragmentation in rice production on household food insecurity in Vietnam. Sustainability, 14(18), 11162. https://doi.org/10.3390/su141811162
- Rahmato, D. (2007). Development interventions in Wollaita, 1960s–2000s: A critical review. Forum for Social Studies FSS, 2007, 1–42.
- Ranganathan, P., Pramesh, C. S., & Aggarwal, R. (2017). Common pitfalls in statistical analysis: logistic regression. Perspectives in Clinical Research, 8(3), 148–151. https://doi.org/10.4103/picr.PICR_87_17
- Rasul, G., & Sharma, B., and (2016). The nexus approach to water-enery-foodsecurity: An option to adaptation to climate change. Climate Policy, 16(6), 682–702. https://doi.org/10.1080/14693062.2015.1029865
- Regasa, M. T. B. G. G. (2015). Analysis of credit service utilization by rural households: The case of Humbo Woreda, Wolaita Zone, Ethiopia. International Journal of African and Asian Studies, 13, 127–133.
- Russell, C., & Russell, W. M. S. (2000). Population crises and population cycles. Medicine, Conflict, and Survival, 16(4), 383–410. https://doi.org/10.1080/13623690008409538
- Sani, S., & Kemaw, B. (2019). Analysis of rural households food security in Western Ethiopia. Food and Nutrition Sciences, 10(03), 249–265. https://doi.org/10.4236/fns.2019.103019
- Sodjinou, E., Glin, L. C., Nicolay, G., Tovignan, S., & Hinvi, J. (2015). Socioeconomic determinants of organic cotton adoption in Benin, West Africa. Agricultural and Food Economics, 3(1), 1–22. https://doi.org/10.1186/s40100-015-0030-9
- Solomon, T., Derero, A., & Lemenih, M. (2022). Woody species regeneration through exclosure and perception of local community on mountain Damota, Wolaita, Ethiopia. Trees, Forests and People, 8, 100234. https://doi.org/10.1016/j.tfp.2022.100234
- Tofu, D. A., & Wolka, K. (2023). Transforming food insecure farmers from climate variability and land degradation susceptibility to resilient livelihoods. Research in Globalization, 7, 100168. https://doi.org/10.1016/j.resglo.2023.100168
- Tolossa, D. (2005). Combining household qualitative data and quantitative data in food security research. NTNU, 5, 1–15.
- Toma, T. M., Andargie, K. T., Alula, R. A., Kebede, B. M., & Gujo, M. M. (2023). Household food insecurity and associated factors in South Ari district, Southern Ethiopia: A community-based cross-sectional study. PLoS One, 18(4), e0284252. https://doi.org/10.1371/journal.pone.0284252
- UNICEF. (2021). The state of food security and nutrition in the world 2021. FAO. http://www.fao.org/3/cb4474en/cb4474en.pdf.
- Wineman, A. (2016). Multidimensional household food security measurement in rural Zambia. Agrekon, 55(3), 278–301. https://doi.org/10.1080/03031853.2016.1211019
- Woldemichael, M. (2019). Coping strategies of food insecure households: The case of Offa District, Wolaita Zone, South Nations nationalities and peoples region. Development Country Studies, 9, 1–23. https://doi.org/10.7176/DCS/9-8-03
- Yesuph, D. S., Bedeke, S. B., & Didana, H. L. (2023). Assessing climate change-induced poverty of mixed crop-livestock smallholders in Wolaita zone. Research in Globalization, 7, 100158. https://doi.org/10.1016/j.resglo.2023.100158
- Zeray, D. D., & Dawit, D. (2017). Determinants of rural household food security in Wolaita Zone: the case of Humbo Woreda. Journal of Poverty, Investment and Development, 32, 2422–2846.
- Zeray, N., & Demie, A. (2016). Climate change impact, vulnerability and adaptation strategy in Ethiopia: A review. Journal of Earth and Environmental Sciences, 5, 45–56.