
Abstract
After the introduction of mobile computing devices, the way people listen to music has changed considerably. Although there is a broad scientific consensus on the fact that people show music preferences and make music choices based on their feelings and emotions, the sources of such preferences and choices are still debated. The main aim of this study is to understand whether listening in ecological (mobile) contexts differs from listening in non-mobile contexts in terms of the elicited emotive response. A total of 328 participants listen to 100 classical music tracks, available through an ad-hoc mobile application for mobile devices. The participants were asked to report their self-evaluation of each of the tracks, according to the Pleasure-Arousal-Dominance model and filled out a questionnaire about their listening behaviour. Our findings show that the same factors that affect music listening in non-mobile contexts also affect it in a mobile context.
PUBLIC INTEREST STATEMENT
This study investigates whether listening to music in a mobile context affects the emotions of the listener in a different way than in non-mobile contexts. Such an understanding will provide a deeper insight into the mechanisms involved in emotion elicitation and help better to inform automatic content selection and suggestion engines. More than three hundred participants were involved in the experimentation, listening to one hundred classical music tracks and providing their feedback through a mobile app specifically developed for this investigation. Our findings show that there is no detectable difference in the factors affecting the user’s emotions between the mobile and non-mobile contexts. A possible explanation is that the users tend to use the same devices and streaming services in both contexts, thus enjoying very similar experiences.
1. Introduction
In recent years, the way people listen to music has changed considerably (Avdeeff, Citation2012; Crawford, Citation2017). The spread of mp3 players first, and then, even more significantly, the wide diffusion of streaming services and music apps for smartphones, shifted music listening towards more ecological contexts, induced by the use of mobile devices while immersed in the different activities of everyday life (Krause & North, Citation2016; Srivastava, Citation2010). The world of music is remarkably complex and varied and although there is a broad scientific consensus on the fact that people show music preferences and make music choices based on their feelings and emotions, the sources of such preferences and choices are still debated (Picking, Citation2010).
Previous research concerning music preference studied music attributes that describe psychological characteristics of musical pieces. One of the first analyses concerned the putative inverted-U relationship between the degrees of pleasure and arousal evoked by music (Kellaris, Citation1992; North & Hargreaves, Citation1996). Berlyne’s theory (Citation1971) argues that there is an inverted-U between liking for music and the degree of arousal it evokes so that moderately arousing music is liked the most. Laboratory research confirmed such an inverted-U relationship. Other studies mainly focused on the factor structure of music attribute preference and its relationship with personality. Rentfrow and Gosling (Citation2007) rated music excerpts based on 14 sonic and psychological attributes and showed that much of the variance in music genre preferences can be attributed to the liking of musical features. Ju-Chiang Wang, Yi-Hsuan, Hsin-Min and Shyh-Kang (Citation2015) statistically modelled the affective reaction of the users while listening to music excerpts, by means of a Gaussian Mixture Model (GMM) on the valence-arousal (VA) plane. Xiao Hu and Yi-Hsuan Yang (Citation2017) investigated the effects of different cultural background of the users and of different choices of datasets on the mood estimation of musical excerpts, again assuming a two-factor VA structure. Greenberg, Rentfrow and Baron-Cohen (Citation2016) had subjects rate 102 song excerpts on 38 attributes. They found a three-factor structure: Arousal (e.g. tense, strong, warm), Depth (e.g. sophisticated, relaxing, party music) and Valence (e.g. joyful, lively, sad). Also Fricke and Herzberg (Citation2017) aimed to confirm this three-factor structure and the relationships with the personality domains. The authors used self-reported music attribute preference and replicated the findings of Greenberg et al. (Citation2016). In studying music attributes that describe psychological characteristics of musical pieces, Juslin (Citation2000) and Bradley and Lang (Citation1994) used the Self-Assessment Manikin (SAM) scale to evaluate pleasure, arousal and dominance. The SAM scale is based on an environmental psychology theory that states that human emotional responses result from variations in pleasure, arousal and dominance. According to the theory, these three dimensions are necessary and sufficient to characterize a subject’s feelings, which are influenced both by the personal and environmental stimuli. In turn, a subject’s emotional state regulates his behaviour in a situation. In the present study, we used the SAM scale for two reasons: 1) it is based on a consolidated theory and 2) SAM-based evaluations can be easily collected through an automatized procedure realized by a client-server mobile application.
The digitization of music has altered consumption practices (Avdeeff, Citation2012), particularly by allowing more interactivity (Kibby, Citation2009) so that listeners are no longer constrained by, for instance, albums and track orders (Molteni & Ordanini, Citation2003). Moreover, due to the introduction of mobile computing devices (e.g. mp3 players and smartphones and tablets), people are able to exert greater control than ever before on how, when and where they experience music (Bryan-Kinns & Hamilton, Citation2012; Franco & Cataluna, Citation2009; Heye & Lamont, Citation2010; Juslin, LiljeströM, VäStfjäLl, Barradas, & Silva, Citation2008; Krause, North, & Hewitt, Citation2013; North & Hargreaves, Citation2008; Sloboda, Lamont, & Greasley, Citation2009; Tseng & Hsieh, Citation2018). As a consequence, the music listening scenario has completely changed and further investigation is needed on the effect of music listening on user emotions and mood in such mutated context.
Randall and Rickard (Citation2013) developed a Mobile Experience Sampling Method (M-ESM) to collect real-time data on personal music listening. In a subsequent work (Citation2016), the same authors used this method to provide empirical data to further investigate the different motivations for music listening preferences and the corresponding affective outcomes. In both studies, the aim of the authors was to determine the conditions under which personal listening to some musical track, chosen by the participant, results in either short-term hedonic increase or decrease. The participants recorded their initial mood in terms of valence and arousal, then they chose and listen to a musical piece, and finally they recorded their final mood in terms of valence and arousal (Randall & Rickard, Citation2013).
The aim of our study is different: we are interested in understanding whether listening in ecological (mobile) contexts differs from listening in non-mobile contexts in terms of the elicited emotive response. As we are interested in providing an “emotional rating” of the musical track (in the case of mobile listening), we evaluate the emotional response to a randomly ordered sequence of specific classical music tracks, disregarding the initial condition of the listener and the reasons that could lead them to prefer or not a piece. To our knowledge in the relevant literature, no other studies focused on estimating the emotional response of users in the mobile context with a specific set of music excerpts.
To reach this objective, we firstly assessed the perceived pleasure, arousal and dominance levels induced by each track, secondly, we analysed how different factors, including gender, age, music preferences, place, time and modality of listening, can be related to the perceived emotions (Antonietti et al., Citation2015; Fabio, Citation2017; Fabio & Antonietti, Citation2012; Fabio & Caprì, Citation2015, Citation2017; Fabio et al., Citation2018; Fabio, Castriciano, & Rondanini, Citation2015; Fabio & Urso, Citation2014; Martino, Caprì, Castriciano, & Fabio, Citation2017). We included gender because in Western culture women perceive more emotions compared to men and, in particular, are more reactive to unpleasant scenes, especially to those more aversive and traumatic (Bradley, Codispoti, Sabatinelli, & Lang, Citation2001). Also, based on the evidence, women tend to report experiencing more pleasure and joy (Deng et al., Citation2016). Age of participants is another important factor as participants of different generations might have different perceptions of musical genres and could perceive pleasure, arousal and dominance in different ways (Paule-Ruiz et al., Citation2017; Rentfrow, Goldberg, & Levitin, Citation2011). North and Hargreaves (Citation2007a, Citation2007b, Citation2007c) also underlined that, according to several studies in the literature, musical preferences provide a way to discriminate between social groups and that such studies suggest indirectly that musical preferences might correlate with a variety of different lifestyle choices. In their study, 328 participants responded to questions regarding their musical preferences and provided data on various social class-related aspects of their lifestyle (namely travel, personal finances, education, employment, health and drinking and smoking). The reported results show that there are numerous associations between musical preference and the considered aspects of participants’ lifestyle, for example, melancholic situations called for sad and moody music, while an arousal situation would call for loud, strong rhythm and invigorating music. Differently from the work by North and Hargreaves, in our work the location in which participants normally listen to music is also recorded, thus taking into consideration the context (both activities and environment) for listening. To this end, for example, melancholic situations called for sad and moody music, while an arousal situation would call for loud, strong rhythm and invigorating music. In our study, the participants could choose where and when to run the tests and reply to the questionnaires, so that data was collected in an ecological setting.
2. Method
2.1. The system architecture
We collected the data through an automatized procedure realized by a client-server mobile application. The mobile application (App) was made available for both iOS and Android platforms, through their respective official application stores.
The App is modular, each module dedicated to a specific task, so that the user can autonomously and easily access the system and fill in the questionnaires. On the server side, the data are automatically collected in a database and made available for analysis.
In this section, we present the architecture of the system implemented for data collection and storage. Figure illustrates the architecture for data collection.
Figure 1. Sketch of the architecture used to collect users’ data
The App was developed using Cordova (cordova.apache.org), an open source Apache project that allows the development of mobile applications using languages that are typically used in the Web context, namely HTML, CSS and JavaScript. The advantage of this approach is that, starting from the same application project, Cordova provides different packages for the most common mobile application markets.
After the development, we published the App through the official app markets and made the respective links available, together with an adequate description, through the project website (nisclab.wordpress.com).
The App allows a new user to register or a registered user to login and choose between the two available languages (either English or Italian) for the user interface. The data are collected and stored anonymously, even though the user can optionally register his/her own email address to be contacted for further news about the research project. By accessing the application, the user can listen to different musical tracks and provide a self-evaluation of the emotions elicited while listening to the tracks.
In the registration page, the user can add information about her social condition and musical preferences. The registration questionnaire is composed of seven questions, as shown in Figure .
Figure 2. Mobile application screenshot showing a questionnaire about user data
When clicking on the Register button, the app sends a SOAP (www.w3.org/TR/soap/) request to a Web service through a Php (www.php.net) page provided by the Web server. Subsequently, the server sends a SOAP message, alerting about the success of the registration. All the collected data are then stored in a MySQL (www.mysql.com) database hosted by the same server.
2.2. Participants
A total of 328 participants were enrolled, 176 women and 152 men. The participants were divided into three groups: 116 subjects under the age of 18 (35.4%); 88 subjects between 19 and 21 years old (26.8%); 124 subjects over 22 years old (37.8%).
All participants were asked to register through the mobile application and to provide personal and social information anonymously: gender; age; employment; place where the participant listens to music (where); time spent listening to the music per week (when); activities during the listening (how); what kind of music the participant usually listens to (what). A summary of the participants' data is shown in Table .
Table 1. Characteristics of the participants
2.3. Materials
The set of songs used for the analysis was created by selecting 100 audio fragments, e.g. ten audio fragments for each of the following authors: W. A. Mozart, L. van Beethoven, F. Lizst, A. Vivaldi, S. V. Rachmaninov, F. Shubert, J. S. Bach, M. Ravel, P. I. Tchaicovsky, S. S. Prokofiev. The audio files were collected from www.musopen.org and are shown in Table .
Table 2. Music tracks from which excerpts were selected (from www.musopen.org)
To obtain an evaluation of the emotional state elicited by the music for each participant, we adopted the SAM (Self-Assessment Manikin) scale, a non-verbal pictorial evaluation technique that allows the participant to express degrees of pleasure, arousal and dominance feeling. Designed by Mehrabian and Russell (Citation1974), this elaborated semantic differential scale is a widely used tool to evaluate the three-dimensional structure of objects, events and situations. The three dimensions of the scale refer to pleasure, arousal and dominance. The Pleasure-Displeasure Scale measures how pleasant or unpleasant one feels about something. The Arousal–Nonarousal Scale measures how energized or soporific one feels. The Dominance-Submissiveness Scale represents the controlling and dominant feeling versus the submissive feeling. The SAM scale was originally implemented to become an interactive computer program but later expanded to include a paper version. Figure shows the SAM figure with pleasure, arousal and dominance scales on the top, middle and bottom rows, respectively.
Figure 3. SAM scale on a nine-point scale to assess for pleasure, arousal and dominance
As already mentioned, we used a mobile application to collect user data that includes the SAM scale questionnaires, to collect emotion-related data about participants.
Figure shows a screen page of the mobile application where the user is asked to respond to a SAM questionnaire. Every time a new user registers to the mobile application, the Web service is invoked to build a new random list of audio excerpts for that specific user, as we thought it might not be realistic that a single user could evaluate each of the audio fragments. We have therefore collected 2631 user evaluations over 100 audio excerpts; the mean of tracks evaluated for each user was 26.31 (SD = 5.06).
Figure 4. Mobile application screenshot showing a questionnaire about emotion-related music evaluation with SAM scales
2.4. Data analysis
Data analysis was performed assuming gender, age, music preferences, place, time and modality of listening as independent variables, and the SAM subscales as dependent variables.
Firstly, we analysed the following: 1) the correlation of the subscales using two-tailed Pearson correlations (with an alpha value of 0.05) of the SAM subscales and 2) the general performances on the subscales for each track.
Secondly, we tested specific hypotheses regarding gender, age, music preferences, place, time and modality of listening. Independent samples t-tests (with an alpha value of 0.05) were used to determine differences in the SAM scores when the levels of the variable were two (as in gender: male and female) and F-tests (with an alpha value of 0.05) were used to determine differences in the SAM scores when the levels of the variables were higher than two.
3. Results
To assess the association among the three dimensions of the SAM scale (pleasure, arousal and dominance (PAD)), Pearson’s correlation coefficients were calculated. There were strong and statistically significant correlations between the pleasure sub-scale and the arousal sub-scale (r = 0.594, p < 0.001), between the pleasure sub-scale and the dominance sub-scale (r = 0.837, p < 0.001) and between the arousal sub-scale and the dominance sub-scale (r = 0.614, p < 0.001). These results mean that the tracks that elicited a high feeling in one dimension also elicited high feeling in the other two dimensions. The strong covariation between reports of pleasure, arousal and dominance have been also reported in other studies (Bradley & Lang, Citation1994) and indicate that SAM is an effective method for measuring existing feeling states.
To identify those tracks that gave rise to significantly higher or lower scores we assessed pleasure, arousal and dominance scores across the 100 tracks. We report each track’s mean in Figure , and we indicate the highest and lowest scores as follows: ‘X’s show track values that are below the mean minus one standard deviation (< M-1SD), and circles show track values are above the mean plus one standard deviation (> M + 1SD).
Figure 5. Means of each dimension of the SAM for each track with stacked line chart
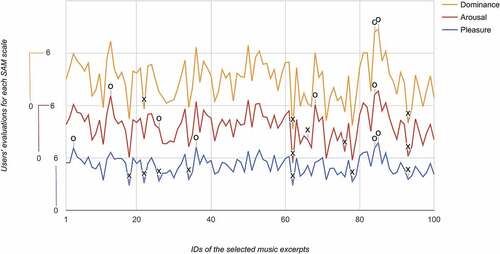
As such, this analysis identified the highest and lowest scores in terms of each of pleasure, arousal and dominance dimensions. These results demonstrate that the PAD dimensions can distinguish between the different tracks.
Table shows the author and the title of each track presented in the X-axis of Figure . Tracks 3, 36, 84 and 85 were perceived as eliciting a high level of pleasure (see Table ).
Tracks 18, 22, 26, 34, 62, 78 and 93 were perceived as eliciting a low level of pleasure. Tracks 13, 26, 68 and 84 were perceived as eliciting a high level of arousal, while tracks 62, 66, 76 and 93 as eliciting a low level of arousal. Furthermore, tracks 84 and 85 were perceived as eliciting a high level of dominance, and track 22, 62, 93 were perceived as eliciting as low level of dominance. Table shows the mean evaluation values, with their standard deviation, for the above-mentioned audio excerpts, together with the source musical pieces and their mode and tempo attributes. To explain these first results, we considered some musical characteristics of the audio excerpts. It is well known from the literature that musical mode (major or minor) and tempo (slow or fast) affect the user’s emotional reactions (Antonietti, Cocomazzi, & Iannello, Citation2009; Colombo & Antonietti, Citation2017; Hunter, Schellenberg, & Schimmack, Citation2010; Husain, Thompson, & Schellenberg, Citation2002; Mehrabian & Russell, Citation1974; Stalinski & Schellenberg, Citation2012). According to these findings, as shown in Table , excerpts in major mode are associated with high levels of pleasure, while excerpts in minor mode correspond to low levels of pleasure. Moreover, tempo affects the activation of the users in the arousal and dominance scales. We considered that user’s response is also related to past experiences about known music pieces.
Table 3. Subset of the audio excerpts with users’ evaluations and their musical attributes (musical mode and tempo)
All the considerations above agree with prior research on music listening in non-mobile context.
To address the second aim, we analysed how different factors, including gender, age, employment, music preferences, place and time may influence perceived pleasure, arousal and dominance. Owing to the high number of variables, a Bonferroni correction was applied to each analysis. With reference to gender, as the data were normally distributed, t-test for independent measure was applied. As in the study of Fricke and Herzberg (Citation2017) women tend to report a higher level of pleasure with the musical tracks than men in tracks 10, 11, 12, 15, 26, 35, 48, 50, 62, 96 and 97. With reference to arousal, score t-tests were statistically significant in tracks 62, 44, 59, 68, 69, 81, 99: again, women report experiencing more arousal with the musical tracks than men. With reference to dominance, score t-tests were statistically significant in tracks 25, 35, 55, 73, 90, 97; in this case, women report experiencing more dominance in tracks 15 and 35 and men report experiencing more dominance in tracks 55, 73, 90, 97. For all the above-mentioned tracks we obtained p values of t-test lower than 0.01. With reference to age, F tests were significant in tracks 18, 22, 23, 42, 43, 56, 57 and 72. People with age higher than 22 report experiencing more pleasure, arousal and dominance than younger people do.
With reference to employment, employed people report experiencing more pleasure and arousal than students and the unemployed (tracks 22, 23, 28, 43, 56, 59, 72). Both these results are similar to the results of the work of Rentfrow et al. (Citation2011).
We found that the results referred to the location are weak and not significant and with regard to the time spent in music listening we found that subjects who spend more time listening to music experience more pleasure and dominance than subjects that spend less time (tracks 14, 16, 23, 24, 25, 56, 42, 69, 73, 93). For all the above-mentioned tracks we obtained p values of F-test lower than 0.01.
As seen in the introduction of this work, the same variables that influence the perceived emotions such as gender, age, music preferences, place, time and modality of listening in non-mobile contexts influence also the perceived emotions in mobile context. Far from considering this as a negative result, we think that it suggests that the way to listen to music has a low impact on the perceived emotions and that the challenge could be to understand if it has a greater impact on other aspects of the social relationship such as communication or lack of communication.
4. Discussion
Music listening in the mobile context has grown in the past years together with the massive spread of mobile devices. This modality in music listening, and the enhanced technical capabilities of mobile devices, has led to new ways to conceive the fruition of music by users. Prior research focused on measuring the reasons that motivate users to listen to music in mobile context, and how this different context may change the listening experience (Randall & Rickard, Citation2013, Citation2016). Moreover, the possibility to propose musical playlists based on the mood of the user has also raised the interest of industry (U.S. Patent No. 9,788,777 B1, Citation2017).
However, to the best of our knowledge, the relevant literature lacks studies focused on measuring the specificity in emotional response of users in the mobile context with a specific set of music excerpts. On the basis of prior research, we considered the behavioural and social parameters that are known to influence the music listening, and measured the emotive response of the users within an ecological context, by the means of an original mobile application.
Our results show how, for each musical track, different sources, i.e. gender, age, employment, place, time and music preferences, differently affect the Pleasure–Arousal–Dominance measures. Thus, substantially agreeing with the findings of prior literature and suggesting that the mobile context does not sensibly affect the way music listening elicits emotions in the users.
5. Conclusion
In conclusion, the adoption of a mobile application has confirmed to be a valuable method to collect users’ data in an ecological context, and we proposed an original research showing that also in a more ecological (mobile) context the music characteristics and the social data that affect emotive responses corroborate and generalize those already known from prior research conducted in non-mobile contexts.
One limitation of the present study is the low heterogeneity of users, being most of them students. Hence, as part of future work, we plan to extend the number of users, increasing their variety in age and employment, to study more deeply the discussed findings. In fact, our findings suggest that it would be possible to get more precise music emotional evaluation within a specific user group.
Author statement
The Authors belong to a research group “Cognition and Interaction Technology” at the University of Messina (Italy), focusing on human and technological factors related to the effects of current and future media and interaction technologies on human emotions, performance and cognitive activities.
Declaration of interest statement
The authors declare no conflict of interest and no source of funding. All procedures performed in studies involving human participants were in accordance with the ethical standards of the institutional and/or national research committee and with the 1964 Helsinki declaration and its later amendments or comparable ethical standards. Informed consent was obtained from parents of the participants included in the study.
correction
This article was originally published with errors, which have now been corrected in the online version. Please see Correction (http://dx.doi.org/10.1080/23311916.2020.1787690)
Acknowledgements
The authors thank all participants in this study.
Data availability statement
The data that support the findings of this study are openly available at http: www.mysql.com
Additional information
Funding
Notes on contributors
Rosa Angela Fabio
Rosa Angela Fabio is Full Professor of General Psychology at the University of Messina. She mainly works in the area of experimental psychology on automatic and controlled processes of attention.
Giancarlo Iannizzotto
Giancarlo Iannizzotto is Associate Professor of Human-Computer Interaction at the University of Messina. He works in the areas of Artificial Intelligence and Computer Vision applied to Human-Computer Interaction and assistive technologies.
Andrea Nucita
Andrea Nucita is Assistant professor of Web Programming at the University of Messina, Italy. His research interests include Data Management and Medical Informatics.
Tindara Caprì
Tindara Caprì is a researcher and psychologist. She mainly works in cognitive processes, general psychology and experimental psychology.
Related Research Data
References
- Antonietti, A., Cocomazzi, D., & Iannello, P. (2009). Looking at the audience improves music appreciation. Journal of Nonverbal Behaviour, 33, 89–17. doi:10.1007/s10919-008-0062-x
- Antonietti, A., Colombo, B., & Di Nuzzo, B. (2015). Metacognition in self-regulated multimedia learning: Integrating behavioural, psychophysiological and introspective measures. Learning, Media and Technology, 40, 187–209. doi:10.1080/17439884.2014.933112
- Avdeeff, M. (2012). Technological engagement and musical eclecticism: An examination of contemporary listening practices. Participations: Journal of Audience and Reception Studies, 9(2), 265–285.
- Berlyne, D. E. (1971). Aesthetics and psychobiology. New York: Appleton-Century-Crofts.
- Bradley, M. M., Codispoti, M., Sabatinelli, D., & Lang, P. J. (2001). Emotion and motivation II: Sex differences in picture processing. Emotion, 1(3), 300–319.
- Bradley, M. M., & Lang, P. J. (1994). Measuring emotion: The self-assessment manikin and the semantic differential. Journal of Behavior Therapy and Experimental Psychiatry, 25(1), 49–59.
- Bryan-Kinns, N., & Hamilton, F. (2012). Identifying mutual engagement. Behaviour & Information Technology, 31, 101–125. doi:10.1080/01449290903377103
- Colombo, B., & Antonietti, A. (2017). The role of metacognitive strategies in learning music: A multiple case study. British Journal of Music Education, 34(1), 95–113. doi:10.1017/S0265051716000267
- Crawford, E. 2017. U.S. Music 360 2017 report highlights. Retrieved from http://www.nielsen.com/us/en/insights/reports/2017/music-360-2017-highlights.html
- Deng, Y., Chang, L., Yang, M., Huo, M., Zhou, R., & Eder, A. B. (2016). Gender differences in emotional response: Inconsistency between experience and expressivity. PloS one, 11, 6. doi:10.1371/journal.pone.0158666
- Fabio, R. A., & Antonietti, A. (2012). Effects of hypermedia instruction on declarative, conditional and procedural knowledge in ADHD students. Research in Developmental Disabilities, 33, 2028–2039. doi:10.1016/j.ridd.2012.04.018
- Fabio, R. A., & Caprì, T. (2015). Autobiographical memory in ADHD subtypes. Journal of Developmental and Intellectual Disability, 40, 1–11. doi:10.3109/13668250.2014.983057
- Fabio, R. A., & Caprì, T. (2017). The executive functions in a sample of Italian adults with ADHD: Attention, response inhibition and planning/organization. Mediterranean Journal of Clinical Psychology, 5(3), 1–17. doi:10.6092/2282-1619/2017.5.1636
- Fabio, R. A., Caprì, T., Mohammadhasani, N., Gangemi, A., Gagliano, A., & Martino, G. (2018). Frequency bands in seeing and remembering: Comparing ADHD and typically developing children. Neuropsychological Trends, 24, 97–116. doi:10.7358/neur-2018-024-fabi
- Fabio, R. A., Castriciano, C., & Rondanini, A. (2015). ADHD: Auditory and visual stimuli in automatic and controlled processes. Journal of Attention Disorders, 19(9), 771–778. doi:10.1177/1087054712459562
- Fabio, R. A., & Urso, M. (2014). The analysis of attention network in ADHD, attention problems and typically developing subjects. Life Span and Disability, 17(2), 199–221.
- Fabio, R. A. (2017). The study of automatic and controlled processes in ADHD: A reread and a new proposal. Mediterranean Journal of Clinical Psychology, 5, 1-8. doi: 10.6092/2282-1619/2017.5.1507
- Franco, M. S., & Cataluna, F. (2009). Connection between customer emotions and relationship quality in online music services. Behaviour & Information Technology, 29, 633–651. doi:10.1080/01449290903235343
- Fricke, K. R., & Herzberg, P. Y. (2017). Personality and self-reported preference for music genres and attributes in a German-speaking sample. Journal of Research in Personality, 68, 114–123. doi:10.1016/j.jrp.2017.01.001
- Greenberg, D. M., Rentfrow, P. J., & Baron-Cohen, S. (2016). Can music increase empathy? Interpreting musical experience through the empathizing-systemizing (E-S) theory: Implications for Autism. Empirical Musicology Review, 10(1–2), 80–95. doi:10.18061/emr.v10i1-2.4603
- Heye, A., & Lamont, A. (2010). Mobile listening situations in everyday life: The use of MP3 players while travelling. Musicae Scientiae, 14(1), 95–120. doi:10.1177/102986491001400104
- Hunter, P. G., Schellenberg, E. G., & Schimmack, U. (2010). Feelings and perceptions of happiness and sadness induced by music: Similarities, differences, and mixed emotions. Psychology of Aesthetics, Creativity, and the Arts, 4(1), 47–56. doi:10.1037/a0016873
- Husain, G., Thompson, W. F., & Schellenberg, E. G. (2002). Effects of musical tempo and mode on arousal, mood, and spatial abilities. Music Perception, 20(2), 151–171. doi:10.1525/mp.2002.20.2.151
- Ju-Chiang, W, Yi-Hsuan, Y., Hsin-Min, J., & Shyh-Kang, W. (2015). Modeling the affective content of music with a gaussian mixture model. IEEE Transactions on Affective Computing, 6(1), 56–68. doi:10.1109/TAFFC.2015.2397457
- Juslin, P. N. (2000). Cue utilization in communication of emotion in music performance: Relating performance to perception. Journal of Experimental Psychology: Human Perception and Performance, 26(6), 1797–1812.
- Juslin, P. N., LiljeströM, S., VäStfjäLl, D., Barradas, G., & Silva, A. (2008). An experience sampling study of emotional reactions to music: Listener, music, and situation. Emotion, 8(5), 668–683. doi:10.1037/a0013505
- Kellaris, J. J. 1992. “Consumer Esthetics outside the lab: Preliminary report on a musical field study.” Advances in Consumer Research 730–734.
- Kibby, M. (2009). Collect yourself: Negotiating personal archives. Information, Communication and Society, 12(3), 428–443. doi:10.1080/13691180802660644
- Knight, R. T., Gurumoorthy, R., Topchy, A., Dev, R., Soundararajan, P., & Pradeep, A. 2017. U.S. Patent No. 9,788,777 B1. Washington DC: U.S. Patent and Trademark Office.
- Krause, A. E., & North, A. C. (2016). Music listening in everyday life: Devices, selection methods, and digital technology. Psychology of Music, 44(1), 129–147. doi:10.1177/0305735614559065
- Krause, A. E., North, A. C., & Hewitt, L. Y. (2013). Music listening in everyday life: Devices and choice. Psychology of Music, 43(2), 155–170. doi:10.1177/0305735613496860
- Martino, G., Caprì, T., Castriciano, C., & Fabio, R. A. (2017). Automatic deficits can lead executive deficits in ADHD. Mediterranean Journal of Clinical Psychology, 5(3), 1–32. doi:10.6092/2282-1619/2017.5.1669
- Mehrabian, A., & Russell, J. A. (1974). An approach to environmental psychology. Cambridge MA: The MIT Press.
- Molteni, L., & Ordanini, A. (2003). Consumption patterns, digital technology and music downloading. Long Range Planning, 36(4), 389–406. doi:10.1016/S0024-6301(03)00073-6
- North, A. C., & Hargreaves, D. J. (1996). The effects of music on responses to a dining area. Journal of Environmental Psychology, 16(1), 55–64. doi:10.1006/jevp.1996.0005
- North, A. C., & Hargreaves, D. J. (2007a). Lifestyle correlates of musical preference: 1. Relationships, living arrangements, beliefs, and crime. Psychology of Music, 35(1), 58–87. doi:10.1177/0305735607068888
- North, A. C., & Hargreaves, D. J. (2007b). Lifestyle correlates of musical preference: 2.Media, leisure time and music. Psychology of Music, 35(2), 179–200. doi:10.1177/0305735607070302
- North, A. C., & Hargreaves, D. J. (2007c). Lifestyle correlates of musical preference: 3. Travel, money, education, employment and health. Psychology of Music, 35(3), 473–497. doi:10.1177/0305735607072656
- North, A. C., & Hargreaves, D. J. (2008). The social and applied psychology of music. Oxford: Oxford University Press.
- Paule-Ruiz, M., Álvarez-García, V., Pérez-Pérez, J. R., Álvarez-Sierra, M., & Trespalacios-Menéndez, F. (2017). Music learning in preschool with mobile devices. Behaviour & Information Technology, 36, 95–111.
- Picking, R. (2010). Reading music from screens vs paper. Behaviour & Information Technology, 16, 72–78. doi:10.1080/014492997119914
- Randall, W. M., & Rickard, N. S. (2013). Development and trial of a mobile experience sampling method (M-Esm) for personal music listening. Music Perception, 31(2), 157–170. doi:10.1525/mp.2013.31.2.157
- Randall, W. M., & Rickard, N. S. (2016). Reasons for personal music listening: A mobile experience sampling study of emotional outcomes. Psychology of Music, 45(4), 1–17.
- Rentfrow, P. J., Goldberg, L. R., & Levitin, D. J. (2011). The structure of musical preferences: A five-factor model. Journal of Personality and Social Psychology, 100, 1139–1157. doi:10.1037/a0022406
- Rentfrow, P. J., & Gosling, S. D. (2007). The content and validity of music-genre stereotypes among college students. Psychology of Music, 35(2), 306–326. doi:10.1177/0305735607070382
- Sloboda, J. A., Lamont, A., & Greasley, A. E. (2009). Choosing to hear music: Motivation, process, and effect. In S. Hallam, I. Cross, & M. Thaut (Eds.), The oxford handbook of music psychology (pp. 431–440). Oxford: University Press.
- Srivastava, L. (2010). Mobile phones and the evolution of social behaviour. Behaviour & Information Technology, 24, 111–129.
- Stalinski, S. M., & Schellenberg, E. G. (2012). Music cognition: A developmental perspective. Topics in Cognitive Science, 4(4), 485–497. doi:10.1111/j.1756-8765.2012.01217.x
- Tseng, T. H., & Hsieh, S. H. (2018). Determinants of emoticon usage in mobile instant messaging: A construal level theory perspective. Behaviuor & Information Technology, 38, 289-301.
- Xiao, H., & Yi-Hsuan, Y. (2017). Cross-dataset and cross-cultural music mood prediction: A case on western and chinese pop songs. IEEE Transactions on Affective Computing, 8(2), 228–240. doi:10.1109/TAFFC.2016.2523503