
 ?Mathematical formulae have been encoded as MathML and are displayed in this HTML version using MathJax in order to improve their display. Uncheck the box to turn MathJax off. This feature requires Javascript. Click on a formula to zoom.
Abstract
Green Information Systems in general, and footprint calculators in particular, are promising feedback tools to assist people in adopting sustainable behaviour. Therefore, a Material Footprint model for use in an online footprint calculator was developed by identifying the most important predictors of the Material Footprint of the calculator’s users. By means of statistical learning, the analysis revealed that 22 of the 95 predictors identified accounted for 74% of the variance in Material Footprints. Ten predictors out of the 95, mainly from the mobility domain, were capable of showing a prediction accuracy of 61%. The authors conclude that 22 predictors from the areas of mobility, housing and nutrition, as well as sociodemographic information, accurately predict a person’s Material Footprint. The short and concise Material Footprint model may help developers and researchers to enhance their information systems with additional items while ensuring the data quality of such applications.
PUBLIC INTEREST STATEMENT
Behavioural changes in favour of more resource-efficient consumption are still hampered by obstacles such as a lack of information and personalised feedback. The article contributes to the improvement of footprint calculators as feedback tools by identifying the most important features needed to accurately predict the Material Footprint of their users. The article shows that only few items are needed to predict the Material Footprint accurately. This way, online and mobile applications can be developed more concisely and thus more effectively. Feedback can be given more quickly and easier for the users of footprint calculators.
1. Introduction
Meeting the resource demand of a growing global consumer class increasingly affects the environment and places a burden on climate and ecosystems (IRP, Citation2017). While the Total Material Consumption (TMC) per capita per year has reached an average of 40 to 50 tonnes for the majority of industrialised nations (Bringezu et al., Citation2009), Lettenmeier, Liedtke, and Rohn (Citation2014) and Lettenmeier (Citation2018) have suggested a sustainable level of only an eight-tonne Material Footprint (per person per year). This means a reduction by a factor of five, which in turn requires appropriate consumer and producer policies, and education about sustainable production and consumption patterns.
Germany published its first sustainability strategy in 2002 and since then has reported various indicators for measuring the development of sustainability in Germany, including resource efficiency. The latest update from 2016 adopted the framework of the UN Sustainable Development Goals (SDGs) (German Federal Government, Citation2016), which the United Nations introduced in 2015 (UN, Citation2015). In this respect, the indicator framework for the Sustainable Development Goals (SDGs) suggests using per-capita Material Footprints to measure the sustainable management and efficient use of natural resources for Goal 12. SDG indicators are generally supposed to disaggregate populations according to income, age, sex, race, ethnicity or other characteristics (UN, Citation2017). However, only indicators based on microdata allow differentiated conclusions to be drawn from individual or household characteristics.
Germany has implemented a National Programme for Sustainable Consumption, the goal of which is to identify the relevant actions: behavioural changes in favour of more resource-efficient consumption are still hampered by obstacles such as a lack of information and personalised feedback applications. The programme suggests providing such information by the use of assisting carbon and resource calculators (BMU Citation2017). Such footprint calculators are included in Green Information Systems (Green IS), which have emerged in online and mobile applications during the last decade to assist users in adopting green behaviour; research has been paying more attention to how users stay motivated to use them (Lin, Citation2017). The Wuppertal Institute provides an online resource calculator that enables consumers to examine their consumption patterns by calculating their own Material Footprint.
The aim of this paper is to contribute to the improvement of footprint calculators as Green IS and feedback tools for their users by identifying the most important user characteristics needed to accurately predict the Material Footprint of their users.
Research on survey methodology suggests that the length of the survey is crucial for the response rate and data quality of web surveys. Longer surveys are more likely to yield higher dropout rates and lower data quality due to survey fatigue and satisficing. Galesic and Bosnjak (Citation2009) found that longer surveys result in lower response rates and higher dropout rates. They also found that the longer the survey, the lower the quality and variability of responses, resulting in more uniform responses at the end of the survey. Both Cape (Citation2010) and Rathod and LaBruna (Citation2005) concluded that shorter surveys ensure data quality by more responsive and motivated respondents. They determined a critical threshold in online surveys at around 20 min, after which fatigue becomes significantly more pronounced. Moreover, they found that respondents may look for ways to shorten their survey time and, if possible, are more likely to skip whole survey parts at the end of the survey. More recently, Revilla and Ochoa (Citation2017) determined an ideal web survey duration of 10 min and a maximum duration of a web survey of 20 min.
In this respect, the aim of the article is to provide a short, concise and accurate model to predict the Material Footprint of people by means of statistical learning on the basis of data from the Wuppertal Institute’s resource calculator. As a result, the Material Footprint model could then be used to improve online or mobile feedback tools that only need to mine the most important information relevant to the Material Footprint of its users.
The following section introduces the data of the resource calculator and methods of Material Footprinting and statistical learning in order to identify the optimal Material Footprint model in Section 2. The results on the performance and accuracy of the model are presented in Section 3. Section 4 discusses the findings and draws conclusions on how to improve footprint calculators.
2. Data and methods
2.1. Data
The Material Footprint is calculated on the basis of the life cycle material input of all goods and services used by a household (for a more extensive description of the method, see Schmidt-Bleek, Citation2009, Lettenmeier, Rohn, Liedtke, & Schmidt-Bleek, Citation2009; Liedtke et al., Citation2014; Wiesen, Saurat, & Lettenmeier, Citation2014 or Teubler, Buhl, Lettenmeier, Greiff, & Liedtke, Citation2018). Natural resource categories are equivalent to the Total Material Requirement (TMR), including abiotic and biotic material resources (including their unused extraction), and erosion in agriculture and forestry, which is usually used in national, comparative, macro studies (see Bringezu et al., Citation2009). The calculation procedures used here, however, are based on life cycle material flow calculations of products and individual activities (see Greiff, Teubler, Baedeker, Liedtke, & Rohn, Citation2017). As such, they enable a more differentiated and comprehensive picture to be gained of the natural resource use of private households. Material resource use by households includes any natural material resources required for (1) the production and use of materials (including materials for energy production and use as well as transport), products and services for private consumption; (2) any other activities performed by or covering household needs; (3) the disposal of those materials and products.
In this study, private consumption has been divided into the following domains:
Nutrition, including diets, food waste and all foodstuffs and drinks consumed;
Construction and housing, including the use of energy (electricity and heating) for household purposes;
Consumer goods, including clothes, furniture, household appliances such as refrigerators and washing machines, and consumer electronics such as TV sets and tablets;
Mobility, including everyday transport such as commuting and leisure activities by car, motorcycle, bicycle and public transport;
Leisure activities, including hobbies such as sports and cultural activities;
Vacations, including travel and accommodation.
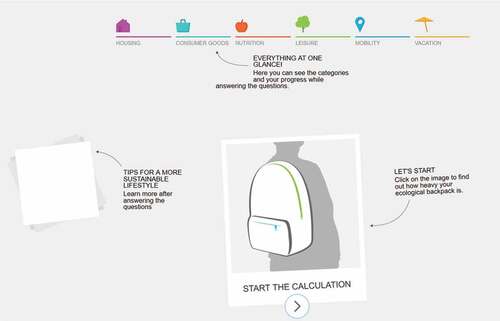
The Material Footprint calculator, including all questions and items, can be accessed in full at: www.ressourcen-rechner.de/?lang=en. Figure shows the landing page of the resource calculator with its six domains. The questionnaire is also provided as supplementary material to the article.
Figure 1. Screenshot of the resource calculator landing page
The web application also mines anonymised information on users’ socioeconomic and socio-psychological characteristics. Socioeconomic information includes sex, age, years of schooling according to the International Standard Classification of Education (ISCED) and social status based on occupational status. Household characteristics include information on household size, the number of children living in the household, the total living area and the size of the community. Subjective assessments and norms include relative household income (household income compared with peers and friends), subjective health (how healthy the respondent feels), social relations (the frequency of satisfying social ties with family and friends), the Willingness to Pay for environmentally products and subjective well-being.
The application was advertised on the Wuppertal Institute website, by independent online blogs on sustainable living, and in reviews of economic and product testing magazines. The application can be used for free, there are no incentives involved, and participation is voluntary. A total of 68,485 households participated in the survey between its launch on 25 February 2015 and 19 December 2017. Eighty-nine percent of the users were resident in Germany or did not name a country. After preparing the data and removing invalid and implausible responses, the information provided by 67,800 users was analysed. The differing number of observations between single variables is due to implausible responses and missing data due to non-response. We censored the data on Material Footprints and lifestyle (trips, days on vacations and hours spent on hobbies) as well as on age, size of residence and number of children in the household at the 99th percentile. In other words, the highest 1% of observations of the distribution of selected variables is excluded in order to cope with outliers and implausible responses.
Table provides an overview of the Material Footprints of users and a selection of personal and household characteristics as well as subjective assessments (here, the Willingness to Pay (WTP) for environmentally friendly products).
Table 1. Descriptive statistics of the material footprint and selected characteristics of users
As Table also shows, the number of responses regarding socioeconomic items and subjective assessments drops significantly compared to responses to items relevant for the calculations of their Material Footprint. For one thing, responses fell because some items were introduced after the launch of the calculator. Moreover, respondents were able to take a shortcut and skip to the page where the calculations of their Material Footprint were presented before responding to socioeconomic and psychological items.
As a result, the total average Material Footprint is 26 tonnes per person. In comparison, findings from a recent representative analysis of the Material Footprint of private households in North Rhine-Westphalia, Germany’s most populated federal state, reported an average Material Footprint of between 30,992 kg and 31,721 kg in 2013 ( <0.05), which is up to 23% higher than represented in our sample (Buhl, Teubler, Liedtke, & Stadler, Citation2017a). This may come about as a result of sample bias towards more users with more pro-environmental behaviour, as indicated by their willingness to pay higher prices for greener products. Furthermore, the sample may over-represent young, female and higher educated participants in Germany (Buhl Citation2017b).
2.2. Methods
Data from the Resource Calculator to train an optimal Material Footprint model is used. The most important characteristics to optimally predict the Material Footprint are identified. An optimal model fits best in terms of accuracy and generalisability. An accurate model exhibits a low prediction error. However, an overfitted model is unlikely to generalise from the underlying data. In order to take into account both aspects, accuracy and generalisability, supervised regression learning with repeated cross-validation is conducted. A model which most accurately predicts the Material Footprint of users by selecting predictors backwards is identified in three steps. (1) The main footprint domains which explained most of the overall Material Footprint in terms of low prediction error, and high prediction accuracy are identified. (2) The predictors of the most important footprint domains which best explained the overall Material Footprint in terms of low prediction error and high accuracy are selected. (3) The predictors which best described the overall Material Footprint in terms of high statistical significance are selected.
The variable of importance is measured in terms of how the predictors contribute to a lower prediction error (lower (rooted) MSE), enhance the accuracy of the prediction (higher adjusted ) and are statistically significant predictors (high
-stats, low
-values).
The mean standard error calculated the average deviance between predicted and observed outcomes of the
-th observation (EquationEquation 1
(1)
(1) ).
is commonly used as a measure to assess the accuracy of a prediction. Essentially,
shows the share of variance of the dependent variable that is explained by the independent variables that are used in the model. It does so by relating the residual sum of squares of the model to the total sum of squares (EquationEquation 2
(2)
(2) ). As the residual sum of squares decreases as the number of predictors introduced to the model increases,
is adjusted or penalised by the number of predictors introduced
. As such, the
does not favour overly complex models but encourages the identification of a model that scores high on accuracy by finding not a large, but an optimal number of predictors.
Note that the calculation of MSE derives from the residual sum of squares (RSS), such that a low prediction error () corresponds to high accuracy (
) of the prediction.
-statistics refer to the accuracy of single predictors. More precisely,
-statistics refer to commonly used
-tests in regression analysis which test whether or not predictors actually affect the outcome and are thus actually different than zero.
-tests rely on the standard errors of predictors (EquationEquation 3
(3)
(3) ). The lower the error of predictors, the higher the confidence that the estimated coefficient of predictor
is different than zero.
-statistics measure the number of standard deviations the predictor coefficient
is away from zero.
The -th coefficient estimate (
) is divided by its standard error
.
Thus, the higher the -statistic, the higher the probability that predictors will affect the outcome (
-value). Predictors are thus selected according to high
-stats and low
-values. Predictors with
-values <0.01 are selected. Predictors are only selected when the probability of a predictor actually not affecting the outcome (although it is assumed that it did) was lower than 1%.
In order to test for generalisability or overfitting, the data is randomly resampled into 10 subsamples, where each of the subsamples was used as training as well as test data. The cross-validation is repeated five times, such that each time different folds served as training or testing data. The predicted coefficients from the training data set were used to predict the Material Footprint in each testing or unseen data set. This resulted in estimates of the test mean squared error, also referred to as mean squared prediction error. For a ranked set sampling and non-parametric kernel density estimations, see Mahdizadeh and Zamanzade (Citation2016) as well as Zamanzade and Vock (Citation2015) applying a cross-validation of the kernel bandwidth selection.
Cross-validation () was undertaken to average the test mean squared errors (EquationEquation 4
(4)
(4) ).
By doing this, the characteristics which predicted the users’ Material Footprint accurately are revealed, even in light of new data.
A generalised linear regression model (GLM) with identity link and Gaussian error (i.e., multiple linear regression) and multivariate adaptive regression splines are fitted (MARS) in order to cope with non-linear relationships between predictors and outcome. First, the Material Footprint by estimating the coefficients of predictors
using a normal linear model with error
is predicted, as expressed in EquationEquation 5
(5)
(5) .
Predictors should describe the overall Material Footprint linearly. For instance, the further the distance travelled by car, the bigger the overall Material Footprint. However, non-linear relationships may play a role when predicting the Material Footprint by a high-dimensional set of predictors. This is why more flexible or adaptive regression splines are subsequently introduced to the linear fit. MARS can be seen as an extension of linear predictions that finds knots where one linear function between predictor and outcome is replaced by another linear relation in order to minimise the RSS. Therefore, knots for each predictor or input
at each observed value
were identified as the basis or
hinge functions
. Similar to a stepwise regression technique, where all inputs are introduced to the model step by step, the hinge functions are introduced into the model. This thus meant estimating
via MARS following EquationEquation 6
(6)
(6) .
In this way, MARS introduced hinge functions of predictors into the model instead of the predictors themselves in order to apply knots and combine linear forms. The hinge functions are a collection of those hinge functions (EquationEquation 7
(7)
(7) ).
The index indicates that only positive parts are calculated (otherwise 0), resulting in reflected pairs of functions at each knot and those hinge functions
Hinge functions were identified and selected for the final model, having the largest decrease in prediction error in terms of RSS (see Hastie, Tibshirani, & Friedman, Citation2008, 321ff). In order to avoid overfitting, a backward deletion procedure was applied in which those terms that caused the smallest increase in RSS were removed.
MARS models are more flexible than linear models. At the same time, MARS models still tend to have a good bias-variance trade-off. The key to the performance of statistical learning is to decrease the bias by assuming stricter or more generalising functional forms. In contrast, statistical learners which fit well to the training data are prone to overfitting, and as such may result in a higher test prediction error. Therefore, statistical learners require low variance as well as low bias for low prediction errors in terms of MSE. MARS tend to demonstrate such good bias-variance trade-offs by extending the linear functions with linear splines.
3. Results
For a descriptive and bivariate analysis of an earlier version of the data see Buhl, Liedtke, Teubler, Bienge, and Schmidt (Citation2018). They show for instance that higher income implies higher Material Footprints, but higher Material Footprints do not imply higher subjective well-being (the latter more detailed in Buhl et al. Citation2017b).
In the first step, the Material Footprint according to its partial footprints, ranging from housing to holiday making is predicted. Figure shows the partial footprints by decile. Decile 1 represents 10% of users with the smallest overall Material Footprint. Decile 10 represents 10% of the users with the biggest overall Material Footprint. Mobility, housing and nutrition constitute the largest footprints across all deciles. While the Material Footprints for housing and nutrition do not differ relevantly between deciles, the Material Footprint for mobility significantly increases with each increasing decile. The Material Footprint for mobility seems to better differentiate users than housing or nutrition.
Figure 2. Material footprint by deciles
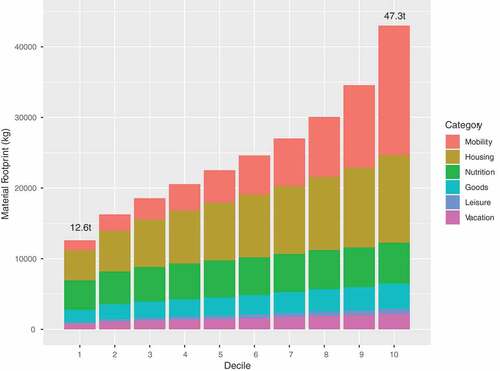
Predicting the overall Material Footprint by a linear function of mobility, housing and nutrition corroborate the finding from Figure : mobility, housing and nutrition explain 91% of the overall Material Footprint.
Based on these results, in the second step, the overall Material Footprint by its features measuring mobility, housing and nutrition plus socioeconomic and relevant socio-psychological variables is predicted (see the supplementary material for a full list of predictors and the full questionnaire). To do so, predictors were standardised and categorical predictors were set to full rank dummies with a reference category. The average variable importance was scaled to a maximum of 100. In other words, the importance of each variable was calculated in relation to the most important variable, which was set at 100. The graph below shows the variable importance of the -th predictor. Ninety-five predictors were entered into the search in total. Figure shows a steep decrease in variable importance between the first five and the top 25 most important features. Afterwards, another drop in importance occurs, suggesting that no more than 25 predictors should be selected for the Material Footprint model.
Figure 3. Variable importance by the number of predictors
The MARS model only selected 10 out of the 95 predictors, leaving out the predictors with an importance of less than 20%. For the linear model (GLM), predictors with an importance of less than 10% in relation to the most important variable were not selected for the final model. Only those characteristics that were statistically significant at the 1% level were selected (i.e. in the third selection step). The results of the variable importance and the accuracy of the predictions are shown in Table .
Table 2. Variable importance of predictors and performance of linear and non-linear predictions
For all three models, the top three predictors were trips by local train, trips by car and the number of persons in the household. The linear as well as non-linear models selected the same predictors as most important. These are from the mobility and housing components (energy source for electricity) and the sociodemographic characteristics of the household. This corroborates the findings from Figure , showing that mobility differentiates users best and thus contributes best to reducing prediction error and increasing prediction accuracy.
The of the linear models suggests that the linear fit consisting of 22 characteristics accounts for almost three-quarters (74%) of the variance in Material Footprints. Even the MARS, consisting of only 10 predictors out of 95 covered 61%. The 10 most important variables selected by linear as well as non-linear predictions are shown below. They are the same predictors selected by MARS. Figure shows the top 10 most important predictors.
Figure 4. Top 10 most important predictors of the material footprint
The next 13 variables introduced to the linear fit only accounted for a 13% increase in prediction performance. However, we considered a Material Footprint with prediction accuracy of 74% a more comprehensive, but still concise model. This model consisted of predictors from mobility as well as from housing and nutrition.
4. Discussion
The average Material Footprint of resource calculator users was 26 tonnes and thus lower than comparable Material Footprint calculations based on representative data for Germany. These results may have been generated from a sample of users of the resource calculator who exhibit behaviour that is more environmentally friendly. Moreover, the overall Material Footprint of users may be biased by predictors that may significantly contribute to resource use, but are not yet covered by the tool. Other relevant characteristics such as heating energy are covered by the tool but were not selected by the learning algorithm. For instance, heating energy is relevant to the Material Footprint; however, respondents do not usually know their specific usage; this leads to high levels of non-response. Instead, respondents choose to pick from three pre-given categories (low, moderate and high), which results in the low variance of the predictor. As such, heating energy does not differentiate users very well, and thus does not perform well; as a consequence, the algorithm does not select it. Future improvements of footprint calculators should consider items that better account for each predictor’s variability, e.g., continuous scales. Additionally, the life cycle assessment (LCA) of products and services covered by the calculator may also be subject to improvement and thus bias the results.
5. Conclusion
The aim of this paper was to contribute to the improvement of footprint calculators as Green IS and feedback tools by revealing the most important user characteristics needed to accurately predict the Material Footprint of their users. In this regard, the presented approach provides a reliable calculation of Material Footprints based on LCAs for its users.
By means of statistical learning, the most important variables predicting the variance in Material Footprints are accurately identified. The results showed that the Material Footprint can be predicted by characteristics concerning mobility, housing and nutrition by more than 90%. Within those three domains, the Material Footprint can be predicted most accurately by looking at trips by (local) train and car, as well as flight travel, the number of household cars, the age of the car(s) and the energy source for electricity, as well as two sociodemographic characteristics—the size of dwelling and household size (61% prediction accuracy). The number of household members who use the car, the number of car passengers, heating energy, meat and milk consumption, travel by car and train, and luxurious hotels further contribute to the prediction performance of the Material Footprint. Those features account for 74% of the variance of Material Footprints.
The findings suggest that feedback tools which introduce the Material Footprint model should contain the 22 most important characteristics from mobility, housing and nutrition. The presented research thus shows that only a short instrument consisting of a feasible number of predictors is needed to accurately reveal the personal, overall Material Footprint in footprint calculators. Additionally, specialised footprint calculators may be able to address and disaggregate certain domains such as leisure or vacations that are not covered by the short instrument for the prediction of the overall Material Footprint.
High-quality data rely on concise tools with high usability without provoking fatigue and satisficing response behaviour. The short Material Footprint tools may help developers and researchers to address issues of sustainable behaviour by linking the Material Footprint model with additional socioeconomic or socio-psychological items. Enhancing footprint calculators by those items may help developers to differentiate the feedback between consumer groups and may help researchers to gain a better understanding of behavioural motivations.
Moreover, enhanced Material Footprint calculations differentiating between population groups would better meet the requirements of the indicator framework for the Sustainable Development Goals (SDGs). The framework has noted that indicators should be disaggregated, where relevant, by income, sex, age, race, or other characteristics. Therefore, survey-based indicators should complement the as yet macro-based footprint indicators in the SDG indicator framework.
Cover Image
Source: Author.
Additional information
Funding
Notes on contributors
Johannes Buhl
The research division Sustainable Production and Consumption at the Wuppertal Institute for Climate, Environment and Energy focuses on sustainable resource assessment and management. The authors conduct resource assessments of companies, value chains, households and lifestyles (material and carbon footprint, water consumption, land use). This way, they support the change management in companies and households in order to enable more sustainable product and consumption systems.
References
- Bringezu, S., Schütz, H., Saurat, M., Moll, S., Acosta-Fernández, J., & Steger, S. (2009). Europe’s resource use. basic trends, global and sectoral patterns and environmental and socioeconomic impacts. In S. Bringezu & R. Bleischwitz (Eds.), Sustainable resource management. global trends, visions and policies (pp. 52–14). Sheffield, UK: Greenleaf.
- Buhl, J., Liedtke, C., & Bienge, K. (2017b). How much environment do humans need? Evidence from an integrated online user application linking natural resource use and subjective well-being in Germany. Resources, 6(4), 67. doi:10.3390/resources6040067
- Buhl, J., Liedtke, C., Teubler, J., Bienge, K., & Schmidt, N. (2018). Measure or management?—Resource use indicators for policymakers based on microdata by households. Sustainability, 10(12), 4467. doi:10.3390/su10124467
- Buhl, J., Teubler, J., Liedtke, C., & Stadler, K. (2017a). The resource use of private households in North Rhine-Westphalia, Germany. Uwf UmweltWirtschaftsForum Sustain. Management Forum, 25, 255–264.
- Cape, P. (2010). Questionnaire length, fatigue effects and response quality revisited. Survey Sampling International, 111.
- Galesic, M., & Bosnjak, M. (2009). Effects of questionnaire length on participation and indicators of response quality in a web survey. Public Opinion Quarterly, 73(2), 349–360. doi:10.1093/poq/nfp031
- German Federal Government. (2016). Die Deutsche Nachhaltigkeitsstrategie 2016 – Der Weg in eine enkelgerechte Zukunft. Germany: Frankfurt am Main.
- German Federal Ministry for the Environment, Nature Conservation and Nuclear Safety (BMU). (2017). Nationales Programm für nachhaltigen Konsum. Gesellschaftlicher Wandel durch einen nachhaltigen Lebensstil. Retrieved from http://www.bmu.de/fileadmin/Daten_BMU/Pools/Broschueren/nachhaltiger_konsum_broschuere_bf.pdf
- Greiff, K., Teubler, J., Baedeker, C., Liedtke, C., & Rohn, H. (2017). Material and carbon footprint of household activities. In D. V. Keyson, O. Guerra-Santin, & D. Lockton (Eds.), Living labs: Design and assessment of sustainable living (pp. 259–275). Cham: Springer International Publishing.
- Hastie, T., Tibshirani, R., & Friedman, J. (2008). The elements of statistical learning. New York, NY: Springer series in statistics.
- IRP. (2017). Assessing global resource use: A systems approach to resource efficiency and pollution reduction. Bringezu, S., Ramaswami, A., Schandl, H., O’Brien, M., Pelton, R., Acquatella, J., Ayuk, E., Chiu, A., Flanegin, R., Fry, J., Giljum, S., Hashimoto, S., Hellweg, S., Hosking, K., Hu, Y., Lenzen, M., Lieber, M., Lutter, S., Miatto, A., Singh Nagpure, A., Obersteiner, M., van Oers, L., Pfister, S., Pichler, P., Russell, A., Spini, L., Tanikawa, H., van der Voet, E., Weisz, H., West, J., Wiijkman, A., Zhu, B., Zivy, R. Nairobi, Kenya: A Report of the International Resource Panel. United Nations Environment Programme.
- Lettenmeier, M. (2018). A sustainable level of material footprint — Benchmark for designing one-planet lifestyles. Materiaalijalanjäljen kestävä taso –mittapuu yhden planeetan elämäntapojen toteuttamiseen Aalto University, Helsinki.
- Lettenmeier, M., Liedtke, C., & Rohn, H. (2014). Eight tons of material footprint – suggestion for a resource cap for household consumption in Finland. Resources, 3, 488–515. doi:10.3390/resources3030488
- Lettenmeier, M., Rohn, H., Liedtke, C., & Schmidt-Bleek, F. (2009). Resource productivity in 7 steps; Wuppertal Spezial 41. Wuppertal, Germany: Wuppertal Institute for Climate, Environment and Energy. Retrieved from http://epub.wupperinst.org/files/3384/WS41.pdf
- Liedtke, C., Bienge, K., Wiesen, K., Teubler, J., Greiff, K., Lettenmeier, M., & Rohn, H. (2014). Resource use in the production and consumption system—The MIPS approach. Resources, 3, 544–574. doi:10.3390/resources3030544
- Lin, S. M. (2017). Identify predictors of university students’ continuance intention to use online carbon footprint calculator. Behaviour & Information Technology, 36(3), 294–311. doi:10.1080/0144929X.2016.1232751
- Mahdizadeh, M., & Zamanzade, E. (2016). Kernel-based estimation of P(X > Y) in ranked set sampling. SORT-Statistics and Operations Research Transactions, 1(2), 243–266.
- Rathod, S., & LaBruna, A. (2005). Questionnaire length and fatigue effects-does size really matter? In ESOMAR, Conference on Panel Research, Budapest.
- Revilla, M., & Ochoa, C. (2017). Ideal and maximum length for a web survey. International Journal of Market Research, 59(5), 557–565.
- Schmidt-Bleek, F. (2009). The Earth: Natural resources and human intervention. London: Haus Publishing.
- Teubler, J., Buhl, J., Lettenmeier, M., Greiff, K., & Liedtke, C. (2018). A household’s burden–The embodied resource use of household equipment in Germany. Ecological Economics, 146, 96–105. doi:10.1016/j.ecolecon.2017.10.004
- UN (2015). Transforming our world: The 2030 Agenda for sustainable development, 2015. Retrieved from https://sustainabledevelopment.un.org/content/documents/21252030%20Agenda%20for%20Sustainable%20Development%20web.pdf
- UN (2017, July 6). General assembly resolution 71/313, work of the statistical commission pertaining to the 2030 agenda for sustainable development (A/RES/71/313). Retrieved from http://undocs.org/A/RES/71/313.
- Wiesen, K., Saurat, M., & Lettenmeier, M. (2014). Calculating the material input per service unit using the ecoinvent database. The International Journal of Performance Engineering, 10, 357–366.
- Zamanzade, E., & Vock, M. (2015). Variance estimation in ranked set sampling using a concomitant variable. Statistics and Probability Letter, 105, 1–5. doi:10.1016/j.spl.2015.04.034