
 ?Mathematical formulae have been encoded as MathML and are displayed in this HTML version using MathJax in order to improve their display. Uncheck the box to turn MathJax off. This feature requires Javascript. Click on a formula to zoom.
Abstract
Elevated levels of contaminants in surface and ground water pose serious and adverse health challenges in the twenty-first century. It is imperative that the quality of life of people without safe drinking water is improved by providing safe, clean and affordable water using appropriate purification technology. Natural clay and rice husk-Na2CO3 modified clay were used to produce expanded clay aggregates adsorbents. Characterizations were done using SEM, XRD, XPS and BET to reveal their salient features. Filtration studies were carried out to ascertain the disinfection assay of E. Coli and removal efficiencies of nitrate and phosphate. Batch adsorption experiments were employed to determine the effect of pH, contact time and adsorbent dosage for effective removal of Arsenic (III) and lead (II) including isotherm models. Aluminosilicates and associated minerals with high surface areas between 456.143–566.998 m2/g and significant adsorption sites were revealed. Log four bacteria disinfection assay was achieved. Reduction efficiencies for phosphate and nitrate for all adsorbents varied from 27.33% to 76% and 10.67% to 46% respectively. High correlation coefficients made Langmuir isotherm model more favourable than Freundlich model. The adsorption capacities for both lead and arsenic were high and reaction was fast, making the adsorbents suitable for water remediation applications.
PUBLIC INTEREST STATEMENT
Most poor and vulnerable people such as the peri-urban and internally displaced people (IDPs) are prone to water-borne diseases because they drink polluted water. In order to improve water sanitation and hygiene (WASH) and to help achieve sustainable development goal (SDGs) six, a novel nano-adsorbent material, Expanded Clay Aggregates produced from clay and biomass were developed. The adsorbents are capable of multi-filtration of known pollutants. The ability of the material to remove contaminants is based on the fact that they are processed to nano-scale, thereby offering larger surface area and other novel properties required for filtration. The research has contributed towards finding a sustainable solution to the problem of inability of majority of Nigerians and other Africans to have sustainable access to potable, safe and affordable drinking water. The research outcome has high potential for commercialization, leading to mass production of water filters.
1. Introduction
The need for safe clean drinking water cannot be overemphasized as it is obvious that there is global water stress despite the efforts of relevant agencies (donor agencies inclusive), organizations (including non-governmental organizations (NGO)) and other stakeholders. The earth is covered by 71% water out of which only 2.5% is fresh water (Shiklomanov, Citation1993). Fresh water sources from surface water, dams, rivers, streams, ponds, canals and lakes, are only 0.3% while 98.8% is ice and ground water, leaving the remaining in biological bodies (Khyade & Swaminathan, Citation2016). These water sources are usually contaminated with chemicals, heavy metals, pathogens, microbes, and other toxicology contaminants resulting from mining, industrial effluents, municipal sewage, septic tanks, flawed sanitation system, latrines, animal feces and agricultural activities.
Clean drinking water is a scarce commodity as world population continues to grow and it is estimated to grow to 9.8 billion by 2050 and 11.2 billion by 2100 (UN United Nations, Citation2017). Such population growth will be concentrated in nine countries including Nigeria according to the report. Proactive measures to address Sustainable Development Goal (SDG) number six, i.e., “to ensure availability and sustainable management of water and sanitation for all” are salient. Global report shows that about 2.1 billion and 4.5 billion lack access to safe water and safety managed sanitation respectively (WHO/UNICEF, Citation2017). About 844 million lack basic drinking water sources whereas 159 million drink untreated water from surface water sources. Estimation shows that about 801,000 children below age 5, mostly rural dwellers, die every day due to gastrointestinal infection popularly known as diarrhea. This contributes 11% out of 7.6 million deaths among children (Liu et al., Citation2012).
Lack of clean water for sanitation and safe drinking water is estimated to have caused 88% of these deaths from diarrhea (Prüss-Üstün et al., Citation2008). In 1998, about 2.2 million people under age 5 died of diarrhea infection, 8.5% and 7.7% were from Southeast Asia and Africa respectively (WHO/UNICEF, Citation2001). World health Organisation’s report on World Water Day 2020 says that diarrhea deaths are common among infants, young children, malnourished people and those with impaired immunity (WHO, Citation2020). Other waterborne diseases such as cholera, dysentery, hepatitis A, typhoid, Trachoma, schistosomiasis and guinea worm are also major contributors to deaths among children (WHO, Citation2009, Hotez et al., Citation2006; WHO, Citation2016).
Common contaminants found in drinking water may lead to chronic health effects like cancer, liver, bladder, cardiovascular and kidney problems. These contaminants are grouped into microbial, organic and inorganic, disinfectants, disinfection by-products (DPBs) and heavy metal contaminants. Microbes with minute infectious doses (e.g., Giardia, Cryptosporidium, and Shigella species; hepatitis A virus; enteric viruses; and enterohemorrhagic Escherichia coli) may cause illnesses no matter how little is swallowed (Backer, Citation2002). This is because total immunity does not develop for most enteric pathogens which may induce a re-infection. Incidences of water-borne disease outbreak are traceable to microbial pollutants. Excess inorganic contaminants such as nitrate and phosphate in surface and ground water and shallow wells are usually from inorganic nitrogenous fertilizers used for agricultural purposes, erosion, industrial discharge, natural decomposition of rocks and minerals, food preservatives, and oxidation of nitrogenous waste product from mammal’s excreta. They are found mainly in aerobic conditions in aquifer especially when there are no growing plants around to take up some for denitrification which depends on temperature and pH in case of surface water. Concentration in surface water for nitrate usually is low (0–18 mg/l) but increases above 50 mg/l up to hundreds of thousands due to agricultural runoff and environmental waste at the onset of rainfall (World, H. O, Citation2011). Excess nitrate, above 10 mg/l (U.S. EPA standard) in water causes methemoglobinemia, cancer and metabolic problems (Knobeloch et al., Citation2000; U.S.EPA., Citation2011; USEPA, Citation2017; World, H. O, Citation2011). Whereas 0.08–0.10 mg/l level of phosphate can trigger algae bloom in surface water, 0.5 mg/l may speed up eutrophication and is considered unsafe for drinking water (Fadiran et al., Citation2008; Fried et al., Citation2003).
Toxic metals in drinking water even at low concentrations such as Lead and Arsenic have been linked to incidences of cancer, cardiovascular diseases, hypertension and kidney problems. Municipal water treatment plants involve removal of undissolved substances, dissolved substances and harmful microbes. Sand filtration is very popular among the Nigerian water purification technologies which only remove un-dissolved material, while chlorination and ozonation are employed to kill harmful microbes and most times form Disinfection Bye-Products (DBPs). Prior to filtration; coagulants such as aluminum sulphate are added for sedimentation and flocculation purposes. DBPs are the TriHaloMethanes (THMs), trichloroacetone (CCl3COCH3), chloroamines, chlorophenols and other halogenated intermediate compounds have direct health hazard relationship (The National Academics, Citation1980).
A novel approach that combines disinfection and filtration using Expanded Clay Aggregate (ECA) was developed to eliminate these filtration steps and formation of DBPs. Many researchers have reported new technologies on water treatment but not much can be found in literature on the use of ECA application in surface water treatment especially biomass-modified ECAs. Some of the reviewed literature center attention on the use of Light Expanded Clay Aggregate (LECA) and ECA in the adsorption of phosphorous in wastewater (). This manuscript presents the results of development of ECA adsorbents, filtration of natural water for bacteria, phosphate and nitrate experiments, including adsorption experiments of lead and arsenic.
Table 1. Review of the usage of Expanded Clay Aggregate in Water Purification
2. Methodology
2.1. Development of Expanded Clay Aggregate (ECA)
The raw clay samples for the aggregate were prepared and characterized in an earlier work reported (Ihekweme et al., Citation2020). The clay samples selected were from Kutigi and Minna. Rice husk was sourced from Kpakungu rice mill Minna, Niger State. It was washed with distilled water and dried in a Mimert oven. It was grated and sieved through sieve number 40 to get particle size of 425 µm and below. The following compositions were prepared (). The clay from Kutigi is non-plastic kaolin and therefore was mixed with Minna plastic clay and some portions were modified by addition of plasticizer (Na2CO3) to form a geopolymer composite.
Table 2. Mixture Design and Description
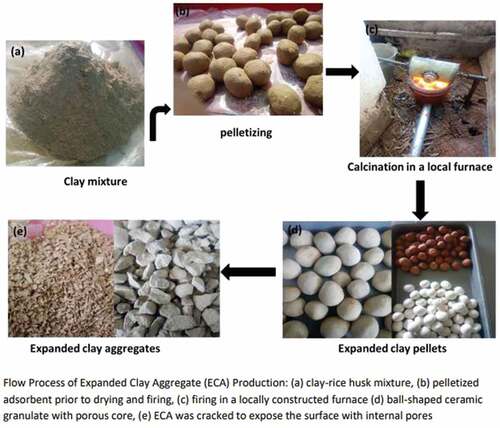
The flow process of production is presented in . Different mixture compositions according to were prepared (), pelletized () and dried. A local manually driven rotary furnace with thermocouple was constructed to utilize local content to get good results as there was no functional rotary furnace. It was fired by coal through a blower connected to a battery (). The temperature range attained was between 764°C and 809°C. There was rapid heat loss as soon as firing stopped. This was because the furnace was not lagged, so firing was withdrawn gradually in order to get more micro pores than coarse pores. Mixtures were calcined with stepwise temperature increment in a furnace for 6 hours to a maximum temperature within the earlier mentioned range. Rice husk and other organic matter burnt off when the temperature exceeded 430°C creating the pores needed for filtration.
Figure 1. Flow Process of Expanded Clay Production: (a) clay-rice husk mixture, (b) pelletized adsorbent prior to drying and firing, (c) firing in a locally constructed furnace (d) ball-shaped ceramic granulate with porous core, (e) ECA was cracked to expose the surface with internal pores
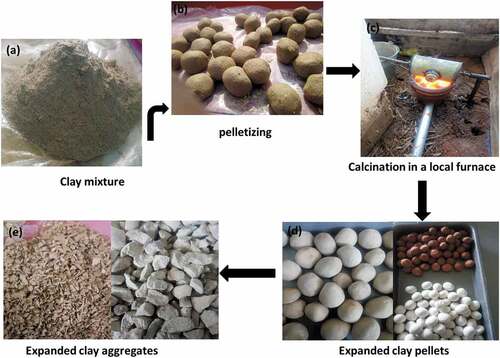
Samples were transferred to a muffle furnace (KSL-1500X) to attain the required temperatures of 1100°C and 1200°C for another 6 hours to produce the expanded clay adsorbents (). They were cracked () to expose the internal pores and stored in zip lock bags for experiments.
2.2. Characterization of ECA
The samples were characterized for morphology using Scanning Electron Microscope (SEM) (Model: Supra55VP-Carl Zeiss) with EDX attachment after being coated with gold nanoparticle to avoid charging. XRD was done by Rigatu Smartlab 9 kw unit with rotating anode at 45 Kv and 150 mA to determine their mineral contents. Patterns were recorded at 2θ and a wavelength of 1.54 Å. X-ray photoelectron spectroscopy (Model: Omicron Fulllab System; Made in Germany) was done to determine the chemical compositions of the aggregates. Surface area, pore volume and pore diameter were determined using BET methods (Quantachrome Instruments: version 11.03).
2.3. Pilot testing of ECA removal on different contaminants
2.3.1. Filter and ECA characteristics
The ECA was crushed and sieved through no 5 (4 mm), no 10 (2 mm) and no 18 (1 mm). Finely-grained particles below 1 mm were sieved out because of their possibility to prevent free flow of water. It was washed and rinsed several times with distilled water to remove dust. It was then soaked for 24 hours in sterile water to open up the pores. The basic parameters of the soaked water were examined before commencement of experiments. The bench-scale set up for filtration involved a glass filter column of length 1.0 m and column diameter of 0.2 m. The eight samples were set up in parallel and the experiments ran concurrently. The depth of filter bed is 0.7 m with grain size range of 2 mm to 4 mm which packed with size reduction down the column.
2.3.2. E. Coli experiments
The gram negative bacteria Escherichia coli (E.coli) disinfection efficiency was tested using the pour plate technique and serial dilution in real environmental water. 1 ml of raw contaminated water and filtered water were incubated at 35°C±2°C on petrifilms for 24 hours and the colony forming units (CFU/ml) were determined. Raw bacterial water was filtered 6 times using the same set up to initiate a cyclic experiment and test for reusability. Log reduction values (LRV) were calculated using equation 1.
Log Reduction = log 10 (1)
Where; Ni—is the colony-forming unit of the bacteria before filtration
N—is the colony-forming unit of the bacteria after filtration
2.3.3. Column experiments for nitrate and phosphate
De-nitrification and phosphate removal experiments were done following the set up in section 2.3.1 with fresh ECA. 1000 ml of standard anion mix with an initial concentration of 1.5 mg/l for both nitrate and phosphate was prepared. The pH was controlled using 1%HCl and 1%NaOH to 2 and also tested on increase level up to 12. All experiments were carried out at room temperature. 750 ml of the influent was run through the column containing each ECA sample after holding at different time intervals. The water head was maintained at 0.02 m on top of the ECA filter bed to allow even distribution of the influent. The filtrate was collected at 5, 10, 15, 25, 40, 60 and 120 minutes intervals and was analyzed using DX-120 Ion Chromatography. The flow rate was set at 1.2 ml per minute and the duration of each analysis was approximately 10 minutes.
2.3.4. Batch adsorption experiments
For adsorption of heavy metal experiments, synthetic solutions of Arsenic (As) and Lead (Pb) were prepared by dissolving 1.32 g of Arsenic (III) oxide (ASO3) in 20 ml of 2 M solution NaOH and while lead standard solution was prepared by dissolving appropriate amount of Pb(NO3)2 and made up with deionized water to stock solutions of 1000 mg/l of metal ions. 100 mg of adsorbents were added to solution containing 1–120 mg/l of Pb (II) and 1–100 mg/l of As (III) for the equilibrium adsorption experiments. pH was adjusted with 1% hydrochloric acid or 1% NaOH to 5.0. Mass of 0.1 g of each sample of adsorbent was added to 100 ml of each of the prepared solution and was shaken at 150 rpm for 12 hours at 25°C. The concentrations were determined by atomic adsorption spectrometry (nov AA 350; Made in Germany) to ascertain the amount of adsorbed As (III) and Pb (II) at time intervals.
Isotherm adsorption data were obtained which were fitted by both Langmuir and Freundlich isotherm models (Luo et al., Citation2015) represented in Equationequations 2(2)
(2) and Equation3
(3)
(3) respectively;
Where Ce is the equilibrium concentration (mg/l) and Qeq is the adsorptive capacity at equilibrium (mg/g). KL (l/mg) and Qmax (mg/g) are the Langmuir parameters; KL is the binding constant, and Qmax is the maximum adsorptive capacity (mg/g); Kf (mg1-(1/n) L1/ng-1) and n are the Freundlich parameters; Kf is the adsorption capacity and n is the adsorption intensity.
100 mg each of the adsorbent was added to fresh solutions with concentrations of 18.6 mg/l for Pb (II) and 12.5 mg/l for As (III) and shaken for 30 minutes at 25°C. Regeneration was done adopting the procedure used by (Zhang et al., Citation2015) with 0.01 M Na2 EDTA for lead and 0.1 M NaOH for arsenic for five cycles. Effects of experimental parameters such as pH, dosage and contact time were studied by keeping others constant and varying one. pH effect was varied between 2 and 8, dosage effect ranges from 0.2 g/100 ml to 2 g/100 ml and adsorption kinetics was evaluated between 1 and 120 mins. The specific quantity adsorbed, Q (mg/g), and adsorption efficiency (R%) were calculated using the Equationequations 4(4)
(4) and Equation5
(5)
(5) respectively (Gaur et al., Citation2018);
Where V (ml) is the volume of solution used, Ci (mg/l) is the initial concentration; Ce (mg/l) is the equilibrium concentration and W(g) is the amount of adsorbent.
3. Results and discussions
3.1. Morphology, mineralogy and BET characteristics of ECA
When crushed, SEM examination of ECA revealed that there is interconnected honeycomb-like cavities () and intergranular connected pores of different shapes and sizes. The differences are not far-fetched as they are additive and temperature dependent. Images of GI-1 and GI-2 () show staked structure with inter-connected edges. This implies that the calcination temperatures do not present any visible changes in the morphology of the two samples. GI-3 and GI-8 () possessed fibrous aggregate which appear long and slender, however the pores for GI-3 are not as much when compared to GI-8 sample. This means that they are temperature dependent as more pores were created as the temperature increased from 1100°C to 1200°C. Interconnected pores were observed for GI-4 and GI-5 (). The addition of rice husk created these connections as they burnt off during calcination and it was further confirmed from BET analysis () as these set contained more pore volume than other samples. The structure of GI-6 and GI-7 changed from stacked sheets () to flakes characterized by irregularly distributed pores and shapes () due to the addition of rice husk.
Figure 2. Surface image of ECA particle under a scanning electron microscope (SEM) showing cavities; (a) GI-1 exposes the stack sheet structure of kaolin; (b) GI-2; stack sheet morphology (c) GI-3—showing long, slender and fibrous aggregate of sillimanite and hexagonal flakes; (d) GI-4—mixed surfaces of sheet platelets and hexagonal flakes; (e) GI-5—mixed surfaces of sheet platelets and hexagonal flakes; (f) GI-6—multi-porous well defined flakes; (g) GI-7 multi-porous well defined flakes with more connected pores-; (h) GI-8—possess long, slender and fibrous aggregates of sillimanite with more pores than GI-3
Table 3. Surface area/pore analysis of the ECAs
Mineral reflections of XRD examination () are presented below. Kaolinite composite reflected strong peaks for Cassiterite (a tin oxide mineral) for both GI-1 and GI-2 () which was also concentrated in high-temperature quartz veins as seen in GI-2 only. The EDX of these samples (not shown) though possessed high content (% weight) of silicon (52.89) and aluminium (53.51) respectively; it also recorded 3.44 for titanium (GI-1 only) and 2.31 for potassium. These results conform with the earlier report for Kutigi clay (Ihekweme et al., Citation2020) which had kaolin as the major mineral then. The present minerals can be attributed to high-temperature exposure and addition of Na2CO3. The predominant high-temperature silicate minerals for GI-3 are Sillimanite, quartz and mullite, however strong reflections were observed when calcined to 1200°C (GI-8) for Pentacalcium bis[dinitridocobaltate (1)] and Spessartine ().
Figure 3. XRD plots of ECA at 1100°C and 1200°C showing mineralogy. (a) 100% Kutigi clay; (b) 100% Minna; (c) 40% Kutigi+40% Minna + 20% rice husk; (d) 85% Kutigi + 15% rice husk
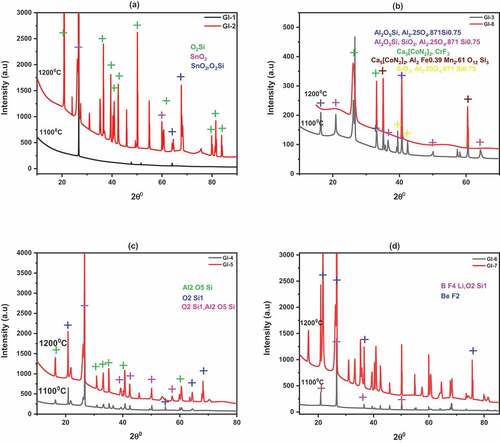
The mixture of the two clay minerals and rice husk () results in composite with major minerals of sillimanite and quartz and traces of beryllium fluoride (GI-5 only) which structurally resembles quartz. The BeF2 may have come from the addition of rice husk and formed at temperature above 1100°C. The minerals for GI-6 and GI-7 () were Bithium tetraflouride and quartz whereas BeF2 were observed at 1200°C which confirmed the suspicion of rice husk addition at elevated temperature.
The elemental compositions revealed by XPS showed high contents of O 1s and C 1s which could be attributed to the reasons mentioned earlier (Ihekweme et al., Citation2020) in their raw materials characterization. Other strong reflected elements were silicon, aluminium, fluorine, iron and calcium which are likely to exist in their oxides forms. Trace elements were lanthanides rare earth such as dysprosium and erbium, bismuth, silver and nickel. Chromium (Cr 2p) element was observed for GI-3 and GI-7 which also reflected by XRD as chromium fluoride.
The samples relatively have high surface area (). GI-7 has the highest surface area of 566.998 m2/g while GI-8 possessed the lowest with 456.143 m2/g. The pore volume ranges from 0.132 cc/g to 0.195 cc/g with GI-4 possessing the highest value as well as highest pore size of 2.853 nm.
shows excellent total dissolved solid (TDS) values for all the samples since they are below 300 mg/l which is perfect for WHO standard for drinking water. This also confirms the absence of harmful elements such as manganese, arsenic, sulphate, etc., as revealed by XRD. The pHs are also within WHO range of 6.5–9.5 whereas GI-3, GI-4, GI-5 and GI-8 fell outside the EPA standard range of 6.5–8.5 for drinking water. We suspect that the 80.8 µs/cm conductivity value recorded for GI-4 maybe due to the high presence of the nesosilicate and sillimanite minerals.
Table 4. Physical Parameters of sterile water after soaking ECA adsorbents in it for 24 hours
3.2. E. Coli disinfection
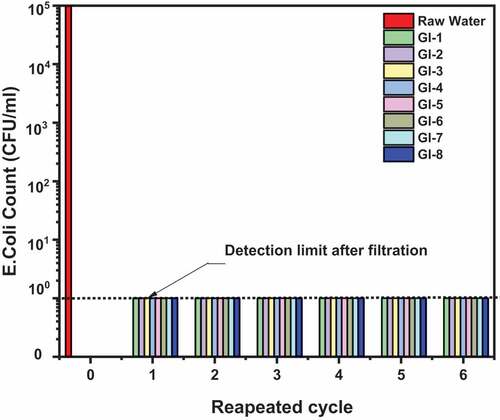
The disinfection result in shows that using the adsorbents could achieve E. Coli bacteria reduction up to log 4. It was also observed that the adsorbents were not consumed after six cycles of filtration although there was a decrease in flow rate (not part of the present studies). Similar disinfection assay was published by Asamoah et al. (Citation2020) using clay-metaloxide/metal composite pellets. We postulate that the high disinfection result might have arisen from bacterial cell wall that possessed amphoteric properties due to the presence of cationic and anionic groups, surface charge and modification of the adsorbent (Londono & Williams, Citation2016). Other clay-based materials have successfully removed E. Coli from water (Ajibade et al., Citation2019; Dang-I-Auphedeous, Citation2010; Unuabonah et al., Citation2018).
Figure 4. The antibacterial efficiency of ECA adsorbent on E. Coli bacteria before filtration at 105 CFU/ml raw water and after filtration. The adsorbents have excellent reusability as they maintained high disinfection efficiency after 6 recycling
3.3. Phosphate and nitrate removal
The reduction efficiencies for phosphate and nitrate for the entire adsorbents varied from 27.33% to 76% () and 10.67% to 46% respectively (). GI-1 possessed the highest disinfection efficiency of 76% within 10 minutes and consequently attained disinfection equilibrium around 25 minutes for phosphate. The cassiterite mineral and the aluminium complexes were suspected to have adsorbed the phosphorus ions (Johansson, Citation1997). Other adsorbents calcined to same temperature, i.e., GI-3, GI-4 and GI-7 reached disinfection equilibrium around 40 minutes () with highest efficiency values of 36%, 32.67% and 44% respectively. The phosphate % removal efficiency values for GI-2, GI-5, GI-7 and GI-8 were 46.47%, 33.35%, 41.33% and 40% respectively. Higher removal efficiency values attributed to lower pH, high surface area and high pore volume were recorded as against those reported by (Johansson, Citation1997; CitationLinkManagerBM_REF_g8QsYbG5Łopata et al.), 79–90% were reported by (Alzeyadi et al., Citation2019) using Biomass Bottom Ash (BBA), however 57%-75% removal efficiencies were reported for the biofiltration of ozonated humid water (Melin & Odegaard, Citation1999).
Figure 5. Phosphate and Nitrate reduction efficiencies; (a) phosphate concentration reduction for adsorbents calcined to 1100°C: GI-1 > GI-6 > GI-3 > GI-4; (b) Phosphate concentration reduction for adsorbents calcined to 1200°C: GI-2 > GI-7 > GI-8 > GI-5; (c) Nitrate concentration reduction for adsorbents calcined to 1100°C: GI-1 > GI-3 > GI-4 > GI-6; (d) Nitrate concentration reduction for adsorbents calcined to 1200°C: GI-2 > GI-5 > GI-8 > GI-7
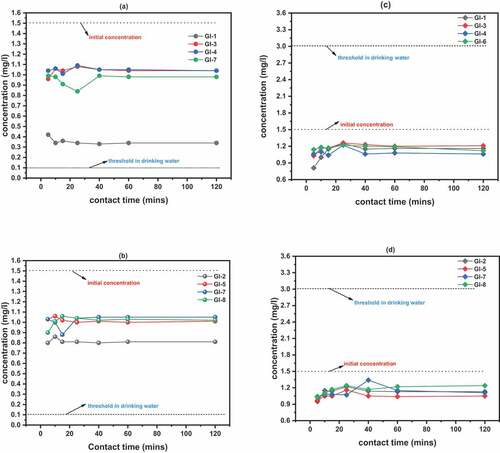
The highest % removal efficiency for Nitrate was 46% which was possessed by GI-1 around 5 minutes and attained equilibrium at about 40 minutes. GI-7 possessed the lowest value of 10.67% at about 40 minutes. The lower adsorption efficiencies were due to negative charge of Nitrate (Rezvani & Mehdi, Citation2018). With increasing pH, the removal efficiencies reduced drastically to as low as 18% for phosphate and 6% for Nitrate (highest values for all the adsorbents). We suspect that OH groups compete with the anions causing the reactive sites to become negatively charged which impedes Nitrate and Phosphate removal due to repulsion (Rezvani & Mehdi, Citation2018).
3.4. Adsorption isotherm
Langmuir and Freundlich models for both lead and arsenic are presented in . The correlation coefficient R2 suggests that the Langmuir isotherm is more appropriate (all adsorbents) in describing the adsorption process for both lead and arsenic (). This implies that the adsorption of lead and arsenic on ECA surface is a monolayer adsorption. The result is similar to those reported in the review of modified clay minerals adsorption processes (Annan et al., Citation2018; Gu et al., Citation2019). We therefore postulate that lead and arsenic removal was achieved by the adsorbate molecular transport to the adsorbent surface by diffusion through the boundary layer, the adsorbate diffuses from the external surface into the pores of the adsorbent, and the adsorbate binds on the multiple active sites of the internal pores (Habuda-stani & Nuji, Citation2015).
Figure 6. Adsorption of Pb (II) and As (III) on ECA, 25°C and pH 5.0 (a, c) Langmuir adsorption isotherms for Pb and As respectively; (b, d) Freundlich adsorption isotherms for Pb and As respectively: (e, f) Adsorption kinetics for Pb and As respectively
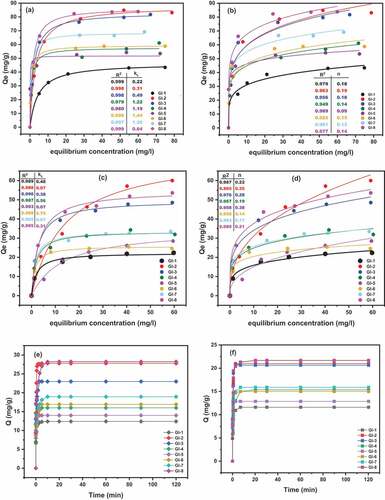
From also, the maximum adsorption capacity (Qmax (mg/g)) for each of the adsorbents was calculated for lead and arsenic to be 46.40/22.26; 87.93/74.62; 83.16/49.66; 57.66/33.57; 51.69/35.05; 59.28/25.86; 68.55/33.46 and 86.51/54.79 for GI-1, GI-2, GI-3, GI-4, GI-5, GI-6, GI-7 and GI-8 respectively. The adsorption capacity Kf for both lead and arsenic respectively for the eight adsorbents were 20.13/9.5; 37.89/12.42; 38.38/19.93; 31.81/15.95; 36.98/6,15; 32.22/14.50; 39.84/17.30 and 48.24/22.79.
3.5. Adsorption kinetics
Adsorption kinetics for Pb (II) and As (III) () was rapid. About 90% of adsorption took place within the first minute and equilibrium was attained within ten minutes as a result of active sites saturation. This is highly remarkable and recommendable for real applications. The rapid response to adsorption may be attributed to availability of large surface areas that exposed more reactive sites with fine particle size, active surface groups and large pore volume. Researchers have reported such response with other nano-adsorbents (Gu et al., Citation2019; Kalhori et al., Citation2017; Zhang et al., Citation2015).
3.6. Effect of pH
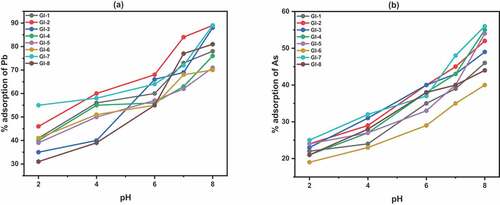
Due to the importance of pH in adsorption studies, the effects on the adsorbents were investigated within the range of 2 to 8. pH activates the anion adsorption sites on clay minerals (Mehmood et al., Citation2009). When the pH is low, the hydroxyl group exposed to the sites of clay mineral adsorbents becomes protonated causing the positive charge to interact and adsorbed the anions present in arsenic. The lower values of adsorption at lower pH were due to excess H+ ions which competes with Pb ions at the active sites. However the Pb ions react more with OH—as the pH increases resulting in adsorption increase.
Generally, lead and arsenic adsorption capacity increased with increase in pH () for all the adsorbents. Similar results were presented by (Goldberg, Citation2002) for arsenic (III) adsorption by kaolinite, illite, smectite and similar nano-adsorbent minerals (Habuda-stani & Nuji, Citation2015) and (Gaur et al., Citation2018) for lead. We suggest that this was due to surface charge of the adsorbents which is closely related to pH of water. Although higher adsorption was achieved at higher pH, this may be as result of pH precipitating at pH above 6 (Taffarel & Rubio, Citation2009). For further experiments, pH 6 was adopted to avoid precipitation interference.
Figure 7. Effect of pH on adsorption; (a) Pb II; (b) As III. Experimental conditions: temperature 27 °C, contact time 40 min, adsorbent dose 0.1 g/100 ml
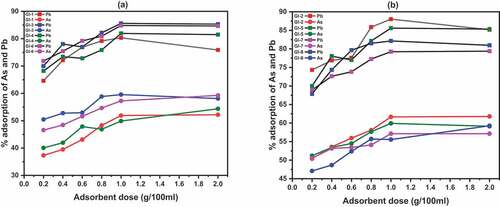
3.7. Effect of adsorbent dose
Adsorption of lead and arsenic was more as the dosage increased. Significant differences were observed between the adsorbent calcined to 1100°C () and 1200°C (). For instance, 52% arsenic was adsorbed at 1.0 (g/100 ml) on GI-1 whereas it was improved to 62% on GI-2 at the same dosage. We attribute it to more surface area and pore volume recorded in BET result in and active binding sites. However, it cannot be concluded that the higher the calcined temperature, the higher the arsenic/lead adsorption as GI-3 adsorbed 59%/84% as against GI-8 that adsorbed 55%/82% respectively. Adsorption tends to equilibrium after reaching peak at 1.0 (g/100 ml) though except GI-8 arsenic adsorption and a decline in the lead adsorption for GI-1 and GI-2. Generally, it was observed that Pb is adsorbed by ECA more than As. This is due to the positive and negative ionization possessed by the two metals respectively.
Figure 8. Effect of adsorbent dose on adsorption of Pb II and As III. Experimental conditions: temperature 27 °C; contact time 40 min; pH 6; (a) adsorbents are calcined to 1100°C; (b) adsorbents are calcined to 1200°C
3.8. Cycle experiments
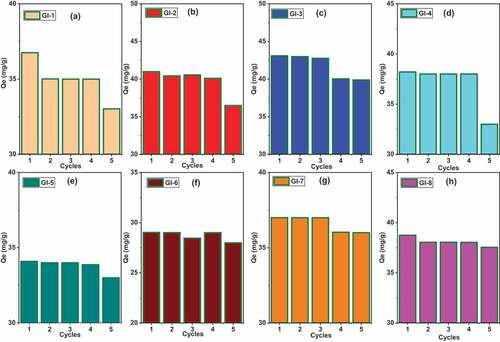
reveals the Pb (II) adsorption capacity for all the ECA adsorbents. Their metal uptake was predominantly stable for some after four cycles () whereas there was much significant difference for GI-5 () after two cycles, i.e. from 82 (mg/g) to 73 (mg/g). The adsorption for As (III) () was more stable for till the fourth cycle for all adsorbent with the exception of GI-3 which exhibited significant difference at the third cycle (). GI-7 and GI-8 were not consumed even till the fifth cycle as their adsorption capacity reduced negligibly from 37 (mg/g) to 36 (mg/g) and 38 (mg/g) to 37 (mg/g) respectively. Relatively, the adsorbents had good reusability and possess great potential in the purification of water.
Figure 9. Cyclic experiments for the Pb (II) adsorption shaken for 30 minutes at 25°C regenerated with 0.01 M Na2 EDTA
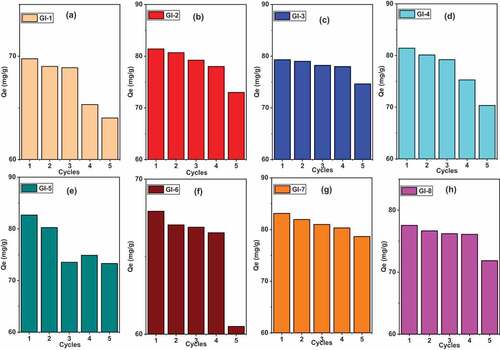
Figure 10. Cyclic adsorption experiments for As (III) shaken for 30 minutes at 25°C regenerated with 0.1 M NaOH
4. Conclusions
Expanded Clay Aggregates (ECA) in natural and modified forms were used as filter materials for the removal of E. Coli bacteria, phosphates and nitrates as well as adsorbents for lead (II) and arsenic (III). Their possession of large surface areas-to-volume ratio, high pore volume and more reactive sites necessitates high removal rate of E. Coli bacteria up to log four, high phosphate (27.33% to 76%) and nitrate (10.67% to 46%) removal compared with previous studies results. Adsorption isotherms for both lead (II) and arsenic (III) fitted better to Langmuir than Freundlich models. Adsorption kinetics was fast and recommendable for real applications. Experimental factors such as pH, adsorbent dose and contact time obviously affected the adsorption studies. This study has successfully demonstrated the feasibility of modified ECA for use in water treatment and remediation applications thereby eliminating or reducing the use of chemicals to barest minimum. Future work will look at the adsorption mechanisms of interaction between adsorbents and contaminants, development of low-cost modified clay adsorbents with other renewable fillers and their exploitation in water remediation for community base applications and municipal treatment plants.
Declaration of Conflicting Interest
The Authors declare that there is no conflict of interest.
Acknowledgements
The authors would like to acknowledge the financial supports from African Development Bank (AfDB) (NMI- AIST 2100155032824) and Pan-African Materials Institute (PAMI) under the World Bank African Centers of Excellence (ACE) program (PAMI/2015/5415-NG). Both Organizations are hosted by the African University of Science and Technology (AUST), Abuja, Nigeria.
Data Availability Statement
The data that support the findings of this study are available from the corresponding author, G.O. Ihekweme, upon reasonable request https://repository.aust.edu.ng//xmlui/gina ihekweme.
Additional information
Funding
Notes on contributors

Gina O. Ihekweme
Gina Ihekweme is a production Engineer at the National Agency for Science and Engineering Infrastructure (NASENI), Abuja, Nigeria. She holds a Master of Engineering in Industrial Production Engineering. She is a PhD Candidate in Materials Science and Engineering specializing in water purification. Ifeyinwa Obianyo holds a PhD in Materials Science and Engineering. She has worked extensively in clay science and its application in sustainable building materials. Esther Anosike-Francis‘ expertise is in nanomaterials for industrial applications. Victoria Anyakora has decades of industrial experience in water purification technologies. Shola Odusanya is a research Director at Sheda Science and Technology Complex (SHETSCO), Abuja, Nigeria, with experience in smart materials for water purification, drug delivery in breast cancer treatment. Prof. Onwualu is Head of Materials Science and Engineering, African University of Science and Technology, Abuja with interests in water filtration and biomass processing engineering.
References
- Ajibade, F. O., Akosile, S. I., Oluwatuyi, O. E., Ajibade, T. F., Lasisi, K. H., Adewumi, J. R., … Clay, I. (2019). Bacteria removal efficiency data and properties of Nigerian clay used as a household ceramic water filter. Results in Engineering, 2(April), 100011. https://doi.org/10.1016/j.rineng.2019.100011
- Alzeyadi, A., Al-Ansari, N., Laue, J., & Alattabi, A. (2019). Study of biomass bottom ash efficiency as phosphate sorbent material. Civil Engineering Journal, 5(11), 2392–19. https://doi.org/10.28991/cej-2019-03091419
- Annan, E., Agyei-tuffour, B., Bensah, Y. D., Sasu, D., Yaya, A., Onwona-agyeman, B., … Konadu, D. S. (2018). Application of clay ceramics and nanotechnology in water treatment : A review Application of clay ceramics and nanotechnology in water treatment : A review. Cogent Engineering, 00, 1–35. https://doi.org/10.1080/23311916.2018.1476017
- Asamoah, R. B., Yaya, A., Nbelayim, P., Annan, E., & Onwona-Agyeman, B. (2020). Development and characterization of clay-nanocomposites for water purification. Materials, 13(17), 17. https://doi.org/10.3390/MA13173793
- Backer, H. (2002). Water Disinfection for International and Wilderness Travelers, 94704(July 2001), 355–364. https://doi.org/10.584838/2002/3403-0010$03.00
- Bahmanpour, H., Habashi, R., & Hosseini, S. M. (2017). Investigating the Efficiency of Lightweight Expanded Clay Aggregate (LECA) in Wastewater Treatment of Dairy Industry. Anthropogenic Pollution Journal, 1(1), 9–17. https://doi.org/10.22034/apj.2017.1.1.917
- Dang-I-Auphedeous, Y. (2010). Clay filtration of microbes and fluoride. Master of African University of Abudja (Nigeria). pp54.
- Fadiran, A. O., Dlamimi, S. C., & Mavuso, A. (2008). A Comparative Study of the Phosphate Levels in Some Surface and Ground Water Bodies of Swaziland.Bulletin of the Chemical Society of Ethiopia,22(2), 197–206. https://doi.org/10.4314/bcse.v22i2.61286
- Fried, S., Mackie, B., & Nothwehr, E. (2003). Nitrate and phosphate levels positively affect the growth of algae species found in Perry Pond. Tillers, 4, 21–24. http://digital.grinnell.edu/ojs/index.php/tillers/article/view/33
- Gaur, N., Kukreja, A., Yadav, M., & Tiwari, A. (2018). Adsorptive removal of lead and arsenic from aqueous solution using soya bean as a novel biosorbent : Equilibrium isotherm and thermal stability studies. Applied Water Science, 8(4), 1–12. https://doi.org/10.1007/s13201-018-0743-5
- Gisvold, B., Ödegaard, H., & Föllesdal, M. 2018. Nitrate and phosphate levels positively affect the growth of algae species found in Perry Pond, November, 107–114. https://iwaponline.com/wst/article-pdf/41/9/107/427700/107.pdf
- Goldberg, S. (2002). Competitive adsorption of arsenate and arsenite on oxides and clay minerals. Soil Science Society of America Journal, 66(2), https://www.researchgate.net/publication/297366608_Competitive_adsorption_of_arsenate_and_arsenite_on_oxides_and_clay_minerals
- Gu, S., Kang, X., Wang, L., Lichtfouse, E., Wang, C., Gu, S., … Wang, C. (2019). Clay mineral adsorbents for heavy metal removal from wastewater. Environmental Chemistry Letters, 17(2), 629–654. https://doi.org/10.1007/s10311-018-0813-9
- Habuda-stani, M., & Nuji, M. 2015. Arsenic removal by nanoparticles: A review. Environmental Science and Pollution Research22(11):8094-8123. https://doi.org/10.1007/s11356-015-4307-z
- Hotez, P. J., Molyneux, D. H., Fenwick, A., Ottesen, E., & Ehrlich Sachs S, S. J. (2006). Incorporating a Rapid-impact Package for Neglected Tropical Diseases with Programs for HIV/AIDS, Tuberculosis, Malaria, 3(5), e102. https://doi.org/10.1371/journal.pmed.0030102
- Ihekweme, G. O., Shondo, J. N., Orisekeh, K. I., Kalu-uka, G. M., Nwuzor, I. C., & Onwualu, P. A. (2020). Characterization of certain Nigerian clay minerals for water purification and other industrial applications. Heliyon, 6(December2019), e03783. https://doi.org/10.1016/j.heliyon.2020.e03783
- Johansson, L. (1997). The use of leca (light expanded clay aggregates) for the removal of phosphorus from wastewater. Water Science and Technology, 35(5), 87–93. https://doi.org/10.1016/S0273-1223(97)00056-5
- Kalhori, E. M., Al-Musawi, T. J., Ghahramani, E., & Hossein Kazemian, M. Z. (2017). Enhancement of the adsorption capacity of the light-weight expanded clay aggregate surface for the metronidazole antibiotic by coating with MgO nanoparticles Studies on the kinetic, isotherm, and effects of environmental parameters.pdf.
- Khyade, V. B., & Swaminathan, M. S. (2016). Water : The Pacemaker for Life of Earth. World Scientific News, 44, 93–125. www.worldscienti ficnews.com
- Knobeloch, L., Anderson, H., Salna, B., Hogan, A., Postle, J., & Anderson, H. (2000). Blue babies and nitrate-contaminated well water. Environmental Health Perspectives, 108.(August). https://doi.org/10.1289/ehp.00108675
- Liu, L., Johnson, H. L., Cousens, S., Perin, J., Scott, S., Lawn, J. E., Rudan, I., Campbell, H., Cibulskis, R., Li, M., & Mathers C, B. R. 2012. Child Health Epidemiology Reference Group of WHO and UNICEF. Global, Regional, and National Causes of Child Mortality: An Updated Systematic Analysis for 2010 with Time Trends since 2000. The Lancet, 379(9832), 2151-2161.
- Londono, S. C., & Williams, L. B. (2016). Unraveling the antibacterial mode of action of a clay from the Colombian Amazon. Environmental Geochemistry and Health, 38(2), 363–379. https://doi.org/10.1007/s10653-015-9723-y
- Łopata, M., Czerniejewski, P., Wiśniewski, G., & Czerniawski, R. (2017). The Use of Expanded Clay Aggregate for the Pretreatment of Surface Waters on the Example of a Tributary of Lake Klasztorne Górne in Strzelce Krajenskie. Limnological Review, 17(1), 3–9. https://doi.org/10.1515/limre-2017-0001
- Luo, J., Luo, X., Crittenden, J., Qu, J., Bai, Y., Peng, Y., & Li, J. (2015). Removal of antimonite (Sb(III)) and antimonate (Sb(V)) from aqueous solution using carbon nanofibers that are decorated with zirconium oxide (ZrO2). Environmental Science & Technology, 49(18), 11115–11124. https://doi.org/10.1021/acs.est.5b02903
- Mehmood, A., Hayat, R., Wasim, M., & Akhtar, M. S. (2009). Mechanisms of Arsenic Adsorption in Calcareous Soils. Journal Agriculture Biological science, 1(1), 59–65.
- Melin, E. S., & Odegaard, H. (1999). Biofiltration of Ozonated Humid Water in Expanded Clay Aggregate Filters. Water science and technology, 40(9), 165–172. https://doi.org/10.1016/S0273-1223(99)00653-8
- Nath, G. M., & Goldberg, J. B. (2003). Light Expanded Clay aggregates for Phosphorus Removal.U.S. Patent No. 6,627,083. Washington, DC: U.S. Patent and Trademark Office. (pp. 12).
- Noori, M., Kazemian, H., Ghahramani, E., & Amrane, A. (2014). Defluoridation of water via light weight expanded clay aggregate (LECA): Adsorbent characterization, competing ions, chemical regeneration, equilibrium and kinetic modeling. Journal of the Taiwan Institute of Chemical Engineers, 49, 19–26. https://doi.org/10.1016/j.jtice.2014.02.009
- Prüss-Üstün, A., Bos, R., Gore, F., & Bartram, J. (2008). Safer water, better health: Costs, benefits and sustainability of interventions to protect and promote health. World Health Organization, Geneva.
- Rezvani, P., & Mehdi, M. (2018). On using clay and nanoclay ceramic granules in reducing lead, arsenic, nitrate, and turbidity from water. Applied Water Science, 8(5), 1–6. https://doi.org/10.1007/s13201-018-0779-6
- Shiklomanov, I. (1993). Water in crisis: A guide to the world’s fresh water resources. H. G. Peter (Ed.). USA: Oxford University Press.
- Taffarel, S. R., & Rubio, J. (2009). On the removal of Mn(II) ions by adsorption onto natural and activated Chilean zeolites. Miner. Eng, 22(4), 336–343. https://doi.org/10.1016/j.mineng.2008.09.007
- The National Academics. (1980). Drinking Water and Health, Volume 2. Safe Drinking Water Committee, Board on Toxicology and Environmental Health Hazards, Assembly of Life Sciences; ISBN: 0-309-55406-3, 408. http://www.nap.edu/catalog/1904.html
- U.S.EPA (Environmental Protection Agency). (2011). Exposure Factors Handbook: 2011 Edition (Final Report). U.S. Environmental Protection Agency, Washington, DC, EPA/600/R-09/052F, 2011.
- United Nations. (2017). World population projected to reach 9.8 billion in 2050, and 11.2 billion in 2100. Department of Economic and Social Affairs, United Nations News.
- Unuabonah, E. I., Ugwuja, C. G., Omorogie, M. O., Adewuyi, A., & Oladoja, N. A. (2018). Clays for efficient disinfection of bacteria in water. Applied Clay Science, 151(2018), 211–223. https://doi.org/10.1016/j.clay.2017.10.005
- USEPA. (2017). IRIS assessment plan for nitrate and nitrite (scoping and problem formulation materials). U.S. Environmental Protection Agency. EPA/635/R-17/331.
- World Health Organization. (2009). Neglected tropical diseases, hidden successes, emerging opportunities. World health Organization. https://apps.who.int/irish/handle/10665/44214
- World Health Organization. (2016). WHO Collaborating Center for Research Training and Eradication of Dracunculiasis, Guinea Worm Wrap Up #238, 2016. Centers for Disease Control and Prevention (CGH): Atlanta.
- World Health Organization. (2020). Water-related diseases: Prepared for World Water Day. Reviewed by staff and experts in Family and Community Health Unit (FCH), and the Water, Sanitation and Health Unit (WSH), World Health Organization (WHO), Geneva.
- World Health Organization /United Nations Children's Fund. (2017). Progress on Drinking Water, Sanitation and Hygiene: 2017 Updates and SDG Baseline, Geneva. World HealthOrganization (WHO) and the United Nations Children’s Fund (UNICEF), 2017. Licence: CC BY-NC-SA 3.0 IGO..
- World Health Organization/United Nations Children's Fund. (2001). Global Water Supply and Sanitation Assessment 2000 Report.
- World Health Organization. (2011). Nitrate and nitrite in drinking-water: Background document for development of WHO Guidelines for Drinking-water Quality.
- Yaghi, N., & Hartikainen, H. (2014). Effect of Phosphate on the Sorption of Arsenite onto Aluminum – or Iron – Oxide Coated Light Expanded Clay Aggregate (LECA)., 3(4), 11–17.
- Zhang, X., Qian, J., & Pan, B. 2015. Fabrication of Novel Magnetic Nanoparticles for Efficient and Simultaneous Removal of Multiple Pollutants from Water Fabrication of Novel Magnetic Nanoparticles for Adsorption of Heavy Metals. Environmental Science & Technology, 201650(2), 881-889. https://doi.org/10.1021/acs.est.5b04539