
 ?Mathematical formulae have been encoded as MathML and are displayed in this HTML version using MathJax in order to improve their display. Uncheck the box to turn MathJax off. This feature requires Javascript. Click on a formula to zoom.
Abstract
Renewable energy systems provide a resilient access pathway to affordable and sustainable energy for millions of people in regions with no or undeserved grid. In this work, a multi-objective Hybrid Optimization Model for Electric Renewables (HOMER) software has been applied to design and assess the techno-economic feasibility of Hybrid Renewable Energy Systems (HRESs) for Malawi’s off-grid communities. The study targeted the use of decentralized photovoltaic (PV), wind, diesel generator, and battery storage technologies to electrify three villages of Chigunda, Mdyaka, and Kadzuwa, which had estimated daily electrical energy peak demands of 14.53, 8.09, and 6.40 kW, respectively. Wind and solar resource data were used as inputs to generate multiple combinations of energy systems in HOMER. The sensitivity of the output systems was tested by varying the wind velocity and diesel pump prices. The optimization results showed that for Chigunda, the optimal configuration comprised PV-wind-battery, while for Mdyaka and Kadzuwa, the PV-battery combinations were ideal. In all the cases, the optimal systems were more sensitive to changes in wind velocity. The systems were, however, found to be infeasible economically as the costs of energy were higher than the per kilowatt-hour cost of US$ 0.120 for electricity in Malawi.
PUBLIC INTEREST STATEMENT
The energy industry is awash with energy systems’ sizing, design, and feasibility analysis tools, one of them being the HOMER software. This software has been facing major upgrades over the years, and it considers multiple objectives when optimizing the energy systems’ technical, economic, and environmental performance. Renewable resources and electric load data, electrical components, and their cost parameters and sensitivity parameters are used in feasibility assessments of the outputs. The feasible system is supposed to meet the electricity demand at the lowest Net Present Cost (NPC) and Cost of Energy (COE). The current work used this software to identify electrification alternatives for Malawi’s off-grid rural villages. By varying the wind velocity and diesel price, the results showed that the optimal systems met the electricity demand at the lowest capacity shortage, maximum renewable penetration, and lowest NPC and COE. However, the systems were found to produce electricity at a higher cost than the one it were being sold for.
1. Introduction
The nexus between affordable energy and sustainable development cannot be overemphasized. The preponderance of evidence has hinted at the positive contribution of energy to the sustenance of almost all human activities (Feron, Citation2016; UNDP, Citation2015). Arguably, energy is at the core of mankind’s improved quality of life through provision of efficient lighting, heating, cooking, and mechanical power services (Feron, Citation2016). Though energy invariably brings about socio-economic transformation, there is a global shortage of clean and affordable energy supply. As of 2017, on the global scale, 840 million people did not have access to electricity and 2.90 billion people lacked clean cooking means in terms of fuels and improved stoves (IEA, IRENA, UNSD, W. & W, Citation2019). Third world countries, especially those in the Asian and Sub-Saharan Africa (SSA) regions, are the hardest hit with these challenges. In SSA alone, 573 and 620 million people do not have access to electricity and clean cooking means, respectively (IEA, IRENA, UNSD, W. & W, Citation2019; WHO, Citation2009). Although the Asian region has recorded tremendous improvements in electricity access from 2010 to 2017, at least 1.1 billion people are still dependent on solid fuels for cooking (IEA, IRENA, UNSD, W. & W, Citation2019; WHO, Citation2009).
Malawi registers itself as a country with one of the lowest energy access rates in SSA as 85% of the population still relies on solid biomass and kerosene for fuel (Taulo et al., Citation2015). Electricity access is limited to only 11% of the population, of which 4% is for the rural areas (World Bank., Citation2019). Largely, these electrification rates are attributed to low generation capacities of the existing power plants which restrict grid expansion, energy demand increases due to the burgeoning population, and minimal penetration of the private sector into the power generation pool (Taulo et al., Citation2015). The status quo is thus providing very few options to the people and as a result, the energy substitutes, which are at the people’s disposal, are costly. Continued burning of dirty fuels for energy is also affecting the people’s health through indoor air pollution. Clearance of forest cover for fuel is also negatively affecting the environment and the frequency of natural disasters is increasing. For the case of electricity, its inadequate supply is impeding development through paralysis of service delivery and industrial production mechanisms. Worse still, there is also a derailment of foreign investment.
At the time when harnessing of fossil fuels for energy is losing popularity in majority of countries, there seems to be substantial headway in photovoltaic (PV) and wind technology development and deployment. This can be attributed to the dropping cost, technological advancement, and environmental benefits of these technologies. Capitalizing on this development, employing Renewable Energy (RE) electrification systems based on PV and wind for Malawi’s remote areas can help ease the electricity access situation. Due to the absence of the electricity grid in most rural areas, off-grid electrification modes still offer some leverage. Much as the overall intent for deploying stand-alone PV and wind energy supply systems hinges on making electricity accessible to many, taking heed to sustainable design aspects plays a monumental role in ensuring continuity of the energy service. A new wave of research activity in this field currently places emphasis on designing the energy supply systems in such a way that maintains a balance between the technical and economic performances (Diaf et al., Citation2008; Olatomiwa et al., Citation2015; Sandeep & Atul, Citation2012; Zalengera, Citation2015). This has been made possible with objective design tools, and the Hybrid Optimization Model for Electric Renewables (HOMER) has shown great potential in the achievement of this task.
1.1. Summary of key literature on techno-economic designing using HOMER
presents a summary of the key literature on the use of HOMER to perform techno-economic analyses of hybrid renewable energy systems. The feasibility of an energy system is based on its ability to meet the indispensable precondition of satisfying the electrical load at the lowest Net Present Cost (NPC) and Cost of Energy (COE) (Lambert et al., Citation2006).
Table 1. Key literature on energy systems techno-economic designing
1.2. The study locations
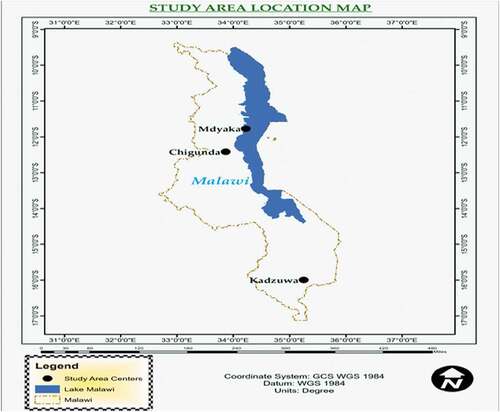
The study targeted the villages of Chigunda, Kadzuwa, and Mdyaka. These were representative villages selected from each of the three geopolitical regions of Malawi (Malanda et al., Citation2020). Refer to , which highlights the locations of the three villages. In terms of geographical location, Chigunda is found along 12° 25ʹ 34.7” S and 034° 01ʹ 06.7” E. Mdyaka is located within 11°47ʹ 09.5” S and 034° 13ʹ 39.0” E, while Kadzuwa lies along 15° 59ʹ 48.4” S and 035° 15ʹ 0.15” (Malanda et al., Citation2020). Like the majority of the areas in Malawi, the main activity which takes place in these areas is agriculture (rain-fed and irrigation) although fishing is also prevalent in Mdayaka and Chigunda.
Figure 1. Map of Malawi highlighting the study locations
1.3. The paper’s contributions to knowledge
This paper offers novel insights into the design and techno-economic analysis of HRESs in the following ways:
The possibility of identifying a single energy system configuration to electrify multiple sites is explored.
It attempts to design energy supply systems while maintaining the quality and cost trade-off, a condition, which remains a black box to energy researchers.
Identification of HRESs with minimized COE and NPC for remote deployment is investigated.
It strives to identify the best way of electrifying rural communities at the minimal environmental cost.
Rather than placing emphasis on the design of a single energy supply system, the study offers flexibility by suggesting numerous electrification options and allowing the elimination criteria to decide the optimal alternative.
On a wider scope, this study also fosters our understanding of the scientific theory underpinning the existence of differences in HOMER systems’ output under varied climatic conditions.
2. Methodology
2.1. System modeling and analysis
HOMER software was utilized in the design and optimization of the HRESs. HOMER is an energy system design tool that aids in the simulation, optimization, and sensitivity analysis of off-grid, grid-tied, and distributed micro-power systems (Lambert et al., Citation2006). During simulation, the hourly performance of a single micro-power system is modeled with the aim of establishing its technical and economic capabilities throughout the year. In the optimization stage, HOMER uses energy balance calculations to deduce and rank possible system combinations capable of meeting the electrical load (Lambert et al., Citation2006). Sensitivity analysis is concerned with identifying and specifying variables, which can bring about technical and economic bottlenecks during operation of the systems. As previously stated, the techno-economic feasibility of an energy system is based on its ability to meet the indispensable precondition of satisfying the electrical load at the lowest Net Present Cost (NPC) and Cost of Energy (COE) (Lambert et al., Citation2006). The determination of NPC and COE values in HOMER is consistent with Equationequations 1(1)
(1) and Equation2
(2)
(2) , respectively (Krishan & Sathans, Citation2018; Lambert et al., Citation2006):
where is the capital costs,
is the O&M costs,
is the replacement costs,
stands for the fuel cost, and
is the salvage value.
where is the sum of investment, installation, replacement, and O&M costs,
represents the alternating current (AC) primary load demand,
stands for Direct Current (DC) primary load demand, Ed is the deferrable load electricity demand, and
is electricity sold to the grid.
2.2. Techno-economic analysis
2.2.1. Solar PV
HOMER models the hourly energy output for a mono-crystalline PV module using Equationequation (3)(3)
(3) (Belmili et al., Citation2014)
In this equation, EPV is the hourly energy production measured in Watt-hours (Wh), APV measures the surface area of PV modules in (m2), NPV indicates the quantity of PV modules used, ηPV denotes the PV modules’ efficiency, and I(t) is the hourly radiation reaching the modules surface and is recorded in W/m2. The efficiency of the PV modules is temperature-variant and is dependent on the PV cell temperature, which is in turn a function of ambient temperature. The mathematical relationships connecting the efficiency and cell and ambient temperatures feature in Equationequations 4(4)
(4) and 5 (Belmili et al., Citation2014)
In Equationequation 4(4)
(4) , ηr represents the PV’s rated efficiency, βT stands for the temperature coefficient of the PV cell, and Tc and Tr are cell and rated temperatures of the PV module in oC, respectively. In (5), NOCT and Ta are the nominal cell operating temperature and ambient temperature, respectively, reported in oC, and INOCT is the oncoming solar irradiation at NOCT in W/m2.
2.2.2. Wind energy generator
Quantification of the energy generated by a wind energy conversion device follows the application of (6) (Hosseinalizadeh et al., Citation2016; Lim, Citation2012).
where PW is the generated energy in W, Cp is the dimensionless power coefficient of the wind machine, ρ stands for the air density in kg/m3, A represents the rotor blades’ swept area measured in m2, and v is the wind velocity at a specified anemometer height measured in m/s. The uncertainty in the wind velocity at a particular height given the readings at one height and the new height is averted by extrapolation using Equationequation (7)(7)
(7) (Hosseinalizadeh et al., Citation2016)
where vz is the predicted wind velocity reading at a known height z, and vo is the wind velocity at an initially specified height zo.
2.2.3. Diesel generator
The DG, which in most cases acts as an ancillary component during energy system design, uses fuel to produce electricity and dissipate heat. An important property of any DG is its fuel curve, which correlates the amount of fuel consumed and the electrical power generated. With a bold assumption that the DG has a linear fuel curve with the y-intercept, HOMER models the fuel consumption using Equationequation (8)(8)
(8) (Diab et al., Citation2016; Lambert et al., Citation2006).
From Equationequation (8)(8)
(8) , F0 stands for the fuel curve intercept coefficient, F1 is the curve gradient, Ygen is the generator’s rated capacity, and Pgen is the power output of the generator in kW. The measurement units of F are specified in L/hr, m3/hr, or kg/hr.
In determining the lifetime of a DG, which is recorded in hours of operation, Equationequation (9)(9)
(9) is employed (Diab et al., Citation2016)
where GL,Y represents the expected lifetime in years, GL,h is the actual lifetime in hours, and Nhg is the total number of operational hours in a year for the DG (hours/year).
When performing simulations, HOMER calculates and considers the fixed and marginal COE. The fixed COE refers to the hourly costs associated with running the DG without necessarily producing electrical energy. The marginal COE, however, includes the additional cost for producing one kilowatt-hour of electricity (Lambert et al., Citation2006). Equation (10) determines the fixed COE.
where com,gen is the hourly O&M cost in US$, crep,gen stands for the replacement cost in US$, Rgen is the generator’s lifetime in hours, and cfuel,eff is the cost of fuel in US$/specified quantity of fuels. The calculation of the marginal COE follows the application of equation (11):
In equation (11), F1 is the fuel curve gradient in quantity per kilowatt-hour and cfuel,eff is the effective fuel price including emission penalties.
2.2.4. Battery energy storage system
The Battery Energy Storage System (BESS) is the most sensitive among all the components used in energy systems design. Depending on whether we are drawing or supplying power to the BESS, its state changes between any two instants t and t – 1. As Kanase-Patil et al. (Citation2011) suggest, the mathematical model, which undergirds the determination of the available electrical power in the BESS, is given as
where EBatt(t) is the stored energy, EEE(t) is the excess energy resulting from all the systems, ηCC is the charge controller efficiency, and ηCHG is the efficiency associated with battery charging.
2.3. Systems design parameters
2.3.1. Renewable Energy Resources
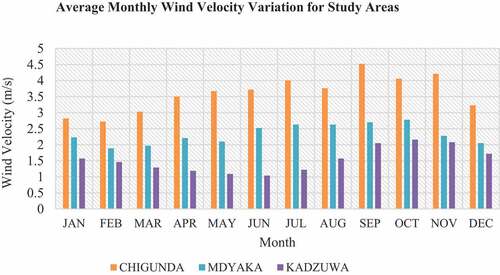
The study considered wind speed and solar Global Horizontal Irradiance (GHI) as input data in HOMER. The Department of Climate Change and Meteorological Services, Malawi, provided the data. These data were monthly averages and spanned from 2000 to 2015. The wind velocity readings were taken at an anemometer height of 2 m, while the wind turbine had a hub height of 17 m. Therefore, prediction of the wind velocity at 17 m was governed by Equationequation (7)(7)
(7) . Refer to , which provide details of renewable energy resources used in HOMER.
Figure 2. Monthly solar radiation variation for the study areas
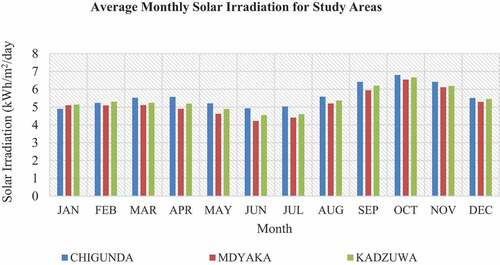
Figure 3. Wind velocity profiles for the study areas
2.3.2. Electric Load
The households’ daily electrical energy needs were estimated using the appliance usage method (Diemuodeke et al., Citation2017, Citation2019). For Chigunda, the estimated daily primary load was 90.27 kWh and peak demand was 14.53 kW. For Mdyaka, the primary load was 47.10 kWh and the peak demand was 8.09 kW. Finally, for Kadzuwa, a primary load of 44.52 kWh and a peak demand of 6.40 kWh were established. The presentation of the load data in HOMER entailed specification of hourly electrical energy consumption. The loads were deemed synthetic in nature, and therefore, only one month’s loads were specified. Day-to-day and time-step variability of 10% was added to the loads to account for the fluctuations of the load in the course of the day and year.
2.3.3. Electrical Components
The PV, wind turbines, diesel generator, battery energy storage, converter, and control input systems were central to the design and analysis of these systems. These components were obtained from the HOMER repository but the technical and economic characteristics were based on a market survey. The subsequent section provides details of each component based on its technical and economic parameters.
2.3.3.1. PV Array
The study considered Generic flat-plate PV, abbreviated as PV in the model. This is a monocrystalline module with a nominal capacity of 1 kW. In order to maximize the size, the search space was optimized in such a way that HOMER considered system sizes ranging from 0 to 100 kW in 10 kW intervals. The 1-kW PV system had a capital cost of US$ 2500, a replacement cost of US$ 2150, and O&M cost of US$ 10/year. This PV component also had a life span of 25 years.
2.3.3.2. Wind Energy Conversion Device
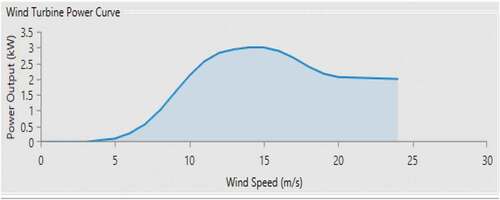
The Generic 3 kW wind turbine (G3) was chosen for this study. This is a wind turbine with a rotor diameter of 4.0 m, a cut-in wind speed of 4 m/s, a cut-out wind speed of 50 m/s, and a hub height of 17 m. To provide a range of options for the system sizes, the search space was optimized so that HOMER considered turbine numbers from 0 to 6. The capital, replacement, and O&M costs were US$18,000, US$ 14,500, and US$ 180 per year, individually. This G3 component had a life-time of 20 years. Refer to which depicts the power curve of this wind turbine as presented in HOMER.
Figure 4. Generic 3-kW wind turbine pPower curve
2.3.3.3. Diesel Generator
To guard against the unpredictability of RE resources, a diesel generator (DG) was incorporated as a back-up energy generation component. This DG component in question was a Generic 25 kW Fixed Capacity system (Gen25). This component had a fuel curve intercept of 0.825 L/hr. The capital, replacement, and O&M costs were US$ 12,500, US$ 10,500, and 0.75/hr, respectively. The component had a lifetime of 15 years.
2.3.3.4. Battery Energy Storage
The Generic 1-kWh Lead Acid Battery (1 kWh LA) was placed under consideration. This is a 1-kWh battery with a nominal voltage of 12 V and an amperage of 219 Ah. The capital cost for one battery was specified to be US$ 300. While the replacement cost for a single battery was US$ 300, the O&M cost stood at US$ 10/year. The life-time for this component was 5 years.
2.3.3.5. System Converter
To enable interconversion between the Alternating Current (AC) and Direct Current (DC) voltage operation cycles, a system converter is necessary. In this study, the Leonics MTP-413 F 25 kW (Leon25) was employed. This is a 25 kW/240 V bidirectional converter with an inverter efficiency of 96% and rectifier efficiency of 94% (Leonics, Citation2018). The component has capital and replacement costs of US$ 600/kW. The O&M costs had a value of US$ 0/year.
2.3.3.6. System Controller
The inclusion of the DG as one of the energy generation devices prompted the incorporation of auto-starting means. A DG generally has two operation strategies, namely, Load Following (LF) and Cycle Charging (CC). In the LF dispatch strategy, the DG is in restricted mode, only supplying power in times of deficiency. On the contrary, the CC strategy involves maximum operation of the generator while using the excess energy to feed the battery bank. The LF mode is however uneconomical as it leads to a decrease in the load factor of the DG. This culminates into the reduction of its operational efficiency. This study therefore adopted the CC strategy in its quest of solving the optimization problem.
2.4. Systems’ sensitivity variables
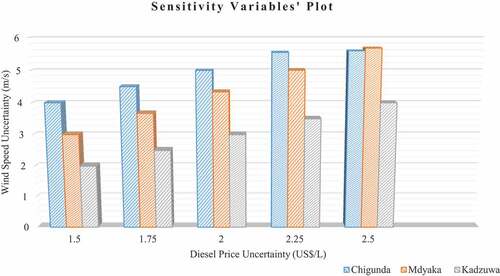
The study considered prices of fuel (diesel) per litre and monthly wind velocity variations in the course of the project’s lifetime as sensitivity variables. Considering these optimization constraints allowed HOMER to determine the sensitivity of the output systems’ NPC to changes in these variables (Rozlan et al., Citation2011). In response to this, the study considered the worst-case scenario for the fuel price (increase in the price) and the best-case scenario for the wind velocity (improvement in the wind velocity profile). As indicates, for Chigunda, the wind velocity readings were allowed to vary between 3.60 and 5.60 m/s. For Mdyaka, the same varied between 2.33 and 5.68 m/s, and for Kadzuwa, the wind velocity varied between 1.54 and 4.0 m/s. For the case of diesel pump price, the study considered the variations to be the same for all cases, and the variation scale was from 1.25 to US$ 2.5/L.
Figure 5. Sensitivity variables plot for the study villages
2.5. Generalized systems design schematic
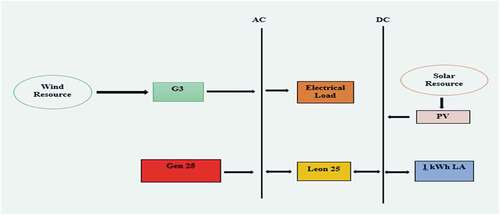
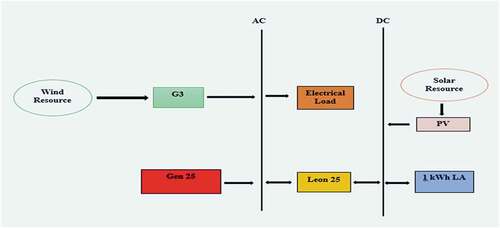
Consolidation of the various components described above led to the formulation of the general energy simulation model outlined in . Its architecture comprises PV system, wind system, diesel generators, storage system, energy system converter, and load. The PV system is DC coupled, while the wind and DG systems are AC coupled. This enables the electricity produced by the DC component (PV) to be converted to AC and minimize production by the DG component. This has an overall impact on the life cycle costs through reduction of fuel consumption (Justo et al., Citation2013). The assembly of this model is premised on the fact that the PV and G3 are the main power generation components while the DG plays an auxiliary role. Using the solar resource, the PV component will be producing electrical power which, based on the available demand, will be converted using the converter which during this cycle will be operating in the DC-AC mode. The excess energy will be stored in the battery by taking advantage of the DC-DC operation cycle of the converter. In the same vein, using the wind resource, the G3 component will also be producing electrical power which will be fed to the AC bus in order to supply the load. In times of excess production, the Leon25 converter will be using the AC-DC operation to deposit the excess energy to the battery. In times of deficit, as dictated by the CC dispatch strategy, the DG will be operated at its maximum, say, 25 kW, and as a result, it will satisfy the load while at the same time use the excess energy to charge the battery. In making all these determinations, HOMER will be performing calculations to assess the contribution arising from renewable power and comparing it to the electric load. This will help in deciding on how to manage the excess renewable power or how to deal with any deficiencies in renewable power production. It is through the same calculations that HOMER will determine the optimal solution (types, numbers, and sizes of components) that will meet the demand for each village at the minimal cost while paying attention to the physical constraints specified.
Figure 6. Systems’ design architecture
3. Results and Discussion
3.1. Simulation and optimization results
As alluded to in the previous sections, the study used the HOMER software to design power generation systems for electrifying three remote villages, Chigunda, Mdyaka, and Kadzuwa, located in Malawi. The systems were to assist in improving electricity access in these communities. The HOMER software strived to determine the optimal components’ combination capable of satisfying the electricity demand at minimum cost through simulation and optimization. The basis for this task was derived from the specified system components, their sizes, and costs. Through simulation, HOMER determined the optimal components’ combination to meet the electrical load and ranked the results in increasing NPC and COE values. present the optimization results for the target villages which were extracted from the HOMER output. In these tables, the uppermost row represents the characteristics of the systems in terms of components type, dispatch strategy, and the economic parameters. Each of the subsequent rows is treated as a case of an energy system to be considered for electrification and is determined through simulation. The system in the top row of the subsequent rows for each village is the optimal one.
Table 2. Categorized optimization results for Chigunda
Table 3. Categorized optimization results for Mdyaka
Table 4. Categorized optimization results for Kadzuwa
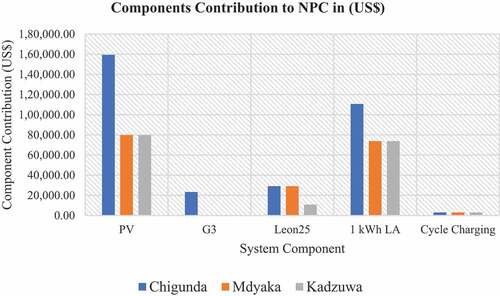
With reference to , based on the criteria established beforehand, it is clear that the optimal system configuration for Chigunda comprises a 60-kW PV, a 3-kW wind, 100 LA batteries, and one Leon25 converter with the cycle charging strategy. This optimal combination has NPC and COE values of US$ 325,509 and US$ 0.635, respectively. reveals that for Mdyaka, the most feasible system consists of a 30-kW PV, 100 LA batteries, and one Leon25 system converter. This system having NPC of US$ 167,213 and COE of US$ 0.625 also subscribes to the cycle charging dispatch strategy. Finally, for Kadzuwa (), the most favorable energy system option based on the specified conditions seems to be a combination of 30 kW PV, 100 LA batteries and one Leon25 system converter. As shows, the indicative NPC and COE values for this system are US$ 185,611 and US$ 0.743, respectively. Although we have generated these results in HOMER, it is imperative that we compare them to the real conditions on the ground. In Malawi, electricity presently sells at US$ 0.12/kWh (Egenco, Citation2018). There is, therefore, a huge disparity between the COE that results from the designed systems and the actual market value for the electricity. This casts some doubt on the economic feasibility of the systems. Let us now consider the worst-case electrification scenario whereby the DG-battery system is considered for deployment. tells us that by using the optimal system, we reduce the NPC by approximately 800%. and 5 also report a reduction in NPC by 1500% and 1300%, respectively, when the optimal system is given consideration, unlike DG. Pertinent to the NPC are the contributions of each component to the overall value. illustrates this phenomenon by graphically presenting the cost shares for each component. Dwelling on these graphs, it is apparent that in all the scenarios, the greatest contributors to the NPC value over the lifetime of the project are the PV and LA batteries. Consequently, this implies that a huge part of the O&M and replacement costs will be incurred in keeping these two components at bay.
Figure 7. Components’ cost contribution to NPC by village
3.2. Electrical analysis
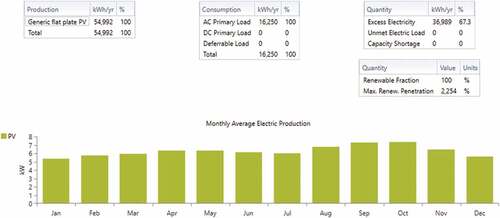
Another critical consideration pertains to the electrical properties of the optimal system configurations. .elucidate this point further. A keen scrutiny of these details divulges some relevant information as well. In general, the systems in all the communities are having 100% renewable energy penetration, low fraction of unmet electric load, and low proportion of capacity shortage. The same figures also indicate that the monthly electricity production is predominantly from PV though for Chigunda, wind energy also seems to make a small contribution. This again begs the question as to whether hybridizing PV with wind is really the best option for Chigunda. The figures also show that there are large fractions of excess electricity in all cases. This justifies the need to increase the number of batteries in order to maximize energy storage.
Figure 8. Optimal system’s electrical properties for Chigunda
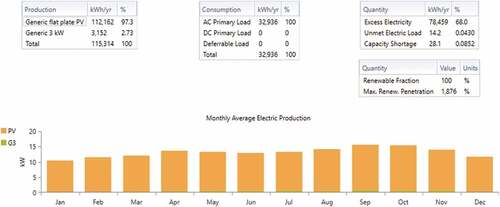
Figure 9. Optimal system’s electrical properties for Mdyaka
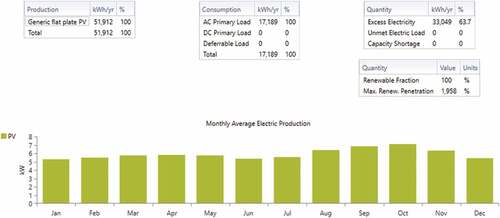
Figure 10. Optimal system’s electrical properties for Kadzuwa
3.3. Sensitivity analysis
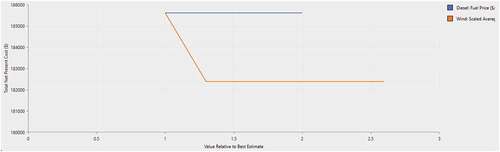
The plots in are response curves representing the sensitivity of optimal systems’ NPC to changes in wind velocities and fuel prices for each community. In accordance with these figures, the NPC of the optimal systems appears to respond more to changes in the wind velocity. This is based on the steepness of the slopes of these curves. The implication is that adequate resources need to be allotted in establishing accurate wind velocity readings for the study sites.
Figure 11. Sensitivity spider plot for Chigunda
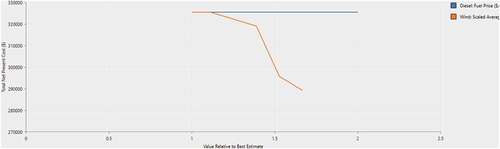
Figure 12. Sensitivity spider plot for Mdyaka
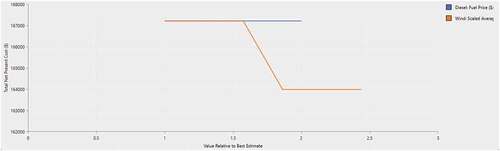
Figure 13. Sensitivity spider plot for Kadzuwa
Taking cognizance of the results presented by Ataei et al. (Citation2015), we note that the findings on the optimal system architecture tally with those for Chigunda while they disagree with those for Mdyaka and Kadzuwa. The NPC and COE values are however in complete disarray with the findings in . While the NPC value of US$ 70,358 for the optimal system informed by the previous study are lower compared to the NPC values of all optimal systems under consideration in this study, the COE of US$ 2.693 informed by the very same study is very high when compared with the COEs of all the optimal systems in this study. In comparison with the results obtained by Al-Sharafi et al. (Citation2017), we also observe that the PV-wind-battery system was favorable, the same for Chigunda but not for Mdyaka and Kadzuwa. Comparatively, the COE of US$ 0.609 is, however, slightly lower when gauged against the results for our cases. Judging our findings based on the study by Hossain et al. (Citation2017), it also appears that the PV-wind-battery system also satisfies the set conditions, the same which holds true for Chigunda but not for Mdyaka and Kadzuwa. Unlike our cases having very low life cycle costs, the system in the other study had life cycle cost of US$ 17.15 m and was producing electricity at a very lower cost of US$ 0.279 per kilowatt-hour. Considering the results brought forward by Bogaraj et al. (Citation2015), we also realize that the PV-wind-battery system with NPC of US$ 1,503,129 and COE of US$ 0.344 was deemed reliable for deployment. These results on optimal configuration are again in agreement with those for Chigunda though they contradict the findings for Mdyaka and Kadzuwa. While the NPC is way above the values for the optimal systems in the current study, the COE is almost 50% less than the values found in this study. Another observation worth mentioning is that while the DG is favored as one of the principal components in optimal systems in studies by (Das et al., Citation2017; Basir Khan et al., Citation2015; Olatomiwa et al., Citation2015; Mandal et al., Citation2018 & Murugaperumal & Vimal, Citation2019), this component is missing in the optimal systems under the current study. The most plausible arguments for these observed differences are as follows. Differences in renewable resource availability have an influence on HOMER outputs. Proximity to components manufacturers also reduces the capital and replacement costs, which in turn minimizes the NPC and COE values. Differences in diesel availability and prices also contribute to dwindling NPC and COE values. Although wind energy contributed meaningfully to the satisfaction of the peak energy demand in Chigunda, the general outlook appears to suggest that the PV technology is ideal. The points to the fact that just like wind velocity data, considerable investment also needs to be made in establishing accurate solar radiation data. The feasibility of the designed systems could also be improved through provision of tax cushions on renewable energy components. This could substantially reduce the initial capital invested which could in turn reduce the NPC and COE.
4. Conclusions
In the current study, HRESs for electrifying Malawi’s rural villages of Chigunda, Mdyaka, and Kadzuwa were designed and tested for technical and economic suitability. HOMER is employed as a simulation, optimization, and sensitivity analysis tool under wind velocity and diesel price constraints. There is therefore a huge disparity between the COE that results from the designed systems and the actual market value for the electricity. follows:
The optimal systems realized in this study had maximum renewable energy penetration (100%) in all the cases considered. This means that by deploying these systems, emission of toxic greenhouse gases could be minimized.
Substantial cost savings were being achieved by considering the deployment of renewable systems as compared to using diesel generators.
Systems’ economic performance in terms of net present value was responding negatively to changes in wind velocity and diesel pump prices over the course of the project's lifetime.
Disclosure statement
The author(s) declare no conflicts of interest.
Additional information
Funding
Notes on contributors

Clement Malanda
Clement Malanda holds MSc in Energy Studies (Renewable Energy) form Moi University, Kenya. His research interests concern techno-economic modeling of energy systems.
Augustine B. Makokha
Augustine B. Makokha received his MEng and DEng from the University of Witwatersrand, South Africa. His research interests are; renewable energy engineering and applied CFD modeling.
Charles Nzila
Charles Nzila holds MEng and DEng from the University of Ghent, Belgium. His research areas are energy access enhancement and cleaner energy production.
Collen Zalengera
Collen Zalengera holds MEng and DEng in renewable energy from the University of Loughborough, UK. His research interest are; energy and sustainable livelihoods, energy systems techno-economic and financial modeling.
This research relates to wider issues or projects by generating comprehensive results which will inform policy formulation aimed at improving energy access in marginalized areas. The research also contributes to the current literature on maximization of energy production from renewable sources while keeping emissions at their lowest.
References
- Al-Sharafi, A., Sahin, A. Z., Ayar, T., & Yilbas, B. S. (2017). Techno-economic analysis and optimization of solar and wind energy systems for power generation and hydrogen production in Saudi Arabia. Renewable and Sustainable Energy Reviews, 69(2017), 33–20. https://doi.org/10.1016/j.rser.2016.11.157. November2016.
- Ataei, A., Choi, J., Rashidi, R., Nedaei, M., & Kurdestani, E. (2015). Simulation and Optimization of a Wind/PV/Battery hybrid power system for a commercial building. American Journal of Renewable and Sustainable Energy, 1(3), 133–139. http://www.aiscience.org/journal/ajrseSimulation
- Baneshi, M., & Hadianfard, F. (2016). Techno-economic feasibility of hybrid diesel/PV/wind/battery electricity generation systems for non-residential large electricity consumers under southern Iran climate conditions. Energy Conversion and Management, 127, 233–244. https://doi.org/10.1016/j.enconman.2016.09.008
- Basir Khan, M. R., Jidin, R., Pasupuleti, J., & Shaaya, S. A. (2015). Optimal combination of solar, wind, micro-hydro and diesel systems based on actual seasonal load profiles for a resort island in the South China Sea. Energy, 82, 80–97. https://doi.org/10.1016/j.energy.2014.12.072
- Belmili, H., Haddadi, M., Bacha, S., & Fayçal, M. (2014). Sizing stand-alone photovoltaic – Wind hybrid system: Techno-economic analysis and optimization. Renewable and Sustainable Energy Reviews, 30, 821–832. https://doi.org/10.1016/j.rser.2013.11.011
- Bogaraj, T., Kanakaraj, J., & Kumar, K. (2015). Optimal sizing and cost analysis of hybrid power system for a stand-alone application in Coimbatore region: A case study. Archives of Electrical Engineering,64(1), 139–155. https://doi.org/10.1515/aee-2015-0013
- Das, B. K., Hoque, N., Mandal, S., Pal, T. K., & Raihan, M. A. (2017). A techno-economic feasibility of a stand-alone hybrid power generation for remote area application in Bangladesh. Energy, 134, 775–788. https://doi.org/10.1016/j.energy.2017.06.024
- Diab, F., Lan, H., Zhang, L., & Ali, S. (2016). An environmentally friendly factory in Egypt based on hybrid photovoltaic/wind/diesel/battery system. Journal of Cleaner Production, 112(July), 3884–3894. https://doi.org/10.1016/j.jclepro.2015.07.008
- Diaf, S., Notton, G., Belhamel, M., Haddadi, M., & Louche, A. (2008). Design and techno-economical optimization for hybrid PV/wind system under various meteorological conditions. Applied Energy, 85(10), 968–987. https://doi.org/10.1016/j.apenergy.2008.02.012
- Diemuodeke, E. O., Addo, A., Dabipi-Kalio, I., Oko, C. O. C., & Mulugetta, Y. (2017). Domestic energy demand assessment of coastline rural communities with solar electrification. Energy and Policy Research, 4(1), 1–9. https://doi.org/10.1080/23815639.2017.1280431
- Diemuodeke, E. O., Addo, A., Oko, C. O. C., Mulugetta, Y., & Ojapah, M. M. (2019). Optimal mapping of hybrid renewable energy systems for locations using multi-criteria decision-making algorithm. Renewable Energy, 134, 461–477. https://doi.org/10.1016/j.renene.2018.11.055
- Egenco. (2018). Electricity Generation in Malawi. Retrieved April 30, 2019, from www.egenco.mw
- Feron, S. (2016). Sustainability of Off-Grid photovoltaic systems for rural electrification in developing countries: a review. Sustainability, 8(12), 1326. https://doi.org/10.3390/su8121326
- Hossain, M., Mekhilef, S., & Olatomiwa, L. (2017). Performance evaluation of a stand-alone PV-wind-diesel-battery hybrid system feasible for a large resort center in South China Sea, Malaysia. Sustainable Cities and Society, 28, 358–366. https://doi.org/10.1016/j.scs.2016.10.008
- Hosseinalizadeh, R., Shakouri, G., . H., Amalnick, M. S., & Taghipour, P. (2016). Economic sizing of a hybrid (PV-WT-FC) renewable energy system (HRES) for stand-alone usages by an optimization-simulation model: Case study of Iran. Renewable and Sustainable Energy Reviews, 54, 139–150. https://doi.org/10.1016/j.rser.2015.09.046
- IEA, IRENA, UNSD, W. & W. (2019). Tracking SDG 7: The energy progress report.
- Justo, J. J., Mwasilu, F., Lee, J., & Jung, J. W. (2013). AC-microgrids versus DC-microgrids with distributed energy resources: A review. Renewable and Sustainable Energy Reviews, 24(C), 387–405. https://doi.org/10.1016/j.rser.2013.03.067
- Kanase-Patil, A. B., Saini, R. P., & Sharma, M. P. (2011). Development of IREOM model based on seasonally varying load profile for hilly remote areas of Uttarakhand state in India. Energy, 36(9), 5690–5702. https://doi.org/10.1016/j.energy.2011.06.057
- Krishan, O., & Sathans. (2018). Design and techno-economic analysis of a HRES in a rural village. Procedia Computer Science, 125, 321–328. https://doi.org/10.1016/j.procs.2017.12.043
- Lambert, T., Gilman, P., & Lilienthal, P. (2006). Micropower System Modeling with Homer. Integration of Alternative Sources of Energy, 379–418. https://doi.org/10.1002/0471755621.ch15
- Leonics. (2018). APOLLO M-410 single phase bidirectional dual mode hybrid inverter for mini-grid system.
- Lim, J. H. (2012). Optimal combination and sizing of a new and renewable hybrid generation system. International Journal of Future Generetaion Communication and Networking, 5(2). https://www.earticle.net/Article/A20791
- Malanda, C., Makokha, A. B., Nzila, C., & Zalengera, C. (2020). Sustainability evaluation of hybrid renewable electrification alternatives in Malawi ’ s villages using a multi-criteria approach. Energy & Power, 10(1), 11–19. https://doi.org/10.5923/j.ep.20201001.02
- Mandal, S., Das, B. K., & Hoque, N. (2018). Optimum sizing of a stand-alone hybrid energy system for rural electrification in Bangladesh. Journal of Cleaner Production, 200, 12–27. https://doi.org/10.1016/j.jclepro.2018.07.257
- Muh, E., & Tabet, F. (2019). Comparative analysis of hybrid renewable energy systems for off-grid applications in Southern Cameroons. Renewable Energy, 135(C), 41–54. https://doi.org/10.1016/j.renene.2018.11.105
- Murugaperumal, K., & Vimal, P. A. D. (2019). Feasibility design and techno-economic analysis of hybrid renewable energy system for rural electrification. Solar Energy, 188(February), 1068–1083. https://doi.org/10.1016/j.solener.2019.07.008
- Olatomiwa, L., Mekhilef, S., Huda, A. S. N., & Sanusi, K. (2015). Techno-economic analysis of hybrid PV–diesel–battery and PV–wind–diesel–battery power systems for mobile BTS: The way forward for rural development. Energy Science and Engineering, 3(4), 271–285. https://doi.org/10.1002/ese3.71
- Rozlan, M. B. M., Zobaa, A. F., & Aleem, S. H. E. A. (2011). IThe optimisation standalone hybrid renewable energy systems using HOMER o. International Review of Electrical Engineering, 6(July), 1802–1811.
- Sandeep, L., & Atul, R. (2012). Techno-economic analysis of a hybrid mini-grid system for Fiji islands. International Journal of Energy and Environmental Engineering, 3(10). 1-10. htttp://www.journal-ijeee.com/content/3/1/10
- Taulo, J., Gondwe, K., & Sebitosi, A. (2015). Energy supply in Malawi: options and issues. Of Energy in Southern Africa, 26(2), 19–32. https://doi.org/10.17159/2413-3051/2015/v26i2a2192
- UNDP. (2015). Sustainable development goals, 24. https://doi.org/10.1017/CBO9781107415324.004
- Vendoti, S., Muralidhar, M., & Kiranmayi, R. (2020). Techno-economic analysis of off-grid solar/wind/biogas/biomass/fuel cell/battery system for electrification in a cluster of villages by HOMER software. Environment, Development and Sustainability, 23, 351-372. https://doi.org/10.1007/s10668-019-00583-2
- WHO. (2009). the energy access situation in developing countries. UNDP WHO New York, 142. http://scholar.google.com/scholar?hl=en&btnG=Search&q=intitle:THE+ENERGY+ACCESS+SITUATION+IN+DEVELOPING+COUNTRIES+A+Review+Focusing+on+the#0
- World Bank. (2019). The World Bank Malawi-electricity access project ( P164331), 1–18 http://documents.worldbank.org/curated/en/313871549533419539/pdf/Concept-Project-Information-Document-Integrated-Safeguards-Data-Sheet-Malawi-Electricity-Access-Project-P164331.pdf
- Zalengera, C. (2015). A study into the techno-economic feasibility of photovoltaic and wind generated electricity for enhancement of sustainable livelihoods on likoma island in malawi. PQDT - UK & Ireland. Loughborough. http://ezphost.dur.ac.uk/login?url=https://search.proquest.com/docview/1774182153?accountid=14533%0Ahttp://openurl.ac.uk/ukfed:dur.ac.uk?genre=dissertations+%26+theses&=&title=A+study+into+the+techno-economic+feasibility+of+photovoltaic+and+wind+gener