
 ?Mathematical formulae have been encoded as MathML and are displayed in this HTML version using MathJax in order to improve their display. Uncheck the box to turn MathJax off. This feature requires Javascript. Click on a formula to zoom.
Abstract
Fuel dilution is commonly used to reduce soot emissions from combustion engines or control carbon black morphology during fuel pyrolysis. Dilution has both physical and chemical effects on soot formation; however, the impact of fuel dilution on each soot formation process has not been fully understood yet. This study investigates the differing effects of dilution with H2 and N2 on particle inception and surface growth by hydrogen abstraction carbon addition (HACA) and polycyclic aromatic hydrocarbon (PAH) adsorption in ethylene/air laminar coflow diffusion flames. Applicable correlations are introduced to predict the conversion of carbon to soot to an accuracy of 96.5% at different dilution ratios. Both diluents result in significant reductions in HACA and PAH adsorption, up to 42% and 68%, respectively, at 40% dilution, with greater reductions for dilution with N2. For replacement cases, more reduction comes from a considerable change in the flame length, resulting in reduced high-temperature particle residence time. Combined, these effects significantly reduce HACA and PAH adsorption by up to 85% and 60%, respectively, for mixed replacement. Reduced acetylene and PAH concentrations for both gases, respectively, reduce HACA and PAH adsorption rates. Earlier in the flame, reduced PAH formation in the inception zone of the flame results in lower inception rates, producing fewer primary particles for subsequent growth processes. Comparing the two diluents, N2 reduces acetylene and PAH concentrations by 12% and 18%, respectively, more than H2, and delays PAH formation in the flame, which delays inception and surface growth.
1. Introduction
Reducing soot emissions and controlling carbon black yield during pyrolysis have been two main drivers of research on combustion-made carbonaceous nanoparticles. One way to achieve these goals is by adding diluent species to the fuel stream (addition) or replacing part of the fuel stream (replacement). Abhinavam Kailasanathan et al. (Citation2013) measured soot precursor species in ethylene laminar coflow diffusion flames with four diluents (Ar, He, N2, and CO2) at elevated pressures. The CO2 diluted flame had the lowest precursor concentrations that were three times less than that of the He diluted flame. They have also directly investigated the effect of these diluents on soot volume fraction (fv) and confirmed that CO2 has the highest soot suppression effect, while He results in higher temperature and soot fv. This increase in temperature and soot was determined to be caused by the higher thermal diffusivity of He (Kailasanathan et al., Citation2014). They concluded that lower soot yield is a result of increased oxidation rates rather than a reduction in precursor formation. Al-Qurashi et al. (Citation2011) examined the effect of simulated Exhaust Gas Recirculation (EGR) via the addition of CO2 species on an ethylene diffusion flame and engine intake. They reported a significant thermal effect of CO2 on soot reactivity, a dilution effect that delays soot formation, and a chemical effect that suppresses the formation of large aromatic structures. The dilution effect of H2 and CO2 has also been investigated in flat premixed flames such as McKenna flames (De Iuliis et al., Citation2012; Naseri et al., Citation2017; Tang et al., Citation2016) with comparable findings to the coflow flames. Zhao et al. (Citation2014) investigated ethylene laminar coflow diffusion flames with He and H2 dilution and reported a reduction in soot number density and fv by adding either He or H2 diluents. This reduction was higher for replacement cases with up to 66% reduction in soot number density compared to the undiluted fuel flame. Ju et al. (Citation2005) investigated the effects of N2 dilution on soot formation in an inverse diffusion ethene flame and measured concentrations of polycyclic aromatic hydrocarbon (PAH), soot C/H ratio, and primary particle diameters to show reduced soot growth in the primary reaction zone. Sun et al. (Citation2017) used laminar coflow diffusion flames of ethylene diluted with H2 and N2. Soot volume fraction and primary particle size measured by time-resolved LII (TiRe-LII) and flame temperature measured by two-line atomic fluorescence (TLAF) thermometry showed significant reduction for dilution with either diluent, with greater reduction for N2 dilution and replacement. Soot formation in N2 diluted ethylene diffusion flames has also been investigated at elevated pressures (Joo & Gülder, Citation2011; Liu et al., Citation2015). Comparable effects have been observed on the separated soot formation mechanisms with other nitrogenous diluents like ammonia (Shao et al., Citation2022). Overall, the measurements display the general trend that CO2 dilution results in the greatest soot reductions, followed by N2 and H2 dilution, due to strong thermal and chemical effects.
Thus far, numerical simulations have focused on understanding the relative contributions of physical dilution, thermal, and chemical effects of diluents on soot formation by investigating N2 and CO2 dilution. Zhang et al. (Citation2018) investigated the effects of N2 and CO2 on the oxidizer (O2) flow of ethylene laminar coflow flames and reported soot reduction for both N2 and CO2, with a higher effect for CO2 (for a maximum of 74% at fv peaks) as a result of higher heat capacity. They concluded that the chemical effect of CO2 enhances the oxidation of critical soot precursor species through increasing oxidizing species of O and OH. This chemical effect has been examined by Wang and Chung (Citation2016) by introducing fictitious CO2 as a chemically inert species in a counterflow ethylene flame. More numerical studies regarding the chemical effects of CO2 have been conducted so far with similar findings (Gu et al., Citation2016; Liu et al., Citation2001). Numerical studies regarding N2 dilution have indicated similar reducing effects of dilution on overall soot formation at atmospheric and high pressures (Liu et al., Citation2015; Smooke et al., Citation2005).
There have been numerical studies regarding the effects of H2 dilution on soot formation focusing on the chemical versus thermal effects as well. Previous kinetic analyses have shown the chemical effects on different species production, including important precursor species such as C2H2 (Liu, Citation2014). In an early attempt to extract the chemical effect of H2 dilution, Guo et al. (Citation2006) investigated an ethylene coflow flame diluted with He or H2. As He is a chemically inert gas, the chemical effect of H2 has been assigned to the difference between He and H2 results, showing that the chemical effect has the same order of effect on soot fv as the dilution effect. Ying and Liu (Citation2015) studied the H2 effect as a fuel additive in a methane premixed flame. They reported that the chemical effect opposed the dilution and thermal effects that acted to reduce the formation of radicals. However, the chemical effect enhances the dilution and thermal effects of reducing C2H2 concentrations. Park et al. (Citation2011) investigated the effects of H2 addition on soot formation in laminar premixed C2H2 flames, with H2 volume fraction varying from 10% to 50%. Although their model did not explicitly track the soot hydrogen content, they concluded that the abundance of H2 molecules in the flame decreases soot surface active sites and consequently less particle growth. The effect of H2 dilution on soot precursor species was investigated by F. Wang et al. (Citation2015) in a study of hot ethylene coflow flames. The simultaneous effect of H2 and other diluents has also been numerically investigated by Gu et al. (Citation2016) and Wang et al. (Citation2018) in ethylene laminar coflow flames. Both studies have shown favorable dilution and chemical effects of H2 on soot reduction, with a maximum of 35% reduction in peak soot fv at 50% H2 dilution. The separation of chemical and dilution effects of H2 has been investigated in a recent study by Qiu et al. (Citation2020) by introducing a set of virtual species for a step-by-step decoupling of the chemical and thermal effects. Their results report a reducing influence from dilution and thermal effects, while the chemical effect of H2 leads to higher soot formation through enhanced soot precursor formation. Similar work by Wang et al. (Citation2021) showed that the chemical pathways leading to the formation of A1 aromatic rings are enhanced by the chemical effect of H2 addition to methane and ethylene laminar diffusion flames. Similar behavior has been reported in premixed methane flames (Do et al., Citation2021). A summary of the above works of literature concerning the effects of N2 and H2 in diffusion flames is also provided in a more compact form in Table .
Table 1. Works concerning effects of N2 and H2 in diffusion flames
Overall, numerical investigations have focused on the effect of N2 and H2 dilution in isolation, rather than investigating the differences between these two diluents. Additionally, the focus has been on the differentiation of the physical dilution versus chemical effects of these diluents, rather than the effects on individual soot formation steps. Previous attempts have implemented different modeling approaches for the prediction of the dilution process (Khanehzar et al., Citation2022; Yen et al., Citation2019). However, in order to capture and compare the exact pathways of diluents’ effects on the soot formation mechanisms, soot models with refined and physics-based submodels are required. In this study, the differing effects of H2 and N2 dilution on the soot formation mechanisms of inception, HACA, and PAH adsorption surface growth in laminar ethylene/air coflow flames are investigated. For this purpose, a soot model is utilized that for the first time integrates the fundamentally improved submodels including the reversibility of inception and PAH adsorption, the physical phenomenon of surface shell formation, and refined tracking of hydrogen and PAHs that improves the prediction accuracy of PAH adsorption and HACA processes. Also, for a practical aim, the results are concisely interpreted in the form of two applicable correlations.
2. Flame and model description
2.1. Flame and geometry
The flames chosen for this investigation are the steady, non-smoking, co-flow diffusion flames studied by Sun et al. (Citation2017. The flames are part of the international sooting flame (ISF) directory and are available as ISF-4 linked co-flow flames 2: Santoro-Adelaide burner. The burner has a fuel tube with an internal diameter of 10.5 mm surrounded by the oxidizer channel both discharging laminarly into atmospheric pressure with Reynolds numbers of less than 53. Different fuel stream flow rates are considered ranging from 0.207 to 0.518 liters per minute with a constant air supply rate. There are two sets of addition and replacement cases with varying volumes of H2 and N2 dilution. In cases with diluent addition, diluent gas is added to the fuel stream resulting in a higher flow rate. In replacement cases, the flow rate is held constant, while a volumetric percentage of the flow is replaced with the diluent. One of the main reasons to include two sets of addition and replacement dilution is to better separate the direct effect of the diluents from their effect on the flame geometry. While the replacement method simultaneously changes the flame geometry and the fuel composition, addition method maintains a constant geometry with changed fuel composition. It will later be discussed how the difference affects the important parameter of temperature–time history in the evolution of soot particles. A total of 14 flames with different ethylene/H2/N2 volumetric combinations are considered with 0%, 20%, 30%, and 40% of H2 or N2 dilution as well as mixed dilution with 20% N2 and 40% H2. It should be noted that the two undiluted flames in the addition and replacement sets have different ethylene flow rates. A summary of the flame conditions, ethylene/diluent concentrations, and flow rates are presented in Table .
Table 2. Flame conditions and fuel concentrations
2.2. Numerical model
The CoFlame code (Eaves et al., Citation2015, Citation2016), is utilized for discretization and solution of the governing equations and modeling of soot formation. The code solves the coupled transport equations of mass, momentum, energy, gas-phase chemical species, as well as soot aggregate number density, soot primary particle number density, and soot particle hydrogen number density. The chemical kinetic mechanism used for this investigation is the one originally presented in Eaves et al. (Citation2016). The solution method considers the discrete-ordinates method (DOM) to account for the radiation modeling (Eaves et al., Citation2016).
The computational domain for this investigation contains an axisymmetric field extending 13.7 cm in the axial and 4.7 cm in the radial direction. The computational domain does not include the fuel tube or conjugate heat transfer as results from these flames were not sensitive to this choice (Eaves et al., Citation2013). A top-hat velocity profile is used for the fuel and air inlets with zero gradient and free-slip boundary conditions at the outflow and outer radial boundary, respectively. Discretization of the governing equations is implemented using the finite volume method on a staggered grid. For this purpose, the computational domain is divided into 200 (z) × 86 (r) non-uniform control volumes. Due to the steady-state nature of the flame, pseudo-transient continuation is used to aid the convergence of the solution with convergence criteria of 0.001 residual for each variable.
The soot particle dynamics model is solved via a quasi-3D fixed sectional method with 35 logarithmically spaced sections. With the assumption of soot aggregates consisting of spherical identical soot primary particles, three transport equations of soot aggregate number density, primary particle number density, and soot hydrogen number density are solved within each section (Kholghy et al., Citation2016). The processes of inception, PAH adsorption, HACA surface growth, surface oxidation, coagulation, fragmentation, particle diffusion, and thermophoresis are included in the soot model. The soot model includes reversible inception (Eaves et al., Citation2017) with chemical bond formation (Kholghy et al., Citation2018), equilibrium-based PAH adsorption (Veshkini et al., Citation2016), hydrogen tracking to calculate surface hydrogen availability, surface shell formation (Kholghy et al., Citation2019, Citation2016), and HACA surface growth with an alpha of 0.5 for the portion of active soot particle surface sites available for chemical reactions (Eaves et al., Citation2016). It should be noted that only three PAHs (benzo-a-pyrene, benzo-a-pyrene radical, and benzo[ghi]fluoranthene) are assumed to participate in soot inception and PAH adsorption, and the impact of smaller PAHs is not considered (Eaves et al., Citation2015). A detailed description of the sectional method transport equations, solution methodology, and chemical mechanisms can be found in (Eaves et al., Citation2016).
3. Results and discussion
A total of 14 laminar co-flow flames of ethylene diluted with varying amounts of H2 and N2 for replacement and addition cases are simulated. This section starts with a comparison of the simulated results with measurements of flame temperature, soot volume fraction, and primary particle diameter (3.1). The comparison is followed by a discussion of diluents’ effects on soot formation mechanisms in terms of affected formation process rates, precursor species, and chemical pathways while differentiating the effects of N2 and H2 dilution (3.2).
3.1. Assessment of numerical model performance
3.1.1. Temperature
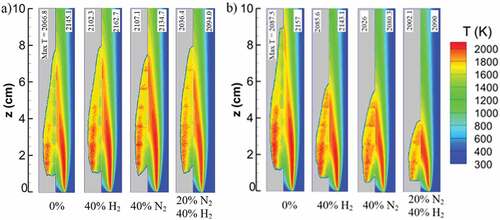
Figure compares computed and measured (Sun et al., Citation2017) flame temperatures. Temperature data for the blue regions of the experimental side are not available and are not meant to represent low-temperature measurements. A comparison of the available regions shows acceptable agreement with the simulation results in terms of flame size and temperature distribution in the flame area. The reported temperature measurements are not corrected for soot radiation and have an uncertainty range of ±100 K. Therefore, the assessment of the numerical results is limited to qualitative trends for different diluents and dilution amounts, while the simulations have a quantitative difference of less than 80 K based on the maximum temperature, which is within the experimental uncertainty range. Similar comparisons for other dilution concentrations are available in the supplemental material (Figure A1).
Figure 1. Comparison of simulated temperature profiles (right half) with measurements (Sun et al., Citation2017; left half) of undiluted and diluted flames with addition cases (a) and replacement cases (b). The data only exists for limited portions of the flame area with an uncertainty of ±100 K without correction for radiation. However, for the available parts, simulated temperature qualitatively agrees with the experimentally observed changes with different dilution cases.
3.1.2. Soot volume fraction
The simulations are further compared by the measurements of soot volume fraction (fv) for undiluted and diluted flames shown in Figure , with further comparisons of 2D contours in the supplemental material (Figure A2). Figure compares computed (lines) and measured (dots) soot fv along the flame wings and centerline. Here, the flame wing is considered as a line passing through the maximum soot fv at each axial height. For the wings (Figure top), trends of the soot distribution are well predicted regarding the onset of the flame, peak points, and minor variations downstream of the peak. The predicted reduction of soot fv by dilution is also in good agreement for H2 and N2 in both addition and replacement cases. A slight flame height overprediction of less than 5 mm is observed at the flame top points with the degree of overprediction decreasing for diluted flames. Simulation peak fv is within 22% of the measurements. The axial location of peak fv is similar but the magnitude of fv decreases with diluent addition. This decrease is more evident for N2 and mixed cases. While 40% H2 addition reduces peak fv by 22%, 40% N2 and mixed additions reduce it by 34% and 48%, respectively. However, for replacement cases, flame height, and consequently the height of the peak fv decrease significantly. For example, the flame height decreases from 11 cm to less than 4 cm when 20% N2 and 40% H2 replace the pure ethylene in the fuel inlet. This effect is also associated with a greater reduction in soot fv for diluent replacement compared to the addition cases. For instance, a reduction of 5.7 ppm in peak soot fv is predicted for the 20% N2 and 40% H2 replacement case. Similar to addition cases, replacement dilution with N2 is again slightly more effective in soot reduction compared to H2 dilution.
Figure 2. Computed (lines) and measured (symbols; Sun et al., Citation2017) soot volume fraction on flame wing (a,b) and centerline (c,d) at different heights above the burner for H2, N2 and mixed addition and replacement. Simulations capture the overall soot distribution through the flame height, peak point position and smaller variations downstream of the flames. Simulated flame positions are slightly higher than the measurements, approximately less than 5 mm (see supplemental material). The predicted peak values for flames wing and centerline are within 22% and 43% of the experimental data, respectively.
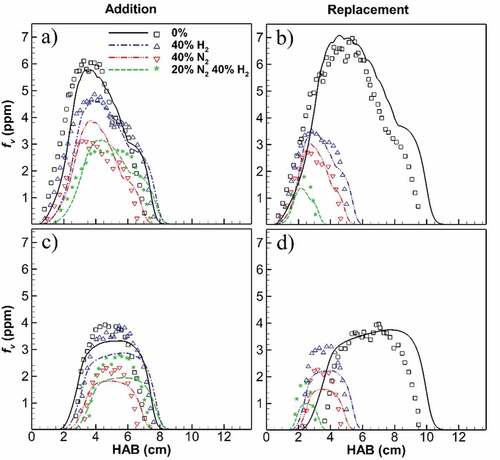
For the flame centerline (Figure bottom), a good agreement with measurements is demonstrated as well for fv. The simulated results are within 43% of measurements based on the peak soot fv values. Trends of soot distribution through the flame height and soot reduction with dilution are predicted well. A slight overprediction of height is seen at flame onset (HAB = 2 to 3.5 cm) and flame top (HAB = 4 to 10.5 cm) with differences from 0.3 to 1 cm. Similar to the wing results, N2 dilution shows more reduction in soot fv compared to H2 dilution for both addition and replacement cases. Moreover, replacement results in lower soot fv and causes flame height to reduce and centerline portion to shift downwards, closer to the burner. These effects are correctly captured by the simulation results.
3.1.3. Particle size
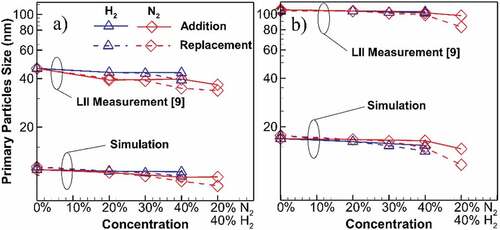
Figure compares the reduction in the maximum soot primary particle diameter (dp) at the centerline and the entire flame for addition and replacement cases on a log scale. At first glance, there is a gap between the measurement and simulation results by an order of magnitude. The experimental reference explicitly explains the large uncertainties of the LII method that leans towards larger dp due to uncertainties arising from experiments (e.g., non-ideal spatial and temporal profile of laser beam) and assumptions in the LII models (e.g., non-aggregated and mono-dispersed particles), as well as inherent uncertainties of the LII models (Sun et al., Citation2017). These known uncertainties result in larger dp, which are more representative of a nonlinear combination of primary particle size and the number of primaries per aggregate (Boiarciuc et al., Citation2006). Despite high over-predictions associated with the LII measurement, the trends of the dilution effect can be an effective factor in the assessment of the simulation results. For both centerline and entire flames, the reducing trend of dp due to the dilution is properly captured for both H2 and N2 cases. In fact, if both measurement and simulated results are normalized with their dp of undiluted flame, simulations correctly capture the changes for both H2 and N2, with the results being within 8% of the measurements. Dilution with N2 shows a greater effect on dp reduction at a maximum of 7%. Also, replacement results in a higher reduction in dp with a maximum of 10%. A normalized version of the data in this figure is also available in supplemental material (Figure A3).
Figure 3. Comparison of the maximum soot primary particle diameter (dp) for diluted and undiluted flames at the location of (a) centerline (b) entire flame. High overpredicting uncertainties of the LII measurements (Sun et al., Citation2017) results in bigger dp values. However, simulation accurately captures the trend of changes for H2 and N2 cases with the results being within 8% of the experiment if normalized by their undiluted dp. Primary particle size reduces with dilution and a higher reduction recorded for N2 dilution. Replacement cases result in greater reduction compared to additions.
3.2. Effect of H2 and N2 dilution on soot formation mechanisms
3.2.1. Integrated process rates
To understand the effect of H2 and N2 dilution on the soot formation mechanism, the mass gains through the processes of inception, HACA surface growth, and PAH adsorption are separately followed on the path line of a particle starting its path from the burner to the top end of the flame. The gained mass is calculated through time integration of each formation rate (g/cm3s) on its path, which will be termed accumulated mass. For easier comparison of the diluted cases, each process’s accumulated mass is normalized by the corresponding value from the undiluted flame.
Figure shows normalized accumulated mass for the flame wings and centerline. For the wing, it is observed that H2 dilution enhances mass accumulation by inception with a positive slope in addition cases, while N2 reduces mass accumulation. The HACA and PAH adsorption mass contributions reduce for both dilution cases, with greater reductions for PAH adsorption with a maximum of 27%. The degree of the reductions increases for N2 dilution and replacement cases. Mixed dilution cases have the greatest reduction in accumulated masses. For instance, the PAH adsorption ratio drops to less than 0.4 for 40% N2 replacement and 0.15 for mixed replacement (40% H2 and 20% N2). With these results, it is understood that H2 and N2 have both resulted in lower soot by reducing the surface growth processes.
Figure 4. Ratio of the accumulated soot mass from 3 processes in the diluted flames to the values of undiluted flame, at flame wing (a, b) and centerline (c, d). At the wing, slight inception growth occurs for H2 dilution with positive slope in addition cases, while it is reducing for N2 dilution. Both HACA and PAH adsorption mass contributions reduce for all dilution cases, with greater reductions for PAH adsorption. At flame centerline, except for H2 addition where HACA shows a slight increase, all other processes decrease for all cases. At wing and centerline, the degree of the reductions increases for N2 dilution and replacement cases.
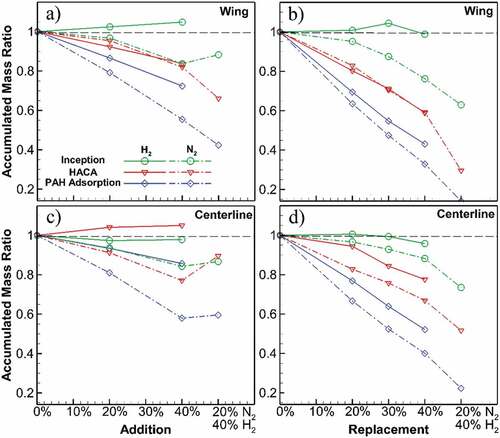
Accumulated mass ratios on the flame centerline also show a similar reducing trend. However, H2 addition results in a slightly increased mass accumulation by HACA by less than 5%, while that of inception is reduced on the centerline. For N2, on the other hand, all formation processes show a reduction, with a greater decrease for PAH adsorption. Dilution with N2 reduces all of the processes’ mass ratios more compared to H2. Similar to the flame wing, replacement leads to a steeper reduction than addition cases. For example, the accumulated mass ratio of HACA drops from 1.05 to 0.77 when comparing 40% H2 additional and replacement cases. Reductions are higher for mixed replacement with the lowest PAH adsorption mass ratio equal to 0.22 of the undiluted flame.
3.2.2. Maximum HACA and PAH adsorption processes rates
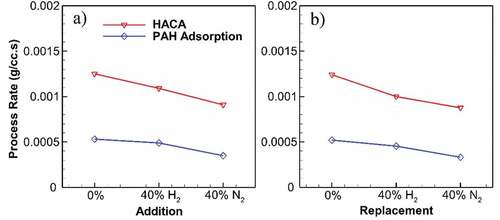
Figure shows changes in the maximum rates for HACA and PAH adsorption processes throughout undiluted and diluted flames for addition and replacement cases. Both processes show reduced rates for diluted flames, with N2 having a greater reduction effect compared to H2. At 40% dilution, while H2 addition decreases the maximum HACA rate by 13%, N2 results in a 27% reduction. Replacement results in a slightly steeper reduction of HACA rate for H2 and N2 compared to addition. The same trend with less difference applies to the maximum PAH adsorption rate.
Figure 5. Maximum rates of HACA and PAH adsorption throughout the undiluted and diluted flames at 40% addition (a) and replacement (b). Both processes decrease due to dilution, whereas N2 has a greater effect compared to H2. While H2 results in a reduction of at most 19% in HACA rate, N2 reduces HACA rate by 30%. Same reductions occur for PAH adsorption rate with 13% and 37% for H2 and N2, respectively.
3.2.3. Importance of temperature–time history
The previous figures display that fuel dilution reduces the two main mass-producing processes in soot formation. However, it is not clear why these reductions in HACA and PAH adsorption surface growth occur. It is well known that high-temperature particle residence time has a strong effect on soot formation. Figure shows the parameter of temperature–time history versus dilution cases on the wings and centerline along with the peak soot fv. Temperature–time history represents the total residence time of a soot particle at high temperatures in the flame and is defined by the following equation (Veshkini et al., Citation2015):
Figure 6. Temperature–time history and maximum soot volume fraction of the undiluted flame and diluted flames through addition and replacement cases based on flame wing (a, b) and centerline (c, d). Temperature–time history closely follows the trendline of the maximum soot volume fraction in replacement cases showing its dominance. For addition cases, however, soot volume fraction has a more rapid reduction compared to temperature–time history.
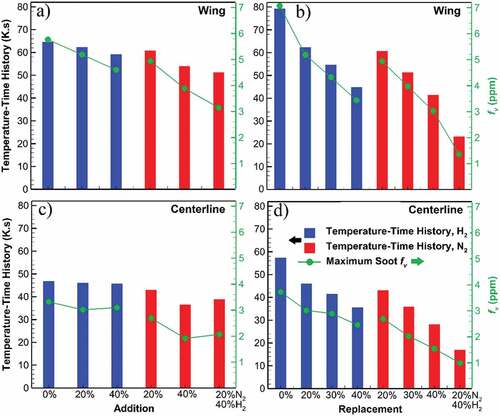
Where T is temperature and s is the path (typically through the centerline or wing). Due to its integration over the path, this parameter is dependent on the flame height. Comparing the replacement and addition cases, a greater reduction is observed for replacement cases, while this reduction is relatively low for the addition cases. This is also similar to the flame height reduction mentioned earlier and in the supplemental material. Flame height reduction is in line with Roper’s analysis of the fuel flow rate and the flame height (Roper, Citation1977). Roper’s correlation states that a lower fuel inlet rate to the burner results in a shorter flame due to the competition between axial momentum and radial diffusion (Roper, Citation1977). For replacement cases, where diluent reduces the ethylene inlet rate, such flame height reduction and consequently greater reduction in temperature–time history occur. Matching trends of temperature–time history and peak soot volume fraction indicate the source of reduction in the formation processes (HACA and PAH adsorption). Due to a shorter flame, soot particles spend less time in hot reactive areas which leads to less surface growth through HACA and adsorption of PAHs on particle surfaces. The correlation between temperature–time history and soot formation reduction is more evident in replacement cases where significantly changed flame geometry demonstrates its dominance in soot formation suppression. This effect with roots in the changes in the temperature–time history is singled out by comparing the flame geometry between the replacement and addition cases. However, for addition cases and specifically N2, soot volume fraction has a more rapid reduction compared to temperature–time history, indicating that more effects are acting to reduce soot formation beyond changes in the flame geometry.
3.2.4. Carbon to soot conversion
A practical interpretation of soot results that removes the effect of varying fuel flow rates can be defined as the conversion of carbon to soot. At each HAB, the soot mass flow rate () can be calculated from a radial integration as below:
Where is the axial velocity of the soot particles,
is the soot particle density, and
is the soot volume fraction. By dividing the soot mass flow rate by the mass flow rate of carbon from the fuel inlet, carbon to soot conversion is calculated at each HAB.
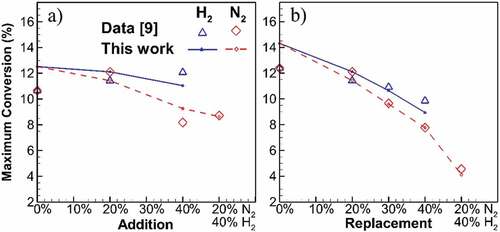
The maximum carbon-to-soot conversion for dilution cases is presented in Figure . Values from simulations are within 17% of the values calculated from the experimental data, and the trends are relatively captured. The maximum conversion typically occurs at the same HAB as the maximum fv. An increase in diluent percentage reduces the conversion. In agreement with the results in earlier sections, N2 has a higher reducing effect on carbon to soot conversion. For addition cases, undiluted flame results in 12.51% conversion, while it decreases to 11.03% and 9.25% for 40% H2 and N2 additions, respectively. The slope of conversion reduction is higher for replacement cases, from 14.31% conversion for undiluted flame down to 8.94% and 7.76% for H2 and N2 at 40% replacement. The conversion reduction follows a linear trend for each of H2 and N2 at addition and replacement cases. Mixed dilutions mark the highest conversion reductions, down to 4.1% at maximum. However, the conversion of the mixed dilution does not lie on the linear trend of single diluent cases, which refers to the synergetic effect from the presence of both diluents in the flame.
Figure 7. Maximum carbon to soot conversion for addition and replacement flames at different diluent concentrations. Higher amount of diluent results in linear reduction of conversion with higher slope for N2 compared to H2 cases.
The information from Figure can be integrated into the following linear correlations for addition and replacement cases based on the concentration of the diluent in the fuel stream (excluding the mixed diluents).
The correlation lines fit within 3.5% of the numerical results.
3.2.5. Differentiating the effects of H2 and N2 dilution
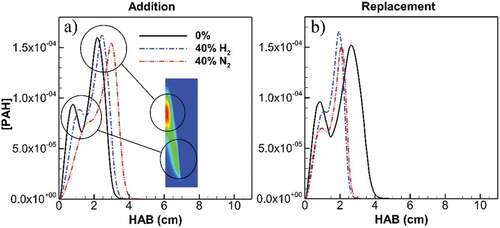
To differentiate the effects of H2 and N2 dilution on soot, key species such as acetylene and PAH are investigated. Figure shows the distribution of maximum concentration of benzo[a]pyrene as the main PAH contributing to PAH adsorption vs. height above burner (HAB) for undiluted and diluted flames at 40%. Two peaks are observed corresponding to lower and higher regions inside the flame approximately at HAB = 1 cm and 2 cm, respectively. The first peak located at the lower flame region corresponds to the flame wing, where the first primary particles are incepted as a result of PAH collision. The second peak is located on the flame centerline at the higher end of the inception zone. Any PAH reduction in the region between these peaks reduces the inception of the new particles on the flame wings and centerline that will later go through the growth processes. Dilution shows a greater reduction at the first peak (flame wings). This dilution effect was observed earlier in Figure showing greater reductions in the processes for the flame wings compared to the flame centerline. A comparison of the effects of H2 and N2 on this region shows a considerable reduction in PAH concentration as well as a delay for the first peak. In the case of N2 addition, this delay and reduction are even more pronounced compared to H2 addition. H2 and N2 addition, respectively, result in a 25% and 65% reduction in PAH concentration at the location of the first peak for undiluted ethylene. Given that the flame height remains unchanged (Figure -addition), this higher delay in PAH formation by N2 dilution results in a shorter available path in the flame for inception and consequently surface growth processes. Overall, the soot formation region of the flame is shorter due to the dilution. Additionally, lower PAH concentration after the inception zone leads to less surface growth from PAH adsorption. In this regard, N2 shows a greater reduction, having a considerably lower PAH concentration between the two peaks. For replacement cases, the same reduction is observed as well as a shortened span which is due to the changed geometry of the flames (Figure -replacement).
Figure 8. Maximum PAH concentration along flame height for undiluted flame and diluted flames at 40% addition (a) and replacement (b). First peak lies on flame wing at lower HAB and zones of soot inception onset. H2 and N2 addition, respectively, result in 25% and 65% reduction in PAH concentration at the location of first peak for undiluted ethylene. The first peak is delayed by H2 and greater by N2 addition, leading to shorter inception and consequently growth zone through flame height. H2 and N2 replacement, respectively, result in 19% and 30% reduction in PAH concentration at the location of first peak for undiluted ethylene. The first peak and top end of the graph are significantly closer for both H2 and N2 replacement, leading to shorter inception and consequently growth zone through flame height.
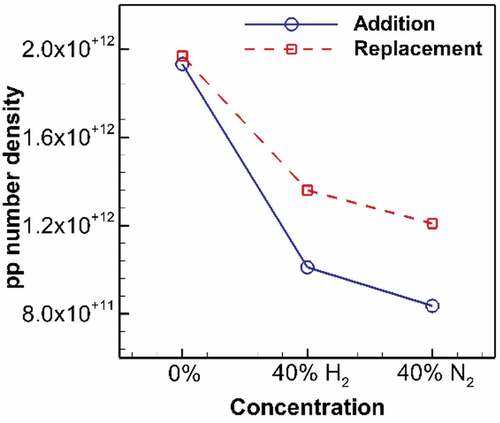
The effect of reduced PAH concentration at the inception region is shown in Figure in form of the primary particle number density at the location of the first peak in the previous figure (HAB = 1 cm). The number of primary particles dramatically drops for both H2 and N2 at addition and replacement cases. The first stage of reduced soot fv is observed at this point, where fewer particles are formed due to dilution. For instance, this reduced number density is 52% and 43% of the undiluted flame for H2 and N2 addition, respectively.
Figure 9. Primary particle number density at HAB = 1 cm on flame wing for undiluted flame and diluted flames at 40% addition and replacement. H2 addition significantly declines the number density to 52% of its value for undiluted ethylene, followed by N2 addition reducing it to 43%. At replacement, H2 reduces the number density to 69% of its value for undiluted ethylene, followed by N2 dilution reducing it to 61%.
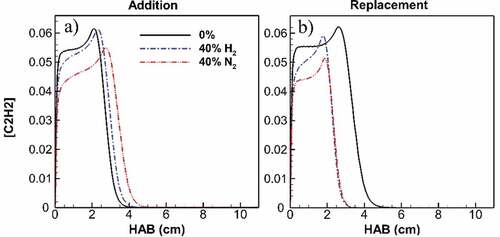
Acetylene is another key species in the formation of soot and specifically in the HACA surface growth process. The distribution of maximum acetylene concentration vs the flame height for undiluted ethylene and diluted flames at 40% is shown in Figure . Reduction due to both addition and replacement by H2 and N2 is observed. The addition of H2 causes a maximum of 8% reduction in acetylene concentration, while N2 results in a 20% reduction. Reduced acetylene at the mid-height of the flame coincides with the regions of surface growth and mainly affects the HACA process. Together with the reduced number of incepted particles, acetylene reduction is considered a principal reason for the decreased HACA mass accumulation observed previously in Figure . Similar to previous effects, N2 dilution shows a greater effect compared to H2, having more than twice the reduction as H2 in addition cases. For replacement cases, acetylene reduction is accompanied by reduced flame height which minimizes the potential of surface growth due to the HACA process.
Figure 10. Maximum acetylene concentration along flame height for undiluted flame and diluted flames at 40% addition (a) and replacement (b). Despite a longer acetylene presence for diluted flames in addition cases, acetylene concentration is constantly lower than its value at undiluted ethylene flame at flame parts corresponding to growth zones. The difference peaks at 8% for H2 and 20% for N2 addition. With replacement, acetylene concentration of diluted flames is lower than its value at undiluted ethylene flame. Inside the flame height, the concentration difference peaks at 15% for H2 and 21% for N2 replacement. Also, the top end of acetylene presence is significantly lowered by both H2 and N2 at approximately 40%.
Further investigation of the difference between H2 and N2 dilution effect on soot formation requires understanding why N2 dilution results in reduced benzo[a]pyrene (BAPYR) and C2H2 concentrations. In this regard, a set of chemical analyses is carried out in the form of equivalent perfectly stirred reactor (PSR) modeling. Different cases, each corresponding to a HAB at lower flame regions, display the differing effect of H2 and N2 dilution on flame chemical pathways. A collapsed version of pathways from fuel to the main components of soot formation, including acetylene and benzo[a]pyrene as the main PAH, is depicted in Figure . Chemical paths that hydrogen dilution enhances compared to N2 dilution are marked with red arrows. The species production rates (mole/cc.sec) of 40% dilutions with H2 and N2 are also given on these arrows at the conditions of the onset of soot formation. This includes all the pathways from pure ethylene to acetylene. Therefore, the presence of hydrogen chemically enhances the formation of acetylene and consequently PAH. However, hydrogen abundance in H2 cases has a physical diluting effect, which lessens this chemical effect to a value lower than the undiluted case. In the case of N2 dilution, the reduced hydrogen and physical diluting effect are present at the same time, where the lowest species formation rates are recorded.
Figure 11. Main chemical pathways from ethylene to C2H2 and benzo[a]pyrene for an equivalent perfectly stirred reaction modeling with the temperature and residence times at the onset of soot formation in the current flames. Arrows in red indicate reactions where hydrogen plays an enhancing role with the species production rate (mole/cc.sec) of 40% dilutions with H2 and N2. Arrows with dashed lines indicate collapsed series.
![Figure 11. Main chemical pathways from ethylene to C2H2 and benzo[a]pyrene for an equivalent perfectly stirred reaction modeling with the temperature and residence times at the onset of soot formation in the current flames. Arrows in red indicate reactions where hydrogen plays an enhancing role with the species production rate (mole/cc.sec) of 40% dilutions with H2 and N2. Arrows with dashed lines indicate collapsed series.](/cms/asset/be943866-0518-4d9f-8bb6-716b6f14109c/oaen_a_2130192_f0011_oc.jpg)
A more detailed table containing the formation rates of species from Figure in undiluted and diluted flames is available in the supplemental material. As a representation, Table shows the formation rates of acetylene and benzo[a]pyrene PAH from three dilution cases (undiluted, 40% H2, and 40% N2 addition) at conditions corresponding to three different HABs from lower flame heights. While the H2 diluted case closely follows the undiluted ethylene, N2 dilution requires a higher height and temperature to reach the same level of formation rates as undiluted and H2 cases. In other words, N2 delays the reactions in the pathway to a higher height inside the flame. This delay in PAH formation and its effects on soot formation have already been observed and discussed in Figure . Therefore, another different behavior of H2 and N2 dilution is that N2 comprises a low level of hydrogen in chemical reactions with its diluting effect and delays the formation of key species that reduce the consequent mechanisms of soot formation.
Table 3. Production rate of acetylene and benzo[a]pyrene PAH (mole/cc.sec) for different flames of undiluted ethylene, 40% H2 addition and 40% N2 addition at different positions in lower flame using an equivalent chemical analysis of perfectly stirred reaction modeling; HAB 1: Temperature = 1000 K, HAB 2: Temperature = 1266 K, HAB 3: Temperature = 1400 K. While both diluents result in the reduction of the species, N2 dilution delays the formation of acetylene and PAH to higher HAB and temperature, losing a significant height in lower flame for soot inception and growth
3.3. Conclusion
Dilution effects of H2 and N2 on soot formation mechanisms are numerically investigated in ethylene/air laminar coflow diffusion flames. A set of 14 combinations of diluent addition and fuel replacement cases are considered to compare the separate and combined effects of H2 and N2 on inception, HACA, and PAH adsorption surface growth. The CoFlame code is utilized with the results well validated against experimental data. The main conclusions of this study are:
For both H2 and N2, mass contributions from HACA and PAH adsorption reduce for all dilution cases. These reductions increase for replacement cases compared to addition cases. Also, dilution with N2 results in a greater reduction in HACA and PAH adsorption mass contributions compared to H2 dilution.
A comparison of the addition and replacement cases shows that the primary source of the diluent’s effects on soot reduction comes from the changes in the flow geometry that affect the parameter of temperature–time history.
H2 and N2 dilution by replacement changes the flame geometry and results in reduced temperature–time history. Thus, soot particles have less residence time at high temperatures, leading to less soot growth. This reduction is the primary cause of the reduced soot mechanism contributions.
The addition of H2 and N2 results in decreased PAH concentration at lower flame HAB, where the inception process is dominant. This reduction results in a lower number of primary particles that later undergo the growth processes. N2 addition has a greater reduction in this regard compared to H2 addition.
N2 addition causes another decrease in acetylene concentration at the regions of HACA growth. Together with lower PAH concentration, N2 dilution results in lower growth rates and consequently lower soot fv compared to H2 dilution.
The origin of different effects from H2 and N2 dilution is found in the chemical reactions, where less hydrogen in N2 dilution delays the formation of key species like PAH and acetylene to higher heights in the flame, leading to less residence time for soot inception and growth.
A pair of correlations is introduced to relate the carbon to soot conversion to the diluent concentration in the flame for addition and replacement cases.
As an extension to the present work, further research should focus on different combinations of fuel types and diluents. Additionally, investigations should target the effect of varying pressure on hydrogen fuel stream dilution.
Acknowledgements
The authors acknowledge the Natural Sciences and Engineering Research Council for financial support and would like to thank Prof. M. Reza Kholghy for the collaboration that helped the completion of this work. Computations were performed on the Niagara supercomputer at the SciNet HPC Consortium.
Disclosure statement
No potential conflict of interest was reported by the author(s).
Additional information
Funding
References
- Abhinavam Kailasanathan, R. K., Yelverton, T. L. B., Fang, T., & Roberts, W. L. (2013). Effect of diluents on soot precursor formation and temperature in ethylene laminar diffusion flames. Combustion and Flame, 160(3), 656–17. https://doi.org/10.1016/j.combustflame.2012.11.004
- Al-Qurashi, K., Lueking, A. D., & Boehman, A. L. (2011). The deconvolution of the thermal, dilution, and chemical effects of exhaust gas recirculation (EGR) on the reactivity of engine and flame soot. Combustion and Flame, 158(9), 1696–1704. https://doi.org/10.1016/j.combustflame.2011.02.006
- Boiarciuc, A., Foucher, F., & Mounaïm-Rousselle, C. (2006). Soot volume fractions and primary particle size estimate by means of the simultaneous two-color-time-resolved and 2D laser-induced incandescence. Applied Physics B, 83(3), 413–421. https://doi.org/10.1007/s00340-006-2236-8
- De Iuliis, S., Maffi, S., Migliorini, F., Cignoli, F., & Zizak, G. (2012). Effect of hydrogen addition on soot formation in an ethylene/air premixed flame. Applied Physics B, 106(3), 707–715. https://doi.org/10.1007/s00340-012-4903-2
- Do, H. Q., Tran, L. S., Gasnot, L., Mercier, X., & El Bakali, A. (2021). Experimental study of the influence of hydrogen as a fuel additive on the formation of soot precursors and particles in atmospheric laminar premixed flames of methane. Fuel, 287, 119517. https://doi.org/10.1016/j.fuel.2020.119517
- Eaves, N. A., Dworkin, S. B., & Thomson, M. J. (2015). The importance of reversibility in modeling soot nucleation and condensation processes, proc. Proceedings of the Combustion Institute, 35(2), 1787–1794. https://doi.org/10.1016/j.proci.2014.05.036
- Eaves, N. A., Dworkin, S. B., & Thomson, M. J. (2017). Assessing relative contributions of PAHs to soot mass by reversible heterogeneous nucleation and condensation, Proc. Proceedings of the Combustion Institute, 36(1), 935–945. https://doi.org/10.1016/j.proci.2016.06.051
- Eaves, N. A., Thomson, M. J., & Dworkin, S. B. (2013). The effect of conjugate heat transfer on soot formation modeling at elevated pressures. Combustion Science and Technology, 185(12), 1799–1819. https://doi.org/10.1080/00102202.2013.839554
- Eaves, N. A., Zhang, Q., Liu, F., Guo, H., Dworkin, S. B., & Thomson, M. J. (2016). CoFlame: A refined and validated numerical algorithm for modeling sooting laminar coflow diffusion flames. Computer Physics Communications, 207, 464–477. https://doi.org/10.1016/j.cpc.2016.06.016
- Gu, M., Chu, H., & Liu, F. (2016). Effects of simultaneous hydrogen enrichment and carbon dioxide dilution of fuel on soot formation in an axisymmetric coflow laminar ethylene/air diffusion flame. Combustion and Flame, 166, 216–228. https://doi.org/10.1016/j.combustflame.2016.01.023
- Guo, H., Liu, F., Smallwood, G. J., & Gülder, Ö. L. (2006). Numerical study on the influence of hydrogen addition on soot formation in a laminar ethylene-air diffusion flame. Combustion and Flame, 145(1–2), 324–338. https://doi.org/10.1016/j.combustflame.2005.10.016
- Joo, H. I., & Gülder, Ö. L. (2011). Experimental study of soot and temperature field structure of laminar co-flow ethylene-air diffusion flames with nitrogen dilution at elevated pressures. Combustion and Flame, 158(3), 416–422. https://doi.org/10.1016/j.combustflame.2010.09.013
- Ju, E. L., Oh, K. C., & Shin, H. D. (2005). Soot formation in inverse diffusion flames of diluted ethene. Fuel, 84(5), 543–550. https://doi.org/10.1016/j.fuel.2004.11.003
- Kailasanathan, R. K. A., Zhang, J., Fang, T., & Roberts, W. L. (2014). Effects of diluents on soot surface temperature and volume fraction in diluted ethylene diffusion flames at pressure. Combustion Science and Technology, 186(6), 815–828. https://doi.org/10.1080/00102202.2013.878710
- Khanehzar, A., Cepeda, F., & Dworkin, S. B. (2022). The influence of nitrogen and hydrogen addition/dilution on soot formation in coflow ethylene/air diffusion flames. Fuel, 309, 122244. https://doi.org/10.1016/J.FUEL.2021.122244
- Kholghy, M. R., Eaves, N. A., Veshkini, A., & Thomson, M. J. (2019). The role of reactive PAH dimerization in reducing soot nucleation reversibility. Proceedings of the Combustion Institute, 37(1), 1003–1011. https://doi.org/10.1016/j.proci.2018.07.110
- Kholghy, M. R., Kelesidis, G. A., & Pratsinis, S. E. (2018). Reactive polycyclic aromatic hydrocarbon dimerization drives soot nucleation. Phys. Chem. Chem. Phys, 20 16 , 10925–10938. https://doi.org/10.1039/c7cp07803j
- Kholghy, M. R., Veshkini, A., & Thomson, M. J. (2016). The core-shell internal nanostructure of soot - A criterion to model soot maturity. Carbon N. Y, 100, 508–536. https://doi.org/10.1016/j.carbon.2016.01.022
- Liu, D. (2014). Kinetic analysis of the chemical effects of hydrogen addition on dimethyl ether flames. International Journal of Hydrogen Energy, 39(24), 13014–13019. https://doi.org/10.1016/j.ijhydene.2014.06.072
- Liu, F., Guo, H., Smallwood, G. J., & Gülder, Ö. L. (2001). The chemical effects of carbon dioxide as an additive in an ethylene diffusion flame: Implications for soot and NOx formation. Combustion and Flame, 125(1–2), 778–787. https://doi.org/10.1016/S0010-2180(00)00241-8
- Liu, F., Karataş, A. E., Gülder, Ö. L., & Gu, M. (2015). Numerical and experimental study of the influence of CO2 and N2 dilution on soot formation in laminar coflow C2H4/air diffusion flames at pressures between 5 and 20 atm. Combustion and Flame, 162(5), 2231–2247. https://doi.org/10.1016/j.combustflame.2015.01.020
- Naseri, A., Veshkini, A., & Thomson, M. J. (2017). Detailed modeling of CO2 addition effects on the evolution of soot particle size distribution functions in premixed laminar ethylene flames. Combustion and Flame, 183, 75–87. https://doi.org/10.1016/j.combustflame.2017.04.028
- Park, S. H., Lee, K. M., & Hwang, C. H. (2011). Effects of hydrogen addition on soot formation and oxidation in laminar premixed C2H2/air flames. International Journal of Hydrogen Energy, 36(15), 9304–9311. https://doi.org/10.1016/j.ijhydene.2011.05.031
- Qiu, L., Hua, Y., Zhuang, Y., Wei, J., Qian, Y., & Cheng, X. (2020). Numerical investigation into the decoupling effects of hydrogen blending on flame structure and soot formation in a laminar ethylene diffusion flame. International Journal of Hydrogen Energy, 45(31), 15672–15682. https://doi.org/10.1016/j.ijhydene.2020.04.033
- Roper, F. G. (1977). The prediction of laminar jet diffusion flame sizes: Part I. Combustion and Flame, 29, 219–226. https://doi.org/10.1016/0010-2180(77)90112-2
- Shao, C., Campuzano, F., Zhai, Y., Wang, H., Zhang, W., & Mani Sarathy, S. (2022). Effects of ammonia addition on soot formation in ethylene laminar premixed flames. Combustion and Flame, 235, 111698. https://doi.org/10.1016/j.combustflame.2021.111698
- Smooke, M. D., Long, M. B., Connelly, B. C., Colket, M. B., & Hall, R. J. (2005). Soot formation in laminar diffusion flames. Combustion and Flame, 143(4), 613–628. https://doi.org/10.1016/j.combustflame.2005.08.028
- Sun, Z., Dally, B., Nathan, G., & Alwahabi, Z. (2017). Effects of hydrogen and nitrogen on soot volume fraction, primary particle diameter and temperature in laminar ethylene/air diffusion flames. Combustion and Flame, 175, 270–282. https://doi.org/10.1016/j.combustflame.2016.08.031
- Tang, Q., Mei, J., & You, X. (2016). Effects of CO2 addition on the evolution of particle size distribution functions in premixed ethylene flame. Combustion and Flame, 165, 424–432. https://doi.org/10.1016/j.combustflame.2015.12.026
- Veshkini, A., Dworkin, S. B., & Thomson, M. J. (2015). A soot particle surface reactivity model applied to a wide range of laminar ethylene/air flames. Combustion and Flame, 161(12), 3191–3200. https://doi.org/10.1016/j.combustflame.2014.05.024
- Veshkini, A., Eaves, N. A., Dworkin, S. B., & Thomson, M. J. (2016). Application of PAH-condensation reversibility in modeling soot growth in laminar premixed and nonpremixed flames. Combustion and Flame, 167, 335–352. https://doi.org/10.1016/j.combustflame.2016.02.024
- Wang, Y., & Chung, S. H. (2016). Formation of soot in counterflow diffusion flames with carbon dioxide dilution. Combustion Science and Technology, 188(4–5), 805–817. https://doi.org/10.1080/00102202.2016.1139388
- Wang, Y., Gu, M., Chao, L., Wu, J., Lin, Y., & Huang, X. (2021). Different chemical effect of hydrogen addition on soot formation in laminar coflow methane and ethylene diffusion flames. International Journal of Hydrogen Energy 46 29 16063–16074 . https://doi.org/10.1016/j.ijhydene.2021.02.014
- Wang, F., Li, P., Mi, J., Wang, J., & Xu, M. (2015). Chemical kinetic effect of hydrogen addition on ethylene jet flames in a hot and diluted coflow. International Journal of Hydrogen Energy, 40 46 , 16634–16648. https://doi.org/10.1016/j.ijhydene.2015.09.047
- Wang, Y., Liu, X., Gu, M., & An, X. (2018). Numerical simulation of the effects of hydrogen addition to fuel on the structure and soot formation of a laminar axisymmetric coflow C 2 H 4 /(O 2 -CO 2) Diffusion Flame. Combustion Science and Technology, 191(10), 1743–1768. https://doi.org/10.1080/00102202.2018.1532413
- Yen, M., Magi, V., & Abraham, J. (2019). Modeling the effects of hydrogen and nitrogen addition on soot formation in laminar ethylene jet diffusion flames. Chemical Engineering Science, 196 , 116–129. https://doi.org/10.1016/j.ces.2018.07.061
- Ying, Y., & Liu, D. (2015). Detailed influences of chemical effects of hydrogen as fuel additive on methane flame. International Journal of Hydrogen Energy, 40(9), 3777–3788. https://doi.org/10.1016/j.ijhydene.2015.01.076
- Zhang, Y., Liu, F., & Lou, C. (2018). Experimental and numerical investigations of soot formation in laminar coflow ethylene flames burning in O 2 /N 2 and O 2 /CO 2 atmospheres at different O 2 mole fractions. Energy and Fuels, 32(5), 6252–6263. https://doi.org/10.1021/acs.energyfuels.7b04069
- Zhao, H., Stone, R., & Williams, B. (2014). Investigation of the soot formation in ethylene laminar diffusion flames when diluted with helium or supplemented by hydrogen. Energy and Fuels, 28(3), 2144–2151. https://doi.org/10.1021/ef401970q