
 ?Mathematical formulae have been encoded as MathML and are displayed in this HTML version using MathJax in order to improve their display. Uncheck the box to turn MathJax off. This feature requires Javascript. Click on a formula to zoom.
Abstract
The study introduces a unique control strategy combining multi-frequency control (MFC) and fuzzy PI control for LF-HVAC transmission systems. MFC is typically associated with microgrid applications, but here it’s adapted for use in a different context – LF-HVAC transmission (low frequency high voltage alternating current). The proposed controller is shown to enhance system performance by reducing settling time and peak time of frequency fluctuations by small but significant percentages (0.12% and 0.15% respectively). These improvements contribute to better transient response and stability in LF-HVAC transmission systems. By minimizing power quality problems associated with frequency changes, such as total harmonic distortion (THD) of line voltage, the proposed controller enhances the overall quality and reliability of power transmission. This is particularly crucial in high-voltage transmission systems where maintaining stable voltage levels is essential. The study goes beyond theoretical simulations by validating the proposed model using both MATLAB simulations and real-time hardware-in-the-loop (HIL) simulations with Opal RT. This comprehensive validation process ensures the reliability and applicability of the proposed control strategy in practical LF-HVAC transmission systems.
REVIEWING EDITOR:
1. Introduction
Accessing electricity from renewable energy sources (RESs) has garnered significant attention in recent years, driven by the imperative to achieve global sustainable development objectives (Challa et al., Citation2022; Fischer et al., Citation2012). However, integrating RESs into existing energy systems poses challenges for energy management, particularly with the increasing use of distributed generators (DGs) and the integration of various renewable energy sources (Ngo et al., Citation2016; Rosewater et al., Citation2018).
To address these challenges, various multi-port converter systems have been developed to combine different types of sources and loads (Yoo et al., Citation2017). In the context of delivering power from renewable sources to loads, both high voltage alternating current (HVAC) and high voltage direct current (HVDC) transmission lines have been utilized, often incorporating frequency converters. However, a key issue in these systems is the effective control of converters operating at different frequencies simultaneously (Barrero et al., Citation2002; Zhao et al., Citation2012).
While multi-frequency control (MFC) methods have been proposed to mitigate frequency fluctuations between different systems, integrating low-frequency transmission line design with multi-frequency systems presents a novel approach to minimize source interaction and enhance power transmission efficiency (Jantzen, Citation1998). Previous studies have explored the feasibility of such integration, including physical implementations such as the Ross Island project, which demonstrated a dual-frequency interconnected system (Anand et al., Citation2022).
Furthermore, the use of back-to-back (BTB) converters in multi-frequency systems offers advantages in regulating bidirectional power flow and improving power quality (Garg et al., Citation2018). However, existing control techniques, primarily relying on conventional proportional-integral (PI) controllers, may face limitations in addressing dynamic system changes and uncertainties (Beerten et al., Citation2010; Ruddy et al., Citation2016).
To address these limitations, this paper proposes a novel control strategy utilizing a fuzzy PI controller for MFC in a high voltage back-to-back converter of a low-frequency HVAC system (Lin & Dinavahi, Citation2018; Nguyen et al., Citation2019). By incorporating fuzzy logic, the proposed controller offers advantages over traditional PI controllers, including enhanced adaptability to imprecise inputs and nonlinearities (Bucher et al., Citation2014).
Moreover, the paper presents a real-time implementation of the proposed controller using the OPAL-RT 5650 simulator, enabling accurate analysis and validation of control algorithms. The study aims to contribute to the advancement of MFC techniques, particularly in the context of low-frequency HVAC systems, while also improving power quality through the reduction of total harmonic distortion (THD).
In summary, this paper addresses the gap in existing literature by proposing a novel control strategy for multi-frequency systems, utilizing a fuzzy PI controller, and presenting real-time implementation results for validation. The study aims to enhance understanding and improve the performance of low-frequency HVAC systems in integrating renewable energy sources, ultimately contributing to the advancement of sustainable energy systems.
This article is organized in the following manner:
The basic modeling and methodology of HV BTB Converters and LF-HVAC systems have been defined in Section 2. The control strategy for BTB Converters with Multiple Frequency control has been shown in Sections 2.1.1 and 2.1.3. In Section 2.1.4. proposed Fuzzy Control with an MFC technique has been shown. In Section 2.1.5, the Opal RT configuration HIL system has been defined and HIL Real-time and simulation Test results have been implemented for different frequencies have been presented in Section 3. Finally, conclusions are made in Section 4.
2. Modeling of the proposed control
2.1. Methodology
2.1.1. LF-HVAC and HVBTB converter model
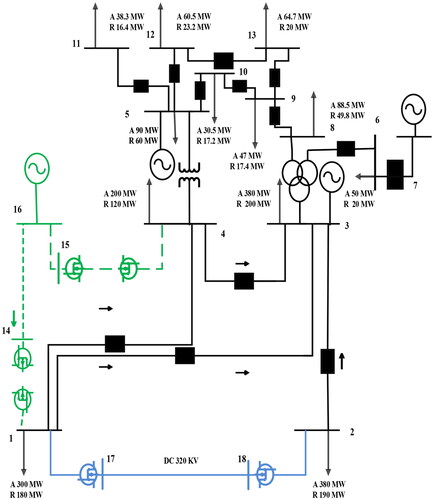
In this section, the basic structure of the high voltage back-to-back converter (HVBTB) Converter and low frequency high voltage alternate current (LF HVAC) system and their integrated system has been implemented as shown in . The basic structure of the LF-HVAC system connection with the HVAC system is shown. The Test system consists of 14 IEEE Bus systems.
Figure 1. LF-HVAC system with 14 IEEE test bus system.
The modeling of a high voltage BTB Converter with different AC frequency systems is shown in . Two AC system with frequency 10–60 Hz has been connected to fixed 60 through an HVBTB converter and a DC source.
Figure 2. High voltage back-to-back converter between different grids.
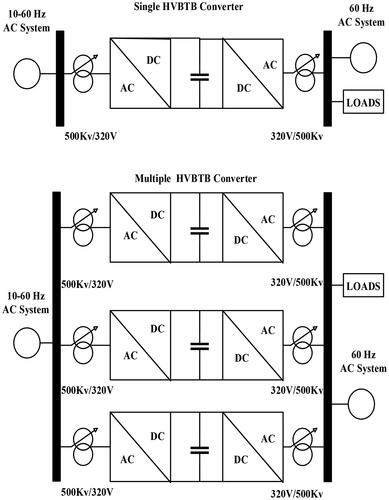
The BTB converter connects the high voltage side of 500 kV and lowers it down to 320 V for conversion control. In a single connection port, only one HVBTB has been connected for conversion of frequency but in a multiple connection port, many HVBTB converters can be connected to different ports.
It is a flexible connection of HVBTB in which multiple connection ports can be implemented. Like, if there is a single LF-HVAC source then it can be connected to different transmission ports and different HVBTB converters so that the fault chance becomes less and less pressure on a single HVBTB converter. So that it can protect from fault occurrences also.
2.1.2. Proposed high voltage back-to-back converter model
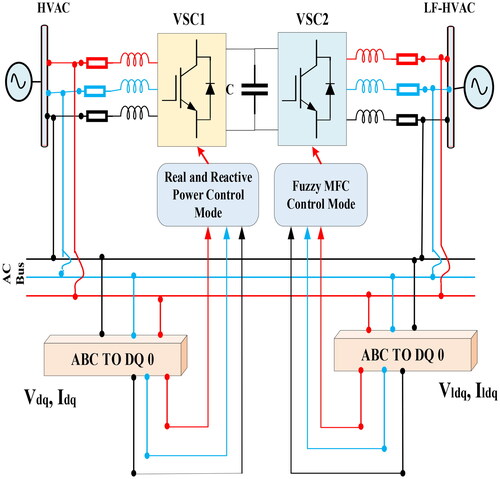
In the proposed back-to-back converter model, the VSC1 converter is connected to the Low-frequency side and the VSC2 converter is connected to the fundamental frequency grid side i.e. 60 Hz. The control technique is shown in Section 2.1.3. In the beginning, to extract the voltages from both sides of the grid, the park’s transformation was implemented instead of Clarke’s and inverse Clarke’s transformation. EquationEquations (1)(1)
(1) and Equation(2)
(2)
(2) are represented here to show the transformation of VSC1.
(1)
(1)
(2)
(2)
where Vabc and Iabc denote the voltages and the currents from the 60 Hz AC system and are converted to dqo components by the park’s transformation as Ed, Eq, E0 and Id, Iq, I0 respectively. Similarly, the park’s transformation was also implemented in a 10–50 Hz AC system denoted by Vlabc and Ilabc converted to Eld, Elq, El0 and Ild, Ilq, Il0 respectively as shown in .
Figure 3. Proposed back-to-back converter topology.
2.1.3. Control of HVBTB with LF-HVAC system
In the proposed system, a BTB converter based on a two-level voltage-source-conversion (VSC) is used to connect two buses of two different frequencies of the proposed system. The HVBTB converter is made up of two converters, one for controlling the dc-link voltage and the other for regulating the frequencies of two AC Systems. The multi-frequency-based control system is employed in low-frequency side VSC.
The control part in the HVBTB system is classified into three subparts as mentioned below:
Control of VSC1
Control of VSC2
DC voltage balancing control
Beyond this sinusoidal PWM, the technique has been implemented for the generation of gate pulses for AC/DC or DC/AC converter. In this scenario, comparing a reference sine wave (the modulating wave) with a high-frequency triangle wave can be used to calculate the on and off instants of a PWM signal (the carrier wave).
2.1.3.1. Control of VSC1 converter
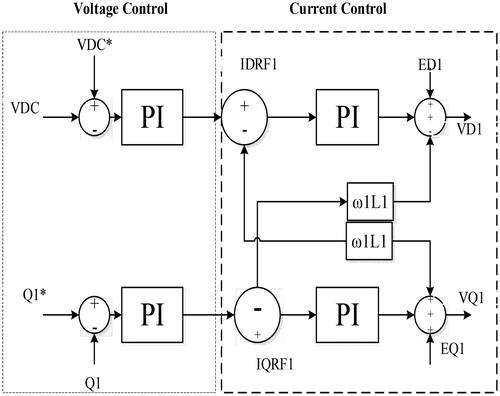
The role of converter VSC1 is to regulate the voltage of the DC link. The synchronous reference frame control is used to regulate the cascaded control loops, which include current and voltage control loops. depicts a schematic design of the cascaded control loops of the VSC 1 converter.
Figure 4. VSC1 control.
The voltages and currents are converted to the DQ reference frame as shown in EquationEquations (1)(1)
(1) and Equation(2)
(2)
(2) by synchronous reference frame (SRF). The modulating output of the current control loop is given by:
(3)
(3)
(4)
(4)
where
(5)
(5)
signals are reference currents of one side of the converter and
and
are the measured currents of the VSC1 converter.
is the angular frequency of one frequency system. L1 is the inductance connected in series with the converter.
(6)
(6)
(7)
(7)
VDC is measured voltage across the capacitor which is subtracted from reference DC Voltage.
reactive power reference and Q1 is measured reactive power of VSC1.
2.1.3.2. Control of VSC2 converter
Converter 2 control has been proposed in the paper for MFC in the LF-HVAC system. depicts the control loops of the VSC2 converter implemented on the low-frequency side of AC systems. Reactive power control is shown by Q2*.
Figure 5. VSC2 control.
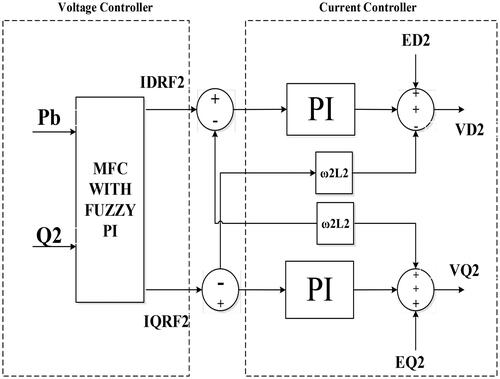
are calculated by reference reactive and real power as shown in EquationEquations (11)
(11)
(11) and Equation(12)
(12)
(12) .
The modulating output of the current loop of the VSC2 converter can be defined by:
(8)
(8)
(9)
(9)
2.1.3.3. DC voltage balancing control
In this Control, the traditional voltage balancing procedure is applied. The method initially determines the direction of current by measuring capacitor voltages for each HVBTB Converter. The processes below are defined for voltage determination:
At the point when the current releases the capacitors, calculation turns on the BTB converter with the most elevated capacitor voltages and switches off those with the least voltage levels.
At the point when the current charges the capacitors, calculation turns on the BTB converter with the least capacitor voltages and switches off those with the most elevated voltage levels.
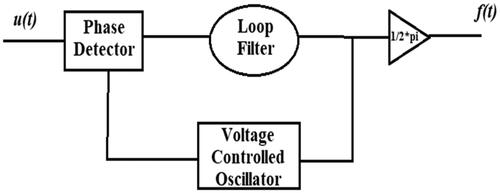
2.1.4. PLL circuit for frequency measurement
Frequency is calculated in the VSC1 and VSC2 sides of the HVBTB converter by the PLL circuit as shown in . Where u (t) is the voltage signal from both sides of the converter and f (t) is the measured frequency.
Figure 6. PLL circuit.
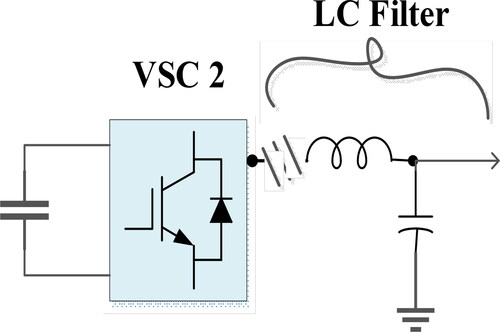
2.1.5. LC filter for power quality improvement
The LC filter on the VSC2 side has been taken for reducing the harmonic effect due to frequency change during conversion as shown in .
Figure 7. L-C filter.
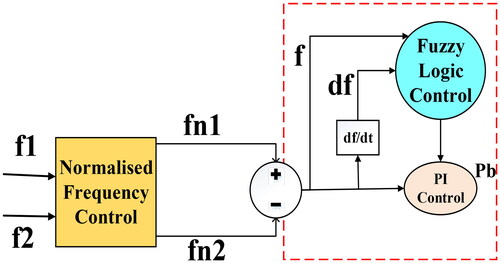
2.1.6. Proposed MFC-based controller
In MFC mode two different frequencies of the grid are measured and normalized frequency is calculated as per EquationEquation (13)(13)
(13) (Yoo et al., Citation2017). It is computed by the normalization of different frequencies to a unique value of the frequency of a particular grid. EquationEquation (14)
(14)
(14) shows the outcome of MFC's reference real power estimation (Yoo et al., Citation2017).
(10)
(10)
(11)
(11)
(12)
(12)
is a normalized frequency that controls and regulates the frequency response on both sides of the grid either LF-HVAC/LF-HVAC (Yoo et al., Citation2017). MFC control is used to convert several low-frequency systems to a single HVAC frequency as an optimum frequency (Yoo et al., Citation2017).
(13)
(13)
EquationEquation (13)(13)
(13) shows the computation of the stabilized frequency output that is normalized/optimized based on the active real power reference (Pb) of the system:
(14)
(14)
Where, shows the calculated frequency of LF-HVAC,
is the rated frequency of HVAC/LF-HVAC,
and
are the maximum and minimum frequency variations and
is the normalized frequency of the respective system (Jantzen, 1998).
In the proposed controller, the Kp & Ki values are extracted from the fuzzy logic-based controller as shown in . The values of Kp & Ki is decided in such a way that PI Controller gives output with minimal loss, optimized and stabilized switched frequency. Here in Fuzzy, single input is taken as frequency and Kp and Ki are taken as output based on logic and rules defined.
Figure 8. Multi-frequency control of HVBTB converters.
The surface view of Kp and Ki values based on rules are also shown in . The membership function of frequency and change in frequency is shown in and . In rule base and for determining kp & ki, N stands for negative, P stands for positive, S stands for small, L stands for large and Z stands for zero respectively. The inputs to the control system are the error Fe, and it is derivative DFe; with seven triangle membership function using a range [−1] as shown in . As for the outputs, the values represent the expected values to the PI’s outputs, respectively the proportional parameter Kp, and integral parameter Ki With five functions of a triangle membership are based on the [0, 1] range as in .
Figure 9. Surface view of Kp and Ki value from FLC.
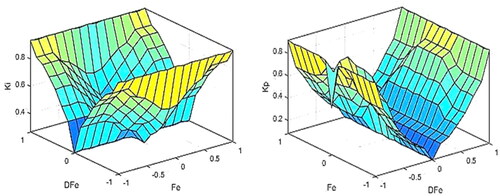
Figure 10. Membership function of DF and DFe.
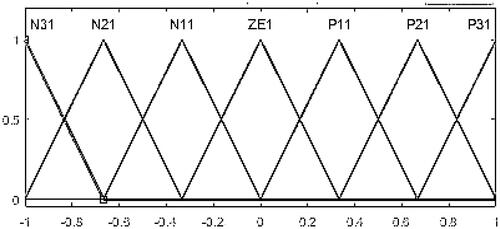
Figure 11. Membership function of Kp and Ki values.
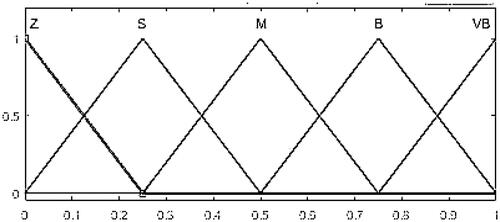
Table 1. Rule base for Kp.
Table 2. Rule base for Ki.
Table 3. Kp and Ki values.
2.1.7. Validation of real-time hardware in the loop (HIL)
In this section, the proposed controller has been validated with Real-Time Simulator OPAL-RT 5650 in Hardware in Loop (HIL) configuration in Hardware synchronization mode.
2.2. HIL design
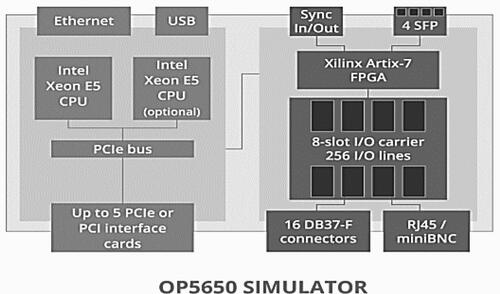
OPAL-RT is a PC/FPGA-based real-time simulator, Hardware-in-Loop (HIL) testing device, and rapid control prototyping (RCP) system for testing, designing, and optimizing control. It is also used for the protection of systems used in power grids, power electronics, motor drives, automotive, trains, aircraft, and other industries, as well as research and development centers and universities. The OP5650 combines Intel Xeon E5 processor cores with the high-performance latest generation Xilinx Artix-7 FPGA to solve a wide range of Hardware-in-the-Loop (HIL) and Rapid Control Prototyping (RCP) applications using OPAL-RT-LAB RT's or HYPERSIM software platforms as shown in .
Figure 12. OPAL RT configuration (Li et al., Citation2010).
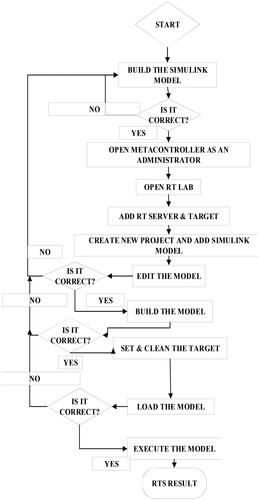
The setup consists of the server of OPAL-RT which is connected through Ethernet, CPU which deals with control and simulation parts, and Input/output Ports which maintain hardware in the loop with a simulator as shown in . The DSO is output hardware for real-time simulation realization (). RT-LAB 2019 is the software through which workstations get signals to simulate or implement the process to outputs. The suggested controllers are then developed utilizing a HIL real-time configuration called rapid control prototyping (RCP). The MATLAB Simulink model of the LF HVAC test system with the proposed control is stored on the host workstation and processed using the RT-LAB software interface. The algorithm to produce real-time results can be depicted in .
Figure 13. OPAL RT hardware setup.
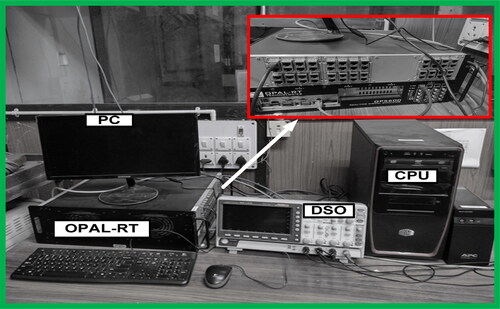
Figure 14. Process flow chart.
The analog out port of the OPAL-RT simulator can only create output signals up to +16 V to −16 V, thus the outputs from the simulated models of MATLAB are scaled correspondingly to obtain signals within the analog-digital converter range or voltage/current can be taken in terms of per unit. The mechanism was then integrated into the RTS's many cores. The Target hardware synchronization is enabled, and the GWINSTEK GDS 1104B 100 MHz, 4-Ch, 2.5 GS/s MDO probes are attached to the analog out of the RTS to evaluate the results.
3. Experimental simulation and HIL-RTS results
In this part, the proposed simulation is tested with 14 Bus IEEE data. The LF-HVAC system is connected with HVAC and HVDC models in the MATLAB and RTS OPAL-RT 5650. Furthermore, voltage stability, power flow control and improvement of power quality with filters used in HVBTB have been achieved. Many parameters affect the voltage stability in the overall system due to the inclusion of a multi-frequency system. Different cases were taken at different low-frequency HVAC systems. The simulations were executed in Microsoft Windows 10 with 128 GB RAM and Intel Xeon processors each with 3.10 GHz core frequency and implemented in Matlab Environment. We have taken parameters with fundamental frequency 60 Hz at 100 MVA base for simulation. Voltage Stability analysis in comparison to previous research work has also been reported.
3.1. Frequency stabilization at different frequencies
shows the frequency deviation of the Low frequency and fundamental frequency converter side by using the proposed controller at 30 Hz frequency. It shows the performance characteristics of the BTB converter in terms of Peak time and settling time. shows the frequency deviation at 40 Hz and shows the frequency at 50 Hz.
Figure 15. Opal RT and simulation waveforms of frequency deviation at 30 Hz.
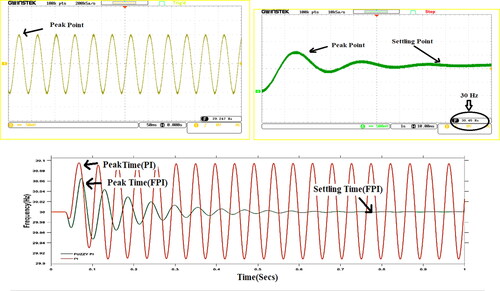
Figure 16. Simulation and OPAL RT waveforms of frequency deviation at 40 Hz.
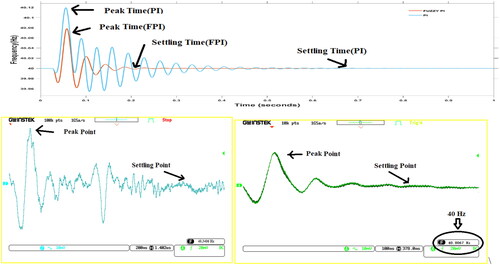
Figure 17. Simulation and Opal RT waveforms of frequency deviation at 40 Hz.
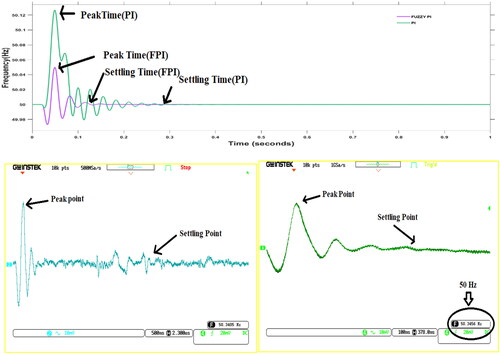
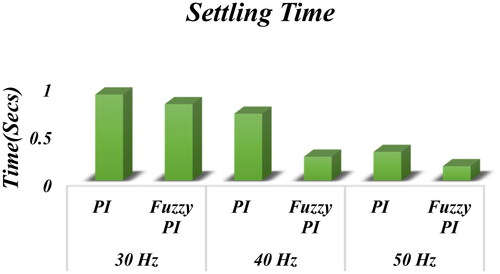
The settling time is improved from unsettled to 0.8 s at 30 Hz with the proposed controller. As the frequency increases the settling time becomes less and stabilizes the system frequency with the MFC fuzzy PI controller. The peak time is also decreasing with a proposed controller from 0.75 sec at 30 Hz to 0.6 sec at 50 Hz as shown in and .
Figure 18. Peak time comparison of the proposed controller.
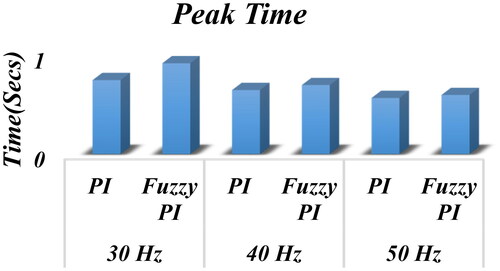
Figure 19. Settling time comparison of the proposed controller.
3.2. Voltage variation
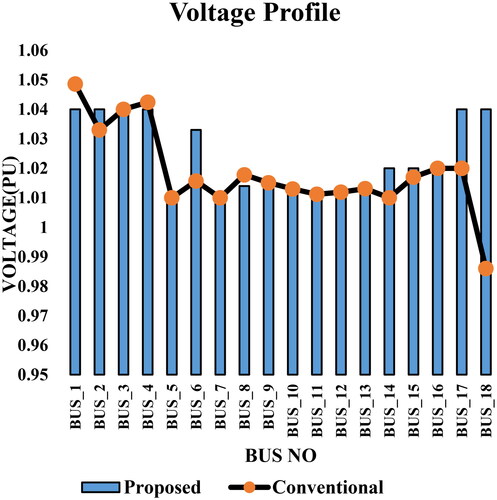
The voltage stability of the LF-HVAC system with the proposed HVBTB converter is shown in . From the voltage profile (Vs), stability is depicted with less variation in voltage. The voltage profile maintains better stability with less settling time from previous work. The proposed controller gives better stabilization of voltage throughout the buses. The voltage is compared with previous literature (Fischer et al., Citation2012) with low-frequency lines which consist of multi HVBTB at two buses. The performance analysis of the proposed converter topology has also been analyzed in terms of voltage profile and gives less voltage deviation.
Figure 20. Voltage profile comparison.
3.3. Power flow in converters
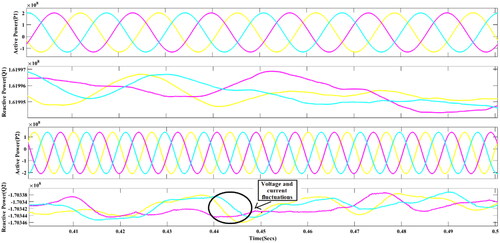
shows the active and reactive power flow of back-to-back converter 1 with sending and receiving terminals of the converter. It can be seen from the figure due to voltage and current fluctuation while changing the frequency, active and reactive power also fluctuates. Similarly, shows the active and reactive power of BTB converter 2 with sending and receiving end terminals. Converter 2 has more fluctuations than converter 1 due to connection with more complex buses.
Figure 21. Active and reactive power of converter 1.
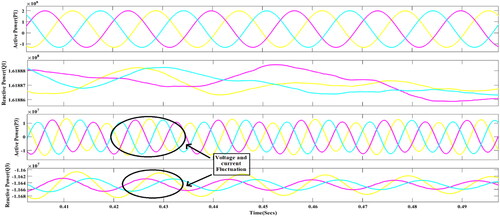
Figure 22. Active and reactive power of converter 2.
3.3.1. Power quality analysis
In this case, the power quality of HVBTB 1 and 2 with VSC1 and VSC 2 has been analyzed as shown in . As shows the simulation results and HIL results of VSC 1 voltage THD analysis of phase A and shows THD analysis of Phase voltage A of HVBTB 2 Converter. The THD is decreasing with the L-C filter in Converter 1 as compared to Converter 2. THD analysis shows that HVBTB is maintaining the IEEE standards THD % which is less than 5%. The THD analysis has been done through RTS HIL Validation to depict the exact effectiveness of HVBTB in the LF-HVAC system.
Figure 23. THD analysis of back-to-back converter 1 at 40 Hz of phase A.
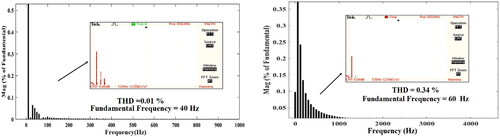
Figure 24. THD analysis of back-to-back converter 2 at 40 Hz of phase A.
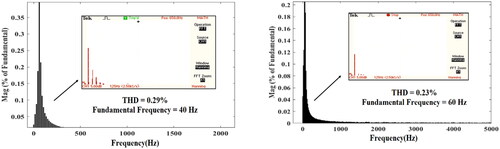
shows the overall THD % of all the phases of VSC1 and 2 of HVBTB1 and 2. and show the phase A of VSC 1 and 2 converter of HVBTB1 and 2 with HIL results. The voltage waveform is maintaining stability with a reduction in THD %. The waveform shows that the LF-Hvac side has better THD % in Converter 1 than 2 as there is less complexity of buses with different networks. shows the PWM output for the generation of gate pulses for converters.
Figure 25. The voltage waveform of back-to-back converter 1 at 40 Hz of phase A.
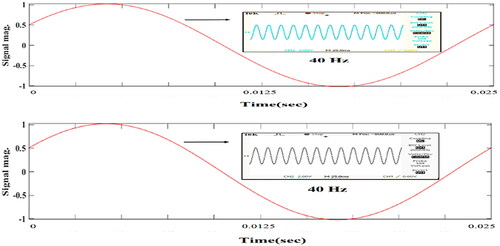
Figure 26. The voltage waveform of back-to-back converter 1 at 40 Hz of phase A.
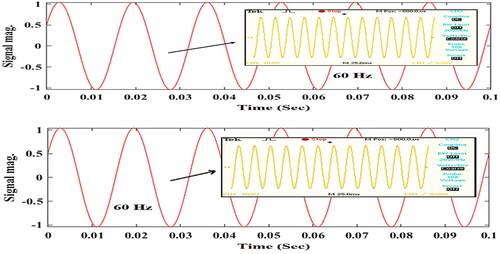
Figure 27. RTS HIL of gate pulses of HVBTB 1 and 2 using PWM technique.
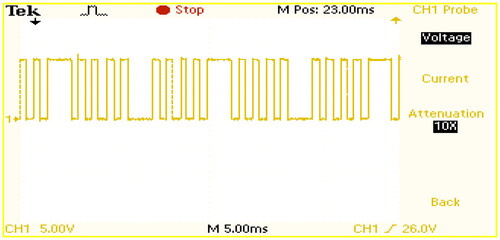
Table 4. THD % of Converters.
4. Conclusion
The study introduces a comprehensive control methodology for the back-to-back converter (BTBC) model interfaced with the LF-HVAC system, integrating voltage stabilization through a proposed fuzzy proportional-integral (PI) controller. Through extensive simulations conducted in MATLAB/Simulink, the effectiveness of the proposed approach in mitigating AC voltage harmonics, ensuring voltage stability, and smoothing power flow was demonstrated. The utilization of the Fuzzy PI controller presents advantages over conventional control techniques, particularly in its ability to handle nonlinearities and uncertainties inherent in power systems. The findings highlight the suitability of the proposed methodology for real-time implementation, as validated through hardware-in-the-loop (HIL) testing. The demonstrated independent control of active and reactive power, coupled with bidirectional power transmission capabilities, signifies promising implications for enhancing the overall performance and stability of power transmission systems. The study presents a robust control methodology for BTB models in LF-HVAC systems, showcasing significant advancements in voltage stabilization and power flow control. It is recommended that future research endeavors focus on exploring alternative AI-based control algorithms to enhance system precision and power quality. Additionally, incorporating renewable energy sources into the proposed system offers a promising avenue for further investigation, aiming to assess the controller’s performance under varying operating conditions and contribute towards the sustainable development of power transmission systems.
| Nomenclature | ||
| HVAC | = | High voltage alternate current |
| LF HVAC | = | Low frequency high voltage alternate current |
| MFC | = | Multi frequency control |
| HVBTB | = | High voltage back-to-back converter |
| HVDC | = | High voltage direct current |
| THD | = | Total harmonic distortion |
| VSC | = | Voltage source converter |
| RTS HIL | = | Real time simulator hardware in Loop |
| Constants | ||
| Q1 | = | Reference reactive power at VSC1 |
| Q1 | = | Calculated reactive power at VSC1 |
| Pb | = | Real active power at VSC2 |
| Q2 | = | Reactive power at VSC2 |
| Variables | ||
| Vabc | = | Voltage magnitude at 60 Hz side |
| Iabc | = | Current magnitude at 60 Hz side |
| Vlabc | = | Voltage magnitude at low frequency Hvac side |
| Ilabc | = | Current magnitude at low frequency Hvac side |
| Eldq0 | = | DQ0 component of voltage at low frequency |
| Edq0 | = | DQ0 component of voltage at 60 Hz side |
| VDQ1 | = | Modulated voltage magnitude of VSC1 |
| VDQ2 | = | Modulated voltage magnitude of VSC2 |
| lDQRF1 | = | Reference current at VSC1 |
| lDQRF2 | = | Reference current at VSC2 |
| Symbols | ||
| kl, KP | = | Proportional and integral gains of VSC1 |
| KLI, KLP | = | Proportional and integral gains of VSC2 |
| ω2, ω1 | = | Measured angular frequency of VSC1 and VSC2 |
| L2, L1 | = | Measured inductance of VSCs |
| FJ | = | Calculated normalized frequency |
Disclosure statement
No potential conflict of interest was reported by the author(s).
Additional information
Notes on contributors
Mukul Anand
Mukul Anand received the M.Tech. degree in electrical engineering from the National Institute of Technology, Sikkim, India, in 2019. He pursued a Ph.D. degree in electrical engineering at Jadavpur University, Kolkata, India. He is also a Visiting Faculty Member with the Department of Electrical Engineering, Jadavpur University. His research interests include power systems, and power electronics.
Swapan Kumar Goswami
Swapan Kumar Goswami received the Ph.D. degree in electrical engineering from Jadavpur University, Kolkata, India, in 1991. He is currently a Professor with the Department of Electrical Engineering, Jadavpur University. His research interests include soft computing applications in power systems, distributed generation, and deregulation.
Debashis Chatterjee
Debashis Chatterjee received the Ph.D. degree in electrical engineering from Jadavpur University, Kolkata, India, in 2005. He is currently a Professor with the Department of Electrical Engineering, Jadavpur University. His research interests include electrical machines, variable-speed drives, electric vehicles, and renewable-energy generation, and power quality study.
References
- Anand, M., Goswami, S. K., & Chatterjee, D. (2022). Multi-frequency control with fuzzy 2DOFPI in HVBTB converter of LF-HVAC system. International Journal of Emerging Electric Power Systems, 24(6), 717–728. https://doi.org/10.1515/ijeeps-2022-0133
- Barrero, F., Gonz’alez, A., Torralba, A., Galv’an, E., & Franquelo, L. G. (2002). Speed control of induction motors using a novel fuzzy sliding-mode structure. IEEE Transactions on Fuzzy Systems, 10(3), 375–383. https://doi.org/10.1109/TFUZZ.2002.1006440
- Beerten, J., Belmans, R., & Cole, S. (2010). A sequential AC/DC power flow algorithm for networks containing multi-terminal VSC HVDC systems [Paper presentation]. IEEE PES General Meeting (pp. 1–7).
- Bucher, M., Wiget, R., Andersson, G., & Franck, C. (2014). Multiterminal HVDC networks—What is the preferred topology? IEEE Transactions on Power Delivery, 29(1), 406–413. https://doi.org/10.1109/TPWRD.2013.2277552
- Challa, R. V. K., Mikkili, S., & Bonthagorla, P. K. (2022). A critical review on hybrid-topologies, modulation techniques, and controlling approaches of modular multilevel converter for grid integration. IETE Journal of Research, 70(2), 1997–2031. https://doi.org/10.1080/03772063.2022.2143438
- Fischer, W., Braun, R., & Erlich, I. (2012). Low frequency high voltage offshore grid for transmission of renewable power [Paper presentation]. Proceedings of the 2012 3rd IEEE PES Innovative Smart Grid Technologies Europe (ISGT Europe) (pp. 1–6).
- Garg A., Bhoi A., Sanjeevikumar P., & Kamani K. (Eds.). (2018). Advances in power systems and energy management. Lecture notes in electrical engineering (Vol. 436). Springer. https://doi.org/10.1007/978-981-10-4394-9_8
- Jantzen, J. (1998). Tuning of fuzzy PID controllers. Technical University of Denmark, Department of Automation.
- Li, W., Joós, G., & Bélanger, J. (2010). Real-time simulation of a wind turbinegenerator coupled with a battery supercapacitor energy storage system. IEEE Transactions on Industrial Electronics. 57(4), 1137–1145.
- Lin, N., & Dinavahi, V. (2018). Detailed device-level electrothermal modeling of the proactive hybrid HVDC breaker for real-time hardware-in-the-loop simulation of DC grids. IEEE Transactions on Power Electronics, 33(2), 1118–1134.
- Ngo, T., Nguyen, Q., & Santoso, S. (2016). Voltage stability of low frequency ac transmission systems [Paper presentation]. Proceedings of the IEEE/PES Transmission and Distribution Conference and Exposition (T&D) (pp. 1–5).
- Nguyen, Q., Todeschini, G., & Santoso, S. (2019). Power flow in a multifrequency HVac and HVdc system: Formulation, solution, and validation. IEEE Transactions on Power Systems, 34(4), 2487–2497. https://doi.org/10.1109/TPWRS.2019.2896023
- Rosewater, D., Nguyen, Q., & Santoso, S. (2018). Optimal field voltage and energy storage control for stabilizing synchronous generators on flexible ac transmission systems [Paper presentation]. Proceedings of the IEEE/PES Transmission and Distribution Conference and Exposition (T&D) (pp. 1–9).
- Ruddy, J., Meere, R., O’Loughlin, C., & O’Donnell, T. (2016). Scaled hardware verification of low frequency AC transmission system for interconnection of offshore wind [Paper presentation]. 5th IET International Conference on Renewable Power Generation (RPG) 2016 (pp. 1–6).
- Yoo, H.-J., Nguyen, T.-T., & Kim, H.-M. (2017). Multi-frequency control in a stand-alone multi-microgrid system using a back-to-back converter. Energies, 10(6), 822. https://doi.org/10.3390/en10060822
- Zhao, B., Zhang, X., & Chen, J. (2012). Integrated microgrid laboratory system. IEEE Transactions on Power Systems, 27(4), 2175–2185. https://doi.org/10.1109/TPWRS.2012.2192140