
 ?Mathematical formulae have been encoded as MathML and are displayed in this HTML version using MathJax in order to improve their display. Uncheck the box to turn MathJax off. This feature requires Javascript. Click on a formula to zoom.
Abstract
Many countries are experiencing rapid growth in the small and medium-sized fruit processing sector. This significantly contributes to the Gross Domestic Product (GDP), particularly in developing countries. The objective of this study is to employ the Sustainability Performance Assessment (SPA) model in the context of Small and Medium-Sized Enterprises (SMEs) through the integration of the Fuzzy Analytical Hierarchy Process (FAHP) and the sustainability index formula. This study examines SMEs in Indonesia that produce fruit chips. Based on the findings of this research, the most important aspects of sustainability are economic, followed by social, technological and environmental. Besides that, it was discovered that the performance of several fruit chip SMEs in Indonesia scored low. Economic performance is considered less (37%: lack of sustainability), while it is poor (not sustainable) in social, technological and environmental aspects, with respective values of (24.38%), (15.09%) and (20.89%). In addition to the presentation of the sustainability performance index, a set of strategic recommendations were formulated to enhance the sustainability performance of SMEs in accordance with their respective sustainability index status. The strategy formulation is classified based on each indicator in the sustainability aspect.
Reviewing Editor:
1. Introduction
Sustainable manufacturing refers to a structured process of converting raw materials into desired products while minimizing waste, energy usage, greenhouse gas (GHG) emissions, the utilization of non-renewable and toxic substances, and other detrimental environmental effects (Gani et al., Citation2021). Society, government and communities have encouraged the manufacturing industry toward sustainability (Sartal et al., Citation2020). Basically, sustainable manufacturing is defined as industrial and human design that ensures the use of natural resources without affecting the quality of life due to lost future economic opportunities or negatively impacting human health and the environment (Mihelcic et al., Citation2003). Sustainability is primarily focused on the Triple Bottom Line (TBL), which asserts that the economic, social, and environmental dimensions of performance are interconnected and of the same level of importance (Morais & Silvestre, Citation2018). The TBL approach involves extending corporate responsibility to environmental and social directions, which has been limited to monetary manufacturing, legality and quality issues (Gao & Zhang, Citation2006; Sartal et al., Citation2020). Economics is the simplest dimension as it is often the only thing considered in sustainable manufacturing (Zarte et al., Citation2019). The environmental dimension focuses on reducing pollution risks in accordance with laws and regulations, as well as continuous improvement goals, whereas the social dimension focuses on social impact and responsibility (Sartal et al., Citation2020).
The functional aspects of sustainable design theory contribute to the advancement of knowledge about the realization of sustainability transitions. This is achieved through the transformation of various elements, such as products, human behavior, commercial services, cities and ultimately the entire socio-economic system (Ceschin & Gaziulusoy, Citation2016; Gaziulusoy & Öztekin, Citation2019). The successful implementation of sustainable practices is the result of corporate movements toward sustainable structures, which also benefit industrial operations (Fauzi et al., Citation2021). The failure to implement parts of sustainability can lead to a number of negative effects on the environment, including a reduction in biodiversity, damage to the land, emissions of GHG and use of resources, among other things (Kumar & Pant, Citation2023; Liu et al., Citation2019).
The rise in industrialization and globalization, along with population expansion, has significantly contributed to the increase in agricultural and industrial activities on a global scale (Yafetto et al., Citation2023). In developing countries, such as Indonesia, industrial development is dominated by medium-scale and small-scale industries (Santoso et al., Citation2018). Based on BPS data, in 2021 the number of SMEs in Indonesia will reach 1,221,015. The number of SMEs in 2021 has increased compared to the previous year, which was 1,088,333. The contribution of SME scale industries contributes significantly to the national economy, providing employment and contributing to Gross Domestic Product (GDP) (Taneo et al., Citation2020). SMEs that develop in Indonesia contribute 60% of the country’s total GDP and can employ up to 90% of the workforce (Surya et al., Citation2021), so their existence is critical to the country’s economic growth. Further investigation reveals that the developing industry is predicated on agricultural products, particularly fruit. This is due to the fact that the industry is located in one of the countries that produce a wide variety of tropical fruits. The conversion of raw materials into products with significant added value can be facilitated by small and medium scale processing industries (Timisela et al., Citation2021).
In 2022, Indonesia’s fruit harvest is projected to reach a whopping 27,712,183 tons, which is a significant increase from the country’s current level of 25,975,609 tons. East Java is the leading producer of fruit in the world, with a total harvest of 8,174,009 kg. Competition is an unavoidable aspect of marketing and selling agro-industrial products, and it presents a challenge for all businesses, including small fruit chip businesses in Indonesia (Arief et al., Citation2013). In order to increase the production of processed goods in rural areas, it is required to implement empowerment strategies and institutional development through the provision of guidance and training programs. Manufacturing industries must adopt a systematic sustainability approach to effectively enhance their return on investment and minimize their environmental footprint. This is crucial as these industries develop diverse infrastructures that facilitate the implementation of this strategy (Machado et al., Citation2020; Santoso, Pranowo, Wijana et al., Citation2023; Santoso, Purnomo, Sulianto et al., Citation2023). Before advancing forward with the implementation of sustainable manufacturing, it is critical to assess current sustainability performance (Santoso, Pranowo, Wijana, et al., Citation2023; Santoso, Purnomo, Sulianto, et al., Citation2023).
Sustainability performance assessment (SPA) is a method used to evaluate the efficiency of sustainability performance (Bhyan et al., Citation2023). Assessment of the sustainability aspect becomes complicated because there are considerations of environmental and social criteria (Liu et al., Citation2019), and nowadays involves technology criteria (Pylaeva et al., Citation2022). Numerous industries face challenges in assessing sustainability performance due to a lack of knowledge (Badurdeen et al., Citation2012; Zhang et al., Citation2021), especially SMEs. According to Alraja et al. (Citation2022), SMEs face numerous obstacles when implementing sustainable practices because they need more resources to achieve long-term sustainability. There are contradictory findings regarding social and environmental practices and SMEs’ economic sustainability. Some studies suggest a negative correlation, particularly in the short term, because these practices may incur upfront costs (Malesios et al., Citation2021). However, this issue can be effectively addressed by implementing appropriate indicators during the evaluation of sustainability in manufacturing units (Swarnakar et al., Citation2022). Several sustainability indicators have been documented in the current literature referring to the manufacturing industry. That is why it is important to investigate and identify the greatest variety of these indicators.
Assessing the concept of sustainability requires complex assessment methods. This assessment is carried out to support decision and policy making in environmental, economic and social contexts (Sharma et al., Citation2020). The utilization of the decision-making process can serve as an effective way to ensure an optimal approach toward improving performance by considering sustainability indicators due to the complexity of existing indicators in each aspect (Ivo de Carvalho et al., Citation2022), so this research proposes an integrated SPA using Fuzzy Analytical Hierarchy Process (FAHP). AHP is a method for making decisions involving multiple criteria, which was initially proposed by Saaty (Citation1987). AHP is a quantitative methodology that employs the input of multiple experts to reach a decision (Santoso & Winanto, Citation2017; Tan et al., Citation2014). This tool outperforms concerning ease of use, systematic problem structuring and calculation of both criteria weights and alternative priorities, but it does have limitations, particularly in its reliance on subjective judgments (Liu et al., Citation2020). As a popular methodology in dealing with uncertainty, Fuzzy Set Theory (FST) developed by Zadeh (Citation1965) is combined with AHP, which is then called FAHP to maintain its advantages and to remain widely applied (Mardani et al., Citation2015). Using FAHP makes it possible to make decisions in situations where there is a lot of uncertainty that are more accurate and right for the situation (Gani et al., Citation2021). This study did not combine AHP and the entropy method, and it did not perform sensitivity analysis to focus on the core functions, which is to focus on providing clear and comprehensive explanations of well-established methods. This ensures that the research can provide reliable information without introducing complexity that could lead to misunderstanding. However, FAHP is used which combines FST and AHP to make more precise prioritization.
The aim of this research is to apply a SPA model using FAHP weighting and the sustainability index formula to Fruit Chips SMEs in Indonesia. This model provides information related to scores and performance levels, making it easier for SME fruit chips business people and decision makers to make improvements within the organization. Furthermore, it is hoped that this research will make a valuable contribution to the comprehension of performance research related to sustainable aspects within the Agri-food industry.
1.1. Research gaps and novelty
There has been a lot of research on SPA. summarizes SPA research published between 2018 and 2023. The SPA studies in this section address sustainability issues, methods, applications and proposed strategies. According to , the majority of the research on SPA employs Multi-Criteria Decision-Making (MCDM) theory. Existing MCDM methods used in SPA studies often come with limitations, such as subjective weighting, overlooking critical sustainability factors, and sometimes insufficiently addressing the complex interrelationships among various criteria. SPA has been applied to SMEs, the agro-food industry, the textile industry, etc., but many studies only assess three aspects of sustainability, namely economic, social and environment. Besides that, many studies do not present proposed sustainability index-based strategies at the end of the study.
Table 1. Literature review on SPA.
This study was conducted to fill the research gap by providing a comprehensive overview of SPA in fruit chip SMEs that assesses four aspects of sustainability, including economic, social, environment and technology. A clear sequence of SPA using an integrated method FAHP and sustainability index calculation formula are presented. The integrated SPA offers a novel approach by addressing these limitations, such as mitigating subjectivity and sustainability index for comprehensiveness. This model is likely to be more accessible and adaptable for smaller businesses compared to complex sustainability assessment frameworks (Jayawickrama et al., Citation2017). FAHP corporates fuzzy logic to account uncertainty and vagueness in decision-making. Integrating it with a sustainability index calculation ensures all aspects (economic, social, environment and technology) are considered. This provides a more thorough assessment of the sustainability of a process. Besides that, this integration empowers SMEs to gain deeper insights into their sustainability performance, identify areas for improvement and make informed decisions to enhance overall sustainability practices and outcomes. The strength of this study is the presentation of strategies based on the sustainability index at the end of the study. Where it helps decision-makers take action to improve their company’s sustainability performance.
2. Methods
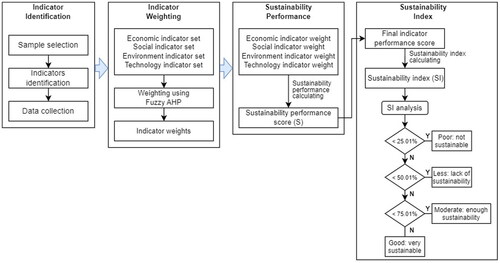
The proposed SPA framework is described in this section. It was used to assess the performance of fruit chip SMEs in Malang, Indonesia. The proposed framework is shown in . It shows three primary stages, which are as follows: (1) Indicators Identification, (2) Indicator Weighting Using FAHP, (3) Assessment of the Sustainability Performance. At the end, formulation of strategies for increasing sustainability performance is presented.
Figure 1. Proposed framework.
2.1. Indicators identification
This study was conducted in Indonesia, one of the countries with the highest concentration of SMEs. Specifically, the research location is in Malang Regency, which has a total of 7920 SMEs. Several factors influenced the decision to select this location, including the fact that food SMEs contribute significantly to the Malang Regency economy through labor absorption and regional income. Furthermore, the region’s vision and mission seek to strengthen the competitiveness and innovation of food SMEs.
This stage was carried out to determine sustainability indicators for SMEs as a basis for assessing sustainability and enhancing their business (Gani et al., Citation2021). Identification of indicators is carried out using literature reviews and expert judgments through a questionnaire distribution. Through literature review, researchers delve into existing academic publications, reports and industry standards related to the specific field of this study. Combining these methods provides a strong foundation for indicator of sustainability development. Three questionnaires were used in the study: the criteria selection questionnaire and sustainability indicators, the FAHP questionnaire and the sustainability questionnaire. The questionnaire was developed after considering previous research findings in this field and observations. The questionnaire was validated by expert respondents, specifically professors of agro-industrial management. The questionnaire was distributed to experts for completion, after which consistency testing and data analysis were conducted. We have obtained verbal consent from participants as expert panelists to provide assessment or justification according to the FAHP method, which will be published later. In addition, the use of human participants in this study has been reviewed and approved by the Ethics Committee Faculty of Agricultural Technology, Universitas Brawijaya through Ethics Clearance Letter No. 2651.3/UN10.F10.01/PT.02/2022.
The questionnaire was completed using expert judgment, which is the process of gathering knowledge and insights from individuals with specialized knowledge and experience in a particular domain. These experts can be leveraged to inform decision-making, problem-solving and various research activities (Simola et al., Citation2005). Expert judgment can play a crucial role in developing a strong questionnaire for SPA in SMEs, particularly when integrating FAHP with a sustainability index calculation. This approach can help mitigate potential biases that might creep into the questionnaire design or weighting process. Their diverse perspectives can lead to a more balanced and objective assessment tool. This study using expert judgment, with 4 experts that have expertise which can represent the condition. The panel of experts included two academics and two agroindustry practitioners. Academics include lecturers with 5–10 years of teaching and research experience in agroindustrial sustainability, as well as doctoral degrees. Practitioners, on the other hand, are the owners of fruit chip SMEs with around 20 years of experience in the industry. Thus, the researchers ensured that the experts could represent both the model and the real-world conditions of implementing sustainability practices in SMEs.
There are three sustainability indicators called the TBL, namely economic, social and environmental. Besides that, technology is also an important indication of sustainable development (Pylaeva et al., Citation2022). According to Raymond and St-Pierre (Citation2010), one of the fundamental factors to boosting the competitiveness of SMEs is technology. Thus, this study raises four indicators of sustainability, namely economic, social, environmental and technology.
2.2. Aspect weighting using FAHP
Analytical Hierarchy Process (AHP) is a multi-criteria decision making technique proposed by Saaty (Citation1987). Chang (Citation1996), developed FAHP, which combined FST and AHP to reduce data ambiguity. According to Gani et al. (Citation2021), FAHP is better than classical AHP because it may produce more accurate decision making. In this research, calculating the weight of each aspect of sustainability is done by converting data in the form of linguistic variables into Triangular Fuzzy Number (TFN). Linguistic variables and TFN can be seen in .
Table 2. Linguistic variables and TFN.
The FAHP stage begins by creating a pairwise comparison matrix. On the basis of the information obtained through the questionnaire, the comparison matrix was created. The scores on the questionnaire were obtained based on the Saaty’s nine-point scale (Santoso et al., Citation2018). The pairwise comparison matrix can be seen in EquationEquation (1)(1)
(1) .
(1)
(1)
where xij is the value of factor i that has been normalized by factor j.
The next step is to carry out a consistency test on each pairwise comparison matrix in order to ensure that the experts’ assessments of the aspects and indicators are consistent. After that, the pairwise comparison matrix is normalized by dividing each column element by the sum of all column elements using EquationEquation (2)(2)
(2) .
(2)
(2)
where n is the number of criterions selected for comparison.
The next step is to calculate the eigenvectors xi and the largest eigenvalue (λmax). Eigen vectors are calculated using EquationEquation (3)(3)
(3) , and λmax is calculated using EquationEquation (4)
(4)
(4) .
(3)
(3)
(4)
(4)
is used to calculate the consistency index (CI) by using EquationEquation (5)
(5)
(5) . The Random Index (RI) is derived from Nazim et al. (Citation2022) and is employed to compute the Consistency Ratio (CR) by dividing the CI by the RI, as shown in EquationEquation (6)
(6)
(6) . If the CR < 0.1 then it means that the consistency of the matrix is acceptable, otherwise if it exceeds the predetermined value, the pairwise comparison must be repeated till acceptable CR < 0.1 (Nazim et al., Citation2022).
(5)
(5)
(6)
(6)
where n is the number of criterions.
After calculating the CR, continue by calculating the average of the expert fuzzification matrices to form Fuzzy Comparison Matrices (FCMs). The average is calculated using the Geometric Mean (GM) shown in EquationEquation (7)(7)
(7) .
(7)
(7)
The results of EquationEquation (7)(7)
(7) are used to calculate the TFN rating scale given by each respondent, so that a combined FCMs is formed from all respondents. The average
ij,
ij and
ij for all respondents are calculated using EquationEquation (8)
(8)
(8) .
(8)
(8)
The next step is to determine the fuzzy synthetic extent value (Si) using EquationEquation (9)(9)
(9) . Here,
shows the number of values in the row columns of the matrix formulated in EquationEquation (10)
(10)
(10) , M denotes TFN number, m denotes number of criteria, j denotes column index, i denotes row index and g denotes TFN parameters (l, m, u). Furthermore, to get the inverse of EquationEquation (4)
(4)
(4) can be done using mathematical operations as in EquationEquation (11)
(11)
(11) .
(9)
(9)
(10)
(10)
(11)
(11)
The next step is to determine the degree of possibility. For two TFNs with and
is obtained by EquationEquation (12)
(12)
(12) .
(12)
(12)
The above expression can be defined as EquationEquation (13)(13)
(13) .
(13)
(13)
Next step, assessing defuzzification using the model in EquationEquation (14)(14)
(14) , it is then assumed that
for k = 1,2,…,n; k
and the weight vector value is determined using EquationEquation (15)
(15)
(15) . The final step, the weight vector value obtained in the previous equation is normalized to obtain a non-fuzzy number using the formula in EquationEquation (16)
(16)
(16) .
(14)
(14)
where i = 1,2,…,k
(15)
(15)
(16)
(16)
where
is n element,
is value that describes the relative choice of each decision attribute, and T denotes the transposition operation, which converts a column vector into a row vector or vice versa.
The normalization weight for each factor is ranked to determine the aspects and indicators that most influence the sustainability of the performance of fruit chips SMEs in Indonesia. The highest weight indicates that the aspects and indicators are most important.
2.3. Assessment of the sustainability performance
The FAHP weighting results are used to calculate SME performance sustainability assessment. The analysis was divided into two stages: the performance assessment of sustainability aspects and the SME sustainability index. The performance assessment of sustainability aspects is calculated using the formulation in EquationEquation (17)(17)
(17) . The performance value of each sustainability aspect is then used in calculating the SME sustainability index using the formula in EquationEquation (18)
(18)
(18) .
(17)
(17)
(18)
(18)
where S is performance of sustainability aspect, Wwxyz is weight of each indicator on the sustainability aspect, variables w, x, y, and z represent each sustainability indicator (w = economic, x = social, y = environment, z = technology), i is survey results of each indicator on sustainability aspects, is a sustainability scale obtained from expert judgment. The sustainability scale is 1–5 (very bad to very good), this scale is commonly used to evaluate the sustainability performance of something, such as a business, product or process, n is the highest rating scale on the questionnaire, SI is sustainability index, W is weight of sustainability aspects calculated from the normalization of the FAHP weight vector.
The results of calculating the sustainability index are used to categorize SMEs based on the sustainability index status table presented in . The range of numbers for the sustainability index status is determined using the poor (0%) and good (100%) ordination technique in Microsoft Excel carried out by Kavanagh and Pitcher (Citation2004).
Table 3. Sustainability index status category.
3. Results and discussion
3.1. Assessing sustainability: aspects, indicators and weighting results for fruit chips SMEs
There are four assessment indicators on economic aspects, six assessment indicators on social aspects, three assessment indicators on environmental aspects, and four indicators on technological aspects. shows results in identifying aspects and indicators of sustainability in Indonesian fruit chips SMEs. Then, shows results in identifying aspects and indicators of sustainability in Indonesian fruit chips SMEs in the form of a hierarchical structure. The hierarchical structure consists of three levels which can be seen in . The model’s goal is Level 1, which reflects the prioritizing the sustainability aspects and indicators in fruit chips SMEs as determined through the index score. At Level 2, the index score is calculated using a number of sustainability aspects. At Level 3, each aspect has a sustainability indicator.
Figure 2. SPA Indicators in Indonesian Fruit Chips SMEs.

Figure 3. Hierarchical structure.
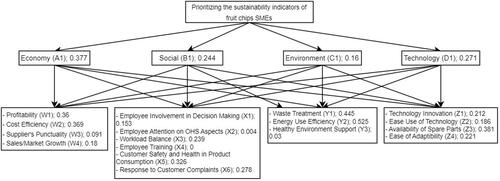
The provided data () illustrates that the economic aspect carries the greatest significance with a weight of 0.377, followed by the social aspect with a weight of 0.244. Later on, the technological aspect holds a weight of 0.217, while the environmental aspect possesses the lowest weight of 0.16. This finding aligns with the research conducted by Santoso, Pranowo, Wijana et al. (Citation2023) and Santoso, Purnomo, Sulianto, et al. (Citation2023), which emphasizes the significance of economics and social factors within the agri-food sector. According to Sartal et al. (Citation2020), social aspects are more difficult to grasp and comprehend because measuring social impact and responsibility is a difficult task, particularly for SMEs. This concept of responsibility is commonly associated with Corporate Social Responsibility (CSR), but SMEs have not been able to achieve it. On the other hand, these findings contradict Hsu et al. (Citation2017), who discovered that the environment is a top priority in the development of sustainable SMEs in Taiwan. This indicates that SMEs in Malang Regency keep up to prioritize increasing their economic value over environmental sustainability.
The indicator with the highest weight in the economic aspect is cost efficiency/W2 (0.369). Cost efficiency is a component of cost behavior that refers to multiple strategies aimed at reducing expenses within the production process. This indicator is considered important because it can help industry in making cost plans, so that cost control can be easier and help the decision making process (Sharma et al., Citation2023; Sinambela & Djaelani, Citation2022). Profit is a metric that serves as a measure of the financial performance of an industry. According to Klumpp (Citation2018), the level of profit within an industry serves as an indicator of its economic performance. This perspective matches the viewpoint by Santoso, Pranowo, Wijana, et al. (Citation2023) and Santoso, Purnomo, Sulianto, et al. (Citation2023) positing that elevated profits have the potential to enhance the economic resilience of an industry.
The indicator with the highest weight in the social aspect is customer safety and health in product consumption/X5 (0.326). These results correlate with the results obtained from research written by Gani et al. (Citation2021), which asserts that products, consumers, and employees are significant indicators in the social aspects of an industry. The large number of food safety incidents causes consumers to be more concerned about this problem, so that customer safety and health in product consumption becomes an important social indicator (Hsu et al., Citation2019; Iqbal et al., Citation2021).
The indicator with the highest weight in the environmental aspect is energy use efficiency/Y2 (0.525). Energy use efficiency is reducing energy use in an activity without reducing the amount of output. In line with the point of view of Zakari et al. (Citation2022), which states that the amount of energy use can affect economic activities and environmental sustainability. Therefore, energy use efficiency must be applied to an industry to reduce the amount of carbon emissions. An environmental indicator that is no less important is waste treatment. In the research of Santoso, Pranowo, Wijana, et al. (Citation2023) and Santoso, Purnomo, Sulianto, et al. (Citation2023), waste treatment can take the form of reuse to reduce negative impacts on the environment.
The indicator with the highest weight in the technological aspect is availability of spare parts/Z3 (0.381). Availability of spare parts is an important indicator in the manufacturing process. In line with the point of view of Antosz and Ratnayake (Citation2019), who state that manufacturing systems are becoming more complex along with global development, so that optimal spare parts inventory control has an important role in maintaining the level of operational competitiveness. An indicator that is no less important is technological innovation. Dwivedi et al. (Citation2023) stated that technological innovation has been widely recognized as a catalyst in achieving sustainability.
3.2. Results of the sustainability performance assessment
The calculation of the sustainability index has been done using EquationEquations (17)(17)
(17) and Equation(18)
(18)
(18) which are presented in . The table shows the SMEs sustainability index value in each aspect using the scale contained in the sustainability index status category table. The status category table of sustainability is used to make it easier for SMEs to provide corrective action (Kavanagh & Pitcher, Citation2004; Ramdhani & Hardjomidjojo, Citation2019). The calculation results show that the sustainability index for fruit chips SMEs based on economic aspects is less (37%: lack of sustainability), while it is poor (not sustainable) in social, environmental and technological aspects, with respective values of (24.38%), (15.09%) and (20.89%). These findings suggest that fruit chip SMEs in Malang have previously focused solely on economic aspects, such as making as much profit as possible and minimizing losses, neglecting other factors.
Table 4. Sustainability performance assessment.
Das et al. (Citation2020) identify two possible reasons why SMEs do not implement sustainability practices: understanding or perception challenges and implementation challenges. The understanding challenge is due to SMEs’ lack of knowledge and awareness regarding the positive or negative effects of their business activities on society and the environment. Implementation challenges are caused by SMEs’ limited resources and capacity to implement sustainable practices. As a result, improvements are required to raise the SME sustainability index, which will be discussed in the following section. According to Gani et al. (Citation2021) and Sutherland et al. (Citation2016), increasing the sustainability index of an industry is necessary to minimize waste, energy consumption, gas emissions and fulfill all sustainability criteria (economic, social, technological and environmental).
3.3. Formulation of strategies for increasing sustainability performance of fruit chips SMEs
This research presented here proposes a model to assess the sustainability performance of fruit chips SMEs. However, managers and decision makers can use this model to assess sustainability performance in various industrial sectors. This model can assess the performance of industrial sustainability aspects and indices which can help decision makers in formulating improvement strategies. The assessment results show that fruit chips SMEs in Indonesia have a less to poor sustainability index, so improvements are needed. Based on the results of weighting sustainability aspects, economic aspects have the highest weight, followed by social aspects, then technological aspects and environmental aspects. This indicates that managers and decision makers are still primarily concerned with enhancing the economic dimensions of performance. categorizes the strategies into two groups according to the sustainability index status categories: less and poor. This should make it easier for decision makers to use an industry’s sustainability index to make decisions or strategies regarding improvement. These strategies are intended to provide guidance to SMEs involved in fruit chip production in the Malang area to promote sustainability in their operations and business growth. Thus, it is hoped that they can implement the strategy proposed by the researcher.
Table 5. Strategies for increasing the sustainability performance of the fruit chips SMEs.
4. Conclusions
This research uses a SPA model based on FAHP weighting and a sustainability index formula. A case study is presented to evaluate the SPA model in Indonesian fruit chips SMEs. The results of the research indicate that the assessment model can be applied to assess the sustainability performance of fruit chip SMEs. Based on the findings of this research, the most important aspects of sustainability are economic, followed by social, technological and environmental. Besides that, it was discovered that the performance of several fruit chip SMEs in Indonesia remained poor. Economic performance is considered less (37%: lack of sustainability), while it is poor (not sustainable) in social, technological and environmental aspects, with respective values of (24.38%), (15.09%) and (20.89%). Therefore, at the end of the research several strategic recommendations are presented to improve the sustainability performance of fruit chips SMEs. Strategies are categorized into two according to the number of sustainability index statuses: less and poor. This research is expected to make a significant contribution to science, but it also has limitations that can be corrected in future research. To address the method’s limitations, future research could integrate the SPA model with sensitivity analysis on weight variations, simulating different weighting scenarios and demonstrating how priorities change. Additionally, an intelligent decision support system (IDSS) could be developed to help fruit chip SMEs evaluate their business sustainability using this SPA model.
Ethical approval
This study protocol was approved by the Ethical Committee Faculty of Agriculture Technology, Universitas Brawijaya, through Ethical Clearance Letter No. 2651.3/UN10.F10.01/PT.02/2022.
Author contribution
Imam Santoso: Conceptualization, methodology, verifying and correcting original draft. Izzum Wafi’uddin: Methodology, writing, reviewing and editing. Naila Maulidina Lu’ayya: Methodology, writing, reviewing and editing. Annisa’u Choirun: Conceptualization, methodology, reviewing original draft. Mangku Purnomo: Conceptualization, methodology and reviewing original draft. Akhmad Adi Sulianto: Conceptualization, methodology and reviewing original draft.
Disclosure statement
The authors declare that they have no known competing financial interests or personal relationships that could have appeared to influence the work reported in this article.
Data availability
Raw data were generated at Universitas Brawijaya. Derived data supporting the findings of this study are available from the corresponding author Imam Santoso* on request.
Additional information
Funding
References
- Aktaş, N., & Demirel, N. (2021). A hybrid framework for evaluating corporate sustainability using multi-criteria decision making. Environment, Development and Sustainability, 23(10), 15591–15618. https://doi.org/10.1007/s10668-021-01311-5
- Alraja, M. N., Imran, R., Khashab, B. M., & Shah, M. (2022). Technological innovation, sustainable green practices and SMEs sustainable performance in times of crisis (COVID-19 pandemic). Information Systems Frontiers: a Journal of Research and Innovation, 24(4), 1081–1105. https://doi.org/10.1007/s10796-022-10250-z
- Antosz, K., & Ratnayake, R. M. C. (2019). Spare parts’ criticality assessment and prioritization for enhancing manufacturing systems’ availability and reliability. Journal of Manufacturing Systems, 50, 212–225. https://doi.org/10.1016/j.jmsy.2019.01.003
- Arief, M., Thoyib, A., Sudiro, A., & Rohman, F. (2013). The effect of entrepreneurial orientation on the firm performance through strategic flexibility: A study on the SMEs Cluster in Malang. Journal of Management Research, 5(3), 44–62. https://doi.org/10.5296/jmr.v5i3.3339
- Badi, I., Muhammad, L. J., Abubakar, M., & Bakır, M, M. (2022). Measuring sustainability performance indicators using FUCOM-MARCOS. Operational Research in Engineering Sciences: Theory and Applications, 5(2), 99–116. https://doi.org/10.31181/oresta040722060b
- Badurdeen, F., Gregory, R., Luhan, G., Schroeder, M., Vincent, L., & Sekulic, D. (2012). System thinking for sustainability: Envisioning transdisciplinary transformations in STEM education. Learning, 11, 1–6. https://www.academia.edu/download/41075675/ISSST-2012-PAPER.pdf
- Bhyan, P., Shrivastava, B., & Kumar, N. (2023). Allocating weightage to sustainability criteria’s for performance assessment of group housing developments: Using fuzzy analytic hierarchy process. Journal of Building Engineering, 65, 105684. https://doi.org/10.1016/j.jobe.2022.105684
- Ceschin, F., & Gaziulusoy, I. (2016). Evolution of design for sustainability: From product design to design for system innovations and transitions. Design Studies, 47, 118–163. https://doi.org/10.1016/j.destud.2016.09.002
- Chang, D.-Y. (1996). Applications of the extent analysis method on fuzzy AHP. European Journal of Operational Research, 95(3), 649–655. https://doi.org/10.1016/0377-2217(95)00300-2
- Das, M., Rangarajan, K., & Dutta, G. (2020). Corporate sustainability in SMEs: An Asian perspective. Journal of Asia Business Studies, 14(1), 109–138. https://doi.org/10.1108/JABS-10-2017-0176
- Dwivedi, A., Sassanelli, C., Agrawal, D., Gonzalez, E. S., & D'Adamo, I. (2023). Technological innovation toward sustainability in manufacturing organizations: A circular economy perspective. Sustainable Chemistry and Pharmacy, 35, 101211. https://doi.org/10.1016/j.scp.2023.101211
- Ecer, F. (2021). Sustainability assessment of existing onshore wind plants in the context of triple bottom line: A best-worst method (BWM) based MCDM framework. Environmental Science and Pollution Research International, 28(16), 19677–19693. https://doi.org/10.1007/s11356-020-11940-4/Published
- Engida, T. G., Rao, X., Berentsen, P. B. M., & Oude Lansink, A. G. J. M. (2018). Measuring corporate sustainability performance– the case of European food and beverage companies. Journal of Cleaner Production, 195, 734–743. https://doi.org/10.1016/j.jclepro.2018.05.095
- Fauzi, N. S., Johari, N., Zainuddin, A., & Chuweni, N. N. (2021). The importance of sustainability implementation for business corporations. Planning Malaysia, 19(17), 238–248. https://doi.org/10.21837/pm.v19i17.1002
- Gani, A., Asjad, M., & Talib, F. (2021). Prioritization and ranking of indicators of sustainable manufacturing in Indian MSMEs using fuzzy AHP approach. Materials Today: Proceedings, 46, 6631–6637. https://doi.org/10.1016/j.matpr.2021.04.101
- Gao, S. S., & Zhang, J. J. (2006). Stakeholder engagement, social auditing and corporate sustainability. Business Process Management Journal, 12(6), 722–740. https://doi.org/10.1108/14637150610710891
- Gaziulusoy, Ï., & Öztekin, E. E. (2019). Design for sustainability transitions: Origins, attitudes and future directions. Sustainability (Switzerland), 11(13), 3601. https://doi.org/10.3390/su11133601
- Goyal, S., Agarwal, S., Singh, N. S. S., Mathur, T., & Mathur, N. (2022). Analysis of hybrid MCDM methods for the performance assessment and ranking public transport Sector: A case study. Sustainability, 14(22), 15110. https://doi.org/10.3390/su142215110
- Hsu, S. Y., Chang, C. C., & Lin, T. T. (2019). Triple bottom line model and food safety in organic food and conventional food in affecting perceived value and purchase intentions. British Food Journal, 121(2), 333–346. https://doi.org/10.1108/BFJ-07-2017-0403
- Hsu, C. H., Chang, A. Y., & Luo, W. (2017). Identifying key performance factors for sustainability development of SMEs – integrating QFD and fuzzy MADM methods. Journal of Cleaner Production, 161, 629–645. https://doi.org/10.1016/j.jclepro.2017.05.063
- Iqbal, J., Yu, D., Zubair, M., Rasheed, M. I., Khizar, H. M. U., & Imran, M. (2021). Health consciousness, food safety concern, and consumer purchase intentions toward organic food: The role of consumer involvement and ecological motives. SAGE Open, 11(2), 215824402110157. https://doi.org/10.1177/21582440211015727
- Ivo de Carvalho, M., Relvas, S., & Barbosa-Póvoa, A. P. (2022). A roadmap for sustainability performance assessment in the context of agri-food supply chain. Sustainable Production and Consumption, 34, 565–585. https://doi.org/10.1016/j.spc.2022.10.001
- Jayawickrama, H. M. M. M., Kulatunga, A. K., & Mathavan, S. (2017). Fuzzy AHP based plant sustainability evaluation method. Procedia Manufacturing, 8, 571–578. https://doi.org/10.1016/j.promfg.2017.02.073
- Jiang, Q., Liu, Z., Liu, W., Li, T., Cong, W., Zhang, H., & Shi, J. (2018). A principal component analysis based three-dimensional sustainability assessment model to evaluate corporate sustainable performance. Journal of Cleaner Production, 187, 625–637. https://doi.org/10.1016/j.jclepro.2018.03.255
- Kavanagh, P., & Pitcher, T. J. (2004). Implementing microsoft excel software for rapfish: A technique for the rapid appraisal of fisheries status. Fisheries Centre Research Reports. Fisheries Centre, University of British Columbia, Canada.
- Klumpp, M. (2018). How to achieve supply chain sustainability efficiently? Taming the triple bottom line split business cycle. Sustainability (Switzerland), 10(2), 397. https://doi.org/10.3390/su10020397
- Kumar, A., & Pant, S. (2023). Analytical hierarchy process for sustainable agriculture: An overview. MethodsX, 10, 101954. https://doi.org/10.1016/j.mex.2022.101954
- Kumar, M., Sharma, M., Raut, R. D., Mangla, S. K., & Choubey, V. K. (2022). Performance assessment of circular driven sustainable agri-food supply chain towards achieving sustainable consumption and production. Journal of Cleaner Production, 372, 133698. https://doi.org/10.1016/j.jclepro.2022.133698
- Lee, Z. Y., Chu, M. T., Wang, Y. T., & Chen, K. J. (2020). Industry performance appraisal using improved MCDM for next generation of Taiwan. Sustainability, 12(13), 5290. https://doi.org/10.3390/su12135290
- Liu, Y., Eckert, C. M., & Earl, C. (2020). A review of fuzzy AHP methods for decision-making with subjective judgements. Expert Systems with Applications, 161, 113738. https://doi.org/10.1016/j.eswa.2020.113738
- Liu, Y., Eckert, C., Yannou-Le Bris, G., & Petit, G. (2019). A fuzzy decision tool to evaluate the sustainable performance of suppliers in an agrifood value chain. Computers and Industrial Engineering, 127, 196–212. https://doi.org/10.1016/j.cie.2018.12.022
- Machado, C. G., Winroth, M. P., & Ribeiro da Silva, E. H. D. (2020). Sustainable manufacturing in Industry 4.0: An emerging research agenda. International Journal of Production Research, 58(5), 1462–1484. https://doi.org/10.1080/00207543.2019.1652777
- Malesios, C., De, D., Moursellas, A., Dey, P. K., & Evangelinos, K. (2021). Sustainability performance analysis of small and medium sized enterprises: Criteria, methods and framework. Socio-Economic Planning Sciences, 75, 100993. https://doi.org/10.1016/j.seps.2020.100993
- Mardani, A., Jusoh, A., & Zavadskas, E. K. (2015). Fuzzy multiple criteria decision-making techniques and applications - Two decades review from 1994 to 2014. Expert Systems with Applications, 42(8), 4126–4148. https://doi.org/10.1016/j.eswa.2015.01.003
- Mihelcic, J. R., Crittenden, J. C., Small, M. J., Shonnard, D. R., Hokanson, D. R., Zhang, Q., Chen, H., Sorby, S. A., James, V. U., Sutherland, J. W., & Schnoor, J. L. (2003). Sustainability science and engineering: The emergence of a new metadiscipline. Environmental Science & Technology, 37(23), 5314–5324. https://doi.org/10.1021/es034605h
- Morais, D. O. C., & Silvestre, B. S. (2018). Advancing social sustainability in supply chain management: Lessons from multiple case studies in an emerging economy. Journal of Cleaner Production, 199, 222–235. https://doi.org/10.1016/j.jclepro.2018.07.097
- Nazim, M., Wali Mohammad, C., & Sadiq, M. (2022). A comparison between fuzzy AHP and fuzzy TOPSIS methods to software requirements selection. Alexandria Engineering Journal, 61(12), 10851–10870. https://doi.org/10.1016/j.aej.2022.04.005
- Pislaru, M., Herghiligiu, I. V., & Robu, I. B. (2019). Corporate sustainable performance assessment based on fuzzy logic. Journal of Cleaner Production, 223, 998–1013. https://doi.org/10.1016/j.jclepro.2019.03.130
- Pylaeva, I. S., Podshivalova, M. V., Alola, A. A., Podshivalov, D. V., & Demin, A. A. (2022). A new approach to identifying high-tech manufacturing SMEs with sustainable technological development: Empirical evidence. Journal of Cleaner Production, 363, 132322. https://doi.org/10.1016/j.jclepro.2022.132322
- Rahman, I., & Dey, P. (2021). Corporate sustainability performance brenchmarking of best practicing Bangladeshi RMG companies using Analytical Network Process (ANP). Journal of Knowledge Globalization, 13, 144. https://openurl.ebsco.com/EPDB%3Agcd%3A13%3A869837/detailv2?sid=ebsco%3Aplink%3Acrawler&id=ebsco%3Agcd%3A155794890
- Ramdhani, F., & Hardjomidjojo, H. (2019). Analysis of small and medium enterprises performance index in Bogor City. Jurnal Rekayasa Dan Manajemen Agroindustri, 7(1), 133–152. https://doi.org/10.24843/JRMA.2019.v07.i01.p14
- Raymond, L., & St-Pierre, J. (2010). R&D as a determinant of innovation in manufacturing SMEs: An attempt at empirical clarification. Technovation, 30(1), 48–56. https://doi.org/10.1016/j.technovation.2009.05.005
- Saaty, R. W. (1987). The analytic hierarchy process-what it is and how it is used. Mathematical Modelling, 9(3–5), 161–176. https://doi.org/10.1016/0270-0255(87)90473-8
- Santoso, I., Pranowo, D., Wijana, S., Choirun, A., & Putra, V. P. (2023). Sustainability performance evaluation of fruit chip SMEs, in. IOP Conference Series: Earth and Environmental Science, 1153(1), 012008. https://doi.org/10.1088/1755-1315/1153/1/012008
- Santoso, I., Purnomo, M., Sulianto, A. A., Choirun, A., Azizah, N., Fisdausyi, I. A., & Utama, D. M. (2023). An integrated method for sustainable performance assessment: A case study on Indonesian Coffee Agro-food Industry. Process Integration and Optimization for Sustainability, 8(1), 207–222. https://doi.org/10.1007/s41660-023-00361-8
- Santoso, I., Rahmatin, N., Indriani, C., Rahayu, S., & Widyaningtyas, S. (2018). Integration of the fuzzy failure mode and effect analysis (Fuzzy FMEA) and the Analytical Network Process (ANP) in marketing risk analysis and mitigation. International Journal of Technology, 9(4), 809–818. https://doi.org/10.14716/ijtech.v9i4.2197
- Santoso, I., & Winanto, E. A. (2017). Integration Fuzzy FMEA and AHP method in risk management of shallot supply chain. Jurnal Teknologi Industri & Hasil Pertanian, 22, 21–32.
- Sartal, A., Bellas, R., Mejías, A. M., & García-Collado, A. (2020). The sustainable manufacturing concept, evolution and opportunities within industry 4.0: A literature review. Advances in Mechanical Engineering, 12(5), 168781402092523. https://doi.org/10.1177/1687814020925232
- Sharma, M., Joshi, S., & Govindan, K. (2023). Overcoming barriers to implement digital technologies to achieve sustainable production and consumption in the food sector: A circular economy perspective. Sustainable Production and Consumption, 39, 203–215. https://doi.org/10.1016/j.spc.2023.04.002
- Sharma, R., Kamble, S. S., Gunasekaran, A., Kumar, V., & Kumar, A. (2020). A systematic literature review on machine learning applications for sustainable agriculture supply chain performance. Computers & Operations Research, 119, 104926. https://doi.org/10.1016/j.cor.2020.104926
- Simola, K., Mengolini, A., & Bolado-Lavin, R. (2005). Institute for energy formal expert judgement an overview.
- Sinambela, E. A., & Djaelani, M. (2022). Cost behavior analysis and categorization. Journal of Social Science Studies (JOS3), 2(1), 13–16. https://doi.org/10.56348/jos3.v2i1.18
- Singh, S., Olugu, E. U., Musa, S. N., & Mahat, A. B. (2018). Fuzzy-based sustainability evaluation method for manufacturing SMEs using balanced scorecard framework. Journal of Intelligent Manufacturing, 29(1), 1–18. https://doi.org/10.1007/s10845-015-1081-1
- Surya, B., Menne, F., Sabhan, H., Suriani, S., Abubakar, H., & Idris, M. (2021). Economic growth, increasing productivity of SMEs, and open innovation. Journal of Open Innovation: Technology, Market, and Complexity, 7(1), 20. https://doi.org/10.3390/joitmc7010020
- Sutherland, J. W., Richter, J. S., Hutchins, M. J., Dornfeld, D., Dzombak, R., Mangold, J., Robinson, S., Hauschild, M. Z., Bonou, A., Schönsleben, P., & Friemann, F. (2016). The role of manufacturing in affecting the social dimension of sustainability. CIRP Annals, 65(2), 689–712. https://doi.org/10.1016/j.cirp.2016.05.003
- Swarnakar, V., Singh, A. R., Antony, J., Jayaraman, R., Tiwari, A. K., Rathi, R., & Cudney, E. (2022). Prioritizing indicators for sustainability assessment in manufacturing process: An integrated approach. Sustainability (Switzerland), 14(6), 3264. https://doi.org/10.3390/su14063264
- Tan, R. R., Aviso, K. B., Huelgas, A. P., & Promentilla, M. A. B. (2014). Fuzzy AHP approach to selection problems in process engineering involving quantitative and qualitative aspects. Process Safety and Environmental Protection, 92(5), 467–475. https://doi.org/10.1016/j.psep.2013.11.005
- Taneo, S. Y. M., Hadiwidjojo, D., Sunaryo, S., & Sudjatno, S. (2020). Creative destruction and knowledge creation as the mediation between innovation speed and competitiveness of food small and medium-sized enterprises in Malang, Indonesia. Competitiveness Review: An International Business Journal, 30(2), 195–218. https://doi.org/10.1108/CR-12-2017-0090
- Timisela, N. R., Masyhuri, M., & Darwanto, D. H. (2021). Development strategy of sago local food agroindustry using analytical Hierarchy Process method. AGRARIS: Journal of Agribusiness and Rural Development Research, 7(1), 36–52. https://doi.org/10.18196/agraris.v7i1.9378
- Wicher, P., Zapletal, F., & Lenort, R. (2019). Sustainability performance assessment of industrial corporation using Fuzzy Analytic Network Process. Journal of Cleaner Production, 241, 118132. https://doi.org/10.1016/j.jclepro.2019.118132
- Yafetto, L., Odamtten, G. T., & Wiafe-Kwagyan, M. (2023). Valorization of agro-industrial wastes into animal feed through microbial fermentation: A review of the global and Ghanaian case. Heliyon, 9(4), e14814. https://doi.org/10.1016/j.heliyon.2023.e14814
- Zadeh, L. A. (1965). Fuzzy sets. Information and Control, 8(3), 338–353. https://doi.org/10.1016/S0019-9958(65)90241-X
- Zakari, A., Khan, I., Tan, D., Alvarado, R., & Dagar, V. (2022). Energy efficiency and sustainable development goals (SDGs). Energy, 239, 122365. https://doi.org/10.1016/j.energy.2021.122365
- Zarte, M., Pechmann, A., & Nunes, I. L. (2019). Decision support systems for sustainable manufacturing surrounding the product and production life cycle – A literature review. Journal of Cleaner Production, 219, 336–349. https://doi.org/10.1016/j.jclepro.2019.02.092
- Zhang, H., Veltri, A., Calvo-Amodio, J., & Haapala, K. R. (2021). Making the business case for sustainable manufacturing in small and medium-sized manufacturing enterprises: A systems decision making approach. Journal of Cleaner Production, 287, 125038. https://doi.org/10.1016/j.jclepro.2020.125038