
Abstract
Geopolymer cement is being viewed as an environmentally sustainable substitute for Ordinary Portland Cement (OPC) in oilwell cement. The study examines the impact of varying graphene oxide (GO) concentrations on the mechanical properties of the geopolymer cement. The optimal sodium hydroxide molarity, alkaline activator ratio and GO’s concentration were optimized using Response Surface Methodology based on Central Composite Design to obtain maximize compressive strength formulation. The results show that the highest concentration of GO or the highest molarity of sodium hydroxide can yield the highest strength. Besides, the GO concentration of 0.2% by weight of fly ash (bwof) demonstrate a non-settling and time-independent fluid behaviors at the average test temperature. The formulation results in a 22.9% lower filtrate volume compared to the reference design without GO. The study highlights GO as potential sustainable performance enhancer in geopolymer cement for elevated oilwell condition.
1. Introduction
Ordinary Portland Cement (OPC) has been a staple in the construction industry, however, the production of OPC is associated with significant carbon dioxide emissions. Besides, the cement susceptibility to crack formation, which lead to maintenance and post-repairing job and exhibit lower tensile strength and strain capacity. Graphene and its derivatives have been introduced as the additives in the concrete due to their exceptional mechanical properties. Despite being a relatively new discovery, graphene has already found its way into various industries, including electronics, energy generation, batteries and construction. Graphene oxide (GO), an oxidized form of graphene creates additional nucleation sites in the pores of fresh binder, resulting in enhanced binding in the concrete system. GO has been widely used in the construction industry since 2015 and extensive research has been conducted on its potential applications since then.
Many studies have shown that adding small concentrations of GO can significantly improve the compressive strength of cement mortars and concrete (Gao et al., Citation2021; Gong et al., Citation2014; Kaur et al., Citation2020; Massion et al., Citation2020; Aziz et al., Citation2023). Recent findings show that adding as low as 0.02 weight percent (wt.%) of GO is sufficient to boost more than 50% of the compressive strength (Aziz et al., Citation2023). In addition, prior study found that mortars reinforced with GO concentration between 0.05 and 0.1% had a more compact microstructure with fewer pores than mortars without reinforcement, resulting in enhanced mortar characteristics (Gholampour & Ozbakkaloglu, Citation2022). The GO creates additional nucleation sites in the pores of fresh binder, making more hydration products grow and forming flower-like crystals in the cement’s microstructure (Gao et al., Citation2021; Somasri and Kumar, Citation2021). At the same time, the GO with concentration between 0 and 0.08% by weight of cement (bwoc) demonstrates higher compressive strength by 39 and 26% at 7 and 28 days, respectively (Mohotti et al., Citation2022). Lv et al. (Citation2013) also found that incorporating 0.02 wt.% of GO nanosheet into cement composition is sufficient to increase the compressive strength of the cement. Meanwhile, Gong et al. (Citation2014) and Li et al. (Citation2017) observed an increase in compressive strength by adding GO at concentration between 0.05 and 0.08 wt.%, respectively, to the cement paste.
On the other hand, GO also plays an important role in the oil and gas industry. In drilling mud application, Ikram et al. (Citation2022) showed that the GO able to reduce the filtrate loss by 55.6%. The GO generates a paper-like substance that capable in preventing drilling mud leaks into the well wall due to the sturdy tile-like interlocking of the flakes (Kosynkin et al., Citation2012; Rafati et al., Citation2018). The characteristics may be advantageous for producing a thin impermeable coating to avoid fluid loss in the wellbore (Kosynkin et al., Citation2012; Rafati et al., Citation2018). Besides, GO improves the dynamic cutting suspension and hole-cleaning efficiency of the drilling fluids and reduces the plastic viscosity of the well cement (Ikram et al., Citation2022). According to Massion et al. (Citation2020), adding 0.05 wt.% results in a 4.5% drop in porosity and a 35% decrease in permeability. In comparison to neat cement, the shear strength of cement is increased by 20% with the addition of GO at 0.1% bwoc.
Geopolymer cement is produced from the geopolymerization process of aluminosilicate and alkaline activator. The most common alkaline solution is sodium hydroxide and sodium silicate (Abdullah et al., Citation2012; Zulkarnain et al., Citation2021). In the majority of tests, alkali-activating solutions such as sodium hydroxide and potassium hydroxide are added to sodium silicate to raise the solution’s alkalinity, resulting in more significant compressive strengths (Petermann et al., Citation2010; Palomo et al., Citation1999; Kanesan et al., Citation2018; Srinivasan & Sivakumar, Citation2013). In addition, regardless of the liquid/fly ash ratio, the compressive strength of the solution improves as the concentration of sodium hydroxide increases (Petermann et al., Citation2010; Srinivasan & Sivakumar, Citation2013). At the same time, previous findings found that sodium hydroxide molarity of 12 Molar offered the best compressive strength compared to other concentration (Srinivasan & Sivakumar, Citation2013; Rajesh et al., Citation2014). On the other hand, the optimal compressive strength of fly ash-based geopolymer was achieved at a ratio of 1:2.5 sodium hydroxide to sodium silicate (Srinivasan & Sivakumar, Citation2013; Joshi & Kadu, Citation2012).
Several researchers had also incorporated GO in geopolymer cement (Kaur et al., Citation2020; Somasri and Kumar, Citation2021; Manikanta et al., Citation2021). A study by Kaur et al. (Citation2020) found that the addition 0.02 wt.% of GO enhanced the compressive strength of geopolymer mortar by 35.6%. The study is in agreement with Manikanta et al. (Citation2021), which they stated that at 90 days, the graphene increased the compressive strength of geopolymer cement by 10% as compared to neat OPC. Meanwhile, a study by Khed et al. (Citation2022) found that the addition of GO between 0.03 and 0.05% in the fly ash-based concrete improved significantly at an early stage. However, the research on GO as an additive in pure fly ash-based geopolymer cement system is scarce, especially for oilwell application. Most of the studies were conducted for construction industry and as partial replacement for OPC.
Therefore, the study aims to develop fly ash-based geopolymer cement formulation with GO as the additive at 3,000 psi and 90 °C. The study utilizes Response Surface Methodology (RSM), employing Central Composite Design (CCD) to predict the optimal design parameters for GO, aiming to maximize compressive strength of the cement. Analysis of variance (ANOVA) is employed to evaluate the significance of the interaction factors and the experiment’s validity. Response surface graphs were created for all investigated characteristics and the substantial interaction effects for all identified features were assessed. The obtained optimal formulation was then proceeded with oilwell cement testing including rheology, fluid loss and thickening time tests as according to American Petroleum Institute (API) RP 10B-2 (24). This study not only leverages the waste byproduct fly ash for constructive use but also capitalizes on the exceptional strength and chemical stability of graphene oxide, paving the way for advanced construction materials that are both eco-friendly and structurally superior.
2. Materials and methods
2.1. Materials
Fly ash from Janamanjung, Perak, Malaysia power plant is utilized as the main precursor for the study. The sample underwent an X-ray Fluorescence (XRF) test following American Society Testing Materials (ASTM) C618-19 (25) to obtain the chemical compound comprised of silicon dioxide, aluminum oxide, iron oxide, sulfur trioxide and calcium oxide. The comparison between the sample, Class C and Class F was presented in . Based on the results as demonstrated in , the fly ash utilized for the study is categorized as Class F since the calcium oxide is less than 18%.
Table 1. Chemical requirement for fly ash Class C and F as per ASTM C618-19 (25).
An alkaline activator comprising sodium hydroxide and sodium silicate was employed in this study, with a ratio varying from 0.2 to 2.0. The sodium silicate solution consisted of 51–54% concentration in water. 50 wt.% (12.5 Molar) sodium hydroxide was purchased from Sigma Aldrich and diluted to 5 to 8 Molar using deionized water. Both sodium silicate and sodium hydroxide solution were utilized as alkaline activators for the study. GO was purchased from Sigma Aldrich with a specification of 2 milligrams per milliliter (mg/mL) dispersed in water, having the density of 0.981 g/mL. The GO has been used as per received without further purification.
2.2. Methods
The study consisted of three phases, Phase 1, 2 and 3. In Phase 1, the aim was to determine the optimal compressive strength by varying the alkaline activator ratios ranging from 0.2 to 2.0, using a 5 M sodium hydroxide solution. Moving on to Phase 2, the focus was on identifying the GO concentration that yielded the highest compressive strength, with the GO concentration ranging from 0.2% to 2.0% by weight of the formulation. Finally, in Phase 3, the optimal formulation identified in Phase 2 was assessed through a standard in accordance with API RP 10B-2 for functional testing, including rheology, thickening time, and fluid loss. Design of Experiment (DOE) by Design Expert (State-Ease Inc, USA) version 13 was employed to develop a total of 13 geopolymer well cement formulations for Phase 1 and Phase 2. The setting for Phase 1 was two factors: sodium hydroxide molarity (A), ratio of sodium hydroxide to sodium silicate (B), to optimize the compressive strength (response). Meanwhile the setting for Phase 2 was with two factors: sodium hydroxide molarity (A), graphene concentration %bwof (B), to optimize the compressive strength (response). Phase 1 was achieved by modifying the sodium hydroxide molarity from 5 to 8 M and the alkaline activator ratio from 0.2 to 2.0, as outlined in .
Table 2. Test matrices determine optimal sodium hydroxide molarity and sodium hydroxide to sodium silicate ratio.
2.2.1. Geopolymer cement mixing, curing and compressive strength test
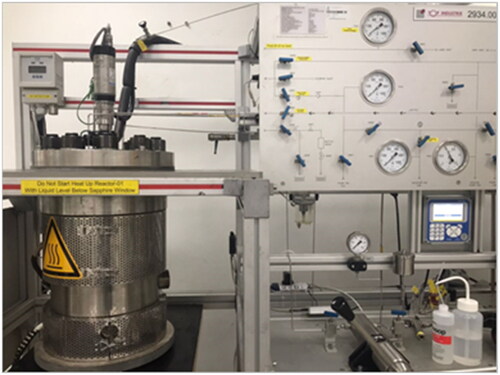
Geopolymer cements were prepared by mixing them in a mixer set at a constant speed, following the guidelines specified in the American Petroleum Institute Recommended Practice (API RP) 10B-2 (24). Subsequently, the resulting cement slurry was introduced into a 2-in x 2-in x 2-in cube for further processing. The curing process took place within a pressure-temperature chamber, adhering to the guidelines outlined in API RP 10B-2, as illustrated in . The curing conditions entailed a pressure of 3,000 psi and a temperature of 90 °C, maintained for a duration of 24 hours. To evaluate the compressive strength, a dedicated API Compressive Strength Tester was employed to conduct the test on the cement cube.
Figure 1. Pressurized curing chamber.
2.2.2. Rheology, thickening time, and fluid loss
Following the determination of optimal compressive strength in Phase 2, Phase 3 of the study involved comprehensive testing of the functional aspects of the cement. This included conducting a rheology test, a thickening time test and a fluid loss test following the guidelines in accordance with API RP 10B-2 (24). The rheology test aimed to observe the flow characteristics of the cement slurry during the mixing and pumping processes. The rheological properties play a crucial role in cement coverage, mud displacement efficiency, estimation of friction pressure, calculation of equivalent circulating density, prevention of losses and the hydraulic horsepower requirement during cement pumping. Simultaneously, the thickening time test was conducted to ascertain the setting time of the cement under controlled temperature and pressure ramps, simulating conditions relevant to a specific well depth. Consistency measurements were taken until the cement achieved a value of 100 Bearden Consistency (Bc), which indicates the time required for the cement to set. Additionally, the fluid loss test was performed to evaluate the filtration of the cement under simulated temperature and differential pressure conditions. Rheology, thickening time, and fluid loss were assessed using a Fann Viscometer Model 35 A, OFITE Fluid Loss Tester and Chandler Single Cell HPHT Consistometer Model 8340, respectively, in accordance with API RP 10B-2 (24).
3. Results and discussions
3.1. Phase 1: Determination of optimal sodium hydroxide molarity and alkaline activator ratio
The compressive strength values for each formulation in phase one are presented in , where the range of minimum and maximum compressive strength is exhibited by Formulations 8 and 9. Formulation 8, consisting of a sodium hydroxide molarity of 5 M and an alkaline activator ratio of 2, achieved compressive strengths of 3,663 psi and 1,304 psi, respectively. On the other hand, the formulation with the lowest compressive strength featured an 8.6 sodium hydroxide molarity and an alkaline activator ratio of 1.25. depicts the compressive strength response, which was inputted into the Design Expert software to generate a 2D contour graph displaying the compressive strength trend across alkaline activator ratios ranging from 0.2 to 2.0 and sodium hydroxide molarities ranging from 5 to 8 M.
Figure 2. Result of Compressive Strength Test of Sodium hydroxide Molarity and Ratio of SH/SS from the formulation by using Design Expert.
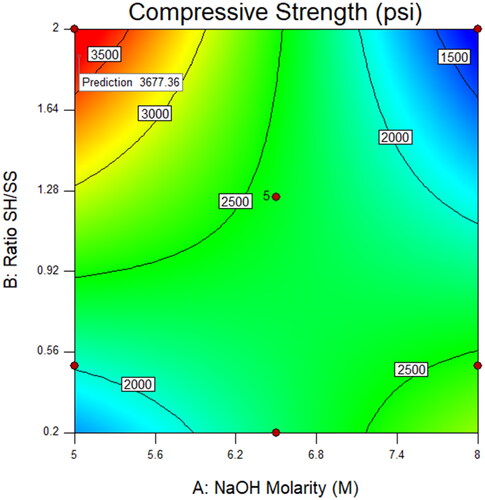
Figure 3. 2D contour represents the compressive strength results of GO concentration and sodium hydroxide molarity.
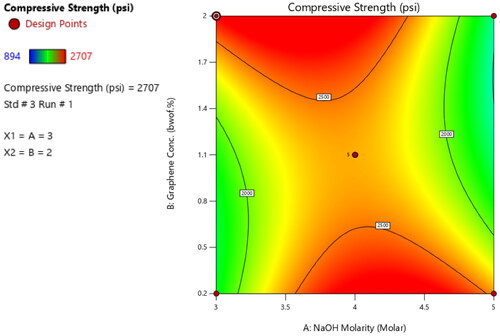
Table 3. Compressive strength result for Phase 1.
In , the highest compressive strength (psi) is observed within the range of 5 to 5.8 M sodium hydroxide, with an alkaline activator ratio of 1.7 to 2, represented by the red area with the compressive strength ranges between 3,500 psi and 3,677 psi. The second highest strength values, ranging from 2,750 to 3,350 psi, with a sodium hydroxide molarity between 5.5 to 6 M and an alkaline activator ratio of 1.25 to 1.6. Besides, the sodium hydroxide molarities from 5.9 to 8 M, coupled with alkaline activator ratios between 0.5 and 2.0 demonstrates compressive strength between 2000 and 3000 psi. On the other hand, the lowest sodium hydroxide molarity of 5 to 5.9 M and the lowest ratio of alkaline activator between 0.2 and 0.5, exhibits compressive strengths of less than 2000 psi. As the sodium hydroxide molarity increases from 7.2 to 8 M, with a maximum range of the alkaline activator ratio between 1.2 and 2.0, the compressive strength decreases from 2,000 to 1,503 psi.
Present findings contradict with the previous study conducted by Joshi and Joshi and Kadu (Citation2012) and Srinivasan and Sivakumar (Citation2013), which suggested that a low ratio of alkaline activator contributes to higher compressive strength. The disparity could potentially be attributed to the lower molarity of sodium hydroxide employed in the present study, as compared to the molarity used in the studies by Joshi and Kadu (Citation2012) and Srinivasan and Sivakumar (Citation2013). Besides, present results demonstrate that the high compressive strength can be achieved at lower molarity of sodium hydroxide by adjusting the alkaline activator ratio. The findings is contradicting with the previous study that demonstrate the highest strength can be achieved at 12 M of sodium hydroxide (Srinivasan & Sivakumar, Citation2013; Rajesh et al., Citation2014). According to , at the sodium hydroxide molarity of 4.4 M, compressive strength of 3,336 psi can be achieved. Additionally, it is worth noting that formulations with a molarity of 6 M and above exhibit a tendency to gel during mixing, indicating the need to decrease the molarity of sodium hydroxide in these cases as well. The subsequent phase of the study will involve simulations using a lower molarity of sodium hydroxide to mitigate the potential adverse effects of using a highly concentrated solution.
3.2. Phase 2: Determination of optimal GO concentration
In Phase 2, the same software is utilized to adjust the sodium hydroxide molarity within the range of 3 to 5 M, as well as the GO concentration ranging from 0.2 to 2.0% bwof (). In order to mitigate the potential toxic effects of sodium hydroxide at high concentrations, a lower molarity is selected compared to the previous section. The software employs central composite design (CCD) to simulate the variables, resulting in the generation of 13 formulations. The CCD approach allows for the simulation of values that exceed the specified range. Formulations 4 and 12 exhibit sodium hydroxide molarities of 2.6 and 5.4 M respectively, while Formulations 5 and 9 contain GO concentrations of 2.4 and 0% bwof respectively. The instances enable the observation of response trends when the factors extend beyond the designated range.
Table 4. Test matrices to determine optimal GO concentration.
The compressive strength test results for 13 different formulations are presented in . A simulated model was utilized, and the quadratic model was identified as the optimal choice within the given range of responses. The model demonstrated an R2 value of 0.6053, with a p-value that was deemed insignificant, a significant residual error, and a standard deviation of 495.88. To refine the model, two outlier data points (Formulations 5 and 9) were identified through a residual vs. predicted chart and subsequently excluded. These outliers were disregarded based on their internally studentized residuals error being above 3. The refined model showed improvements in R2 and standard deviation, with values of 0.9712 and 143.95, respectively. Moreover, the refined model exhibited significance, with a p-value below 0.05, and the residual error was considered insignificant. and depict the relationship between sodium hydroxide and GO concentration in terms of compressive strength presented in 2D and 3D surface plots. Both figures indicate that high compressive strength can be achieved with GO concentrations ranging from 1.7 to 2.0% bwof and sodium hydroxide molarities between 3 and 4.3 M, as shown in the upper left side of . Additionally, reveals that greater compressive strength can be obtained when using sodium hydroxide molarities between 3.5 and 5 M and GO concentrations ranging from 0.2 to 0.6% bwof.
Figure 4. 3D surface contour represents the variation of GO concentration and sodium hydroxide molarity to compressive strength.
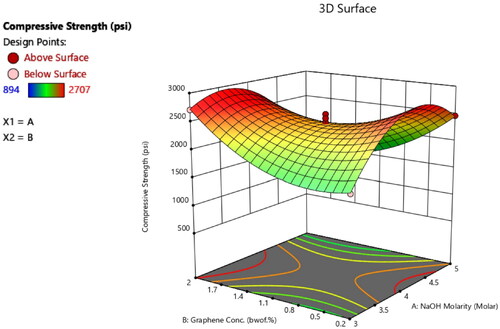
Table 5. Compressive strength result for Phase 2.
The result demonstrates that the optimal concentration of GO for achieving high compressive strength in geopolymer cement is influenced by the molarity of sodium hydroxide. When the molarity of sodium hydroxide is high, a small amount of graphene concentration is sufficient to yield a high compressive strength. However, when the molarity of sodium hydroxide is low, a higher concentration of graphene is needed. Furthermore, the molarity of sodium hydroxide plays a role in the solubility of fly ash in alkaline solution and the formation of 3D geopolymer networks, both of which contribute to strength development. The addition of GO act as a strength enhancer and filler to denser cement microstructure mortar and less pore and generates flower-like crystal (Gao et al., Citation2021; Gholampour & Ozbakkaloglu, Citation2022) that contribute to high compressive strength (Gong et al., Citation2014; Kaur et al., Citation2020; Somasri and Kumar, Citation2021; Lv et al., Citation2013; Pan et al., Citation2015).
Furthermore, Formulation 9 with 4 M of sodium hydroxide and 0% bwof of GO in exhibited the lowest compressive strength. The findings are in agreement with previous studies (Gong et al., Citation2014; Mohotti et al., Citation2022; Li et al., Citation2017; Pan et al., Citation2015), demonstrating that the addition of GO to geopolymer cement can enhance its compressive strength. Considering the higher cost of GO compared to sodium hydroxide, it is recommended to proceed with higher molarity of sodium hydroxide which will utilize lower concentration of GO.
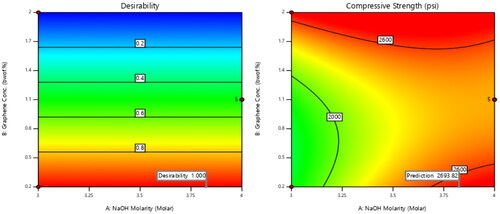
To ensure the accuracy and reliability of the model, validation was conducted prior to functional testing. Experimental tests were performed using an external formulation and the resulting compressive strength was compared against the predicted values. The analysis indicates that a compressive strength of 2,694 psi can be achieved with a sodium hydroxide molarity of 3.825 M and GO concentration of 0.2% bwof, with the desirability of 1 (as depicted in ).
Figure 5. Desirability and compressive strength chart to find the optimum formulation.
To verify the model’s accuracy, an experimental compressive strength test was conducted on a cured geopolymer cement formulation with a molarity of 3.825 M and a 0.2%bwof of GO. The test was performed at 3,000 psi and 90 °C. The results of the test revealed a compressive strength of 2,747 psi, falling within the range of the software’s minimum and maximum predicted values, as shown in .
Table 6. Prediction of compressive strength at optimal sodium hydroxide molarity and graphene concentration from Design Expert.
3.3. Phase 3: the adaptability of the optimum formulation with oilwell cement functional tests
According to the results of the previous section, the formulation containing 3.825 M of sodium hydroxide and 0.2% bwof of GO was the most effective. The optimal design, Formulation OP 1, is the foundation for the functional tests. The formulation will be compared with a reference design of 4 M of sodium hydroxide and 0%.bwof GO. The reference design is used from (Formulation 9), as it is the sole formulation with a compressive strength of 1145 psi and 0%.bwof for GO.
3.3.1. Cement rheology
To simulate surface conditions, the rheological analysis of the cement was conducted under ambient air conditions, while elevated temperatures were employed to mimic wellbore conditions. presents the rheological properties of the reference design at both atmospheric conditions and 60 °C, while illustrates the rheology characteristics of Formulation OP under the same atmospheric conditions and 60 °C. The bottom hole circulating temperature for the cement slurry was determined to be 60 °C.
Table 7. Rheology of the reference design at surface temperature and 60 °C.
Table 8. Rheology of the optimum design (Formulation OP 1) at surface temperature and 60 °C.
The results indicate that the ratio of 1 suggests the cement slurry is a stable and time-independent fluid at the average test temperature. Moreover, there is negligible disparity between the optimal and reference designs in terms of the ramp-up to ramp-down reading ratio. The encouraging rheological findings align with recent studies that observed a decrease in plastic viscosity and an increase in yield points for drilling fluids incorporating GO (Ikram et al., Citation2022).
3.3.2. Fluid loss
To assess the effectiveness of GO in reducing the volume of filtrate from cement slurry, a fluid loss test was conducted at 60 °C and 1,000 psi differential pressure. The results, detailing the fluid loss measurements for both the reference design and the optimal design, are presented in . It was observed that the filtrate volume exceeded the required governance standard of 50 milliliters. However, the optimal design, which incorporated 0.2% bwof of GO demonstrated a significantly lower filtrate volume of 22.9% compared to the reference design, consistent with previous studies (Ikram et al., Citation2022; Kosynkin et al., Citation2012; Rafati et al., Citation2018). It is important to note that neither the reference design nor the optimal design included a fluid loss additive, which is typically employed in well cementing applications. The addition of both a fluid loss additive and GO have the potential to decrease the filtrate volume for both the reference and optimal designs, aligning them with the operating standard requirement.
Table 9. Filtrate volume of the reference and optimum design at 60 °C.
3.3.3. Thickening time
The outcomes of thickening time tests conducted at 90 °C and 3000 psi, aiming to replicate wellbore conditions for both the reference and optimal designs, are presented in . These tests measure the thickening time at 40, 70, and 100 Bc which correlates with the torque needed to deflect the consistometer’s potentiometer. A reading of 40 Bc indicates that the cement slurry remains pumpable, while 70 Bc suggests the beginning of cement gelation. On the other hand, a reading of 100 Bc signifies that the cement slurry has reached the desired depth. The inclusion of GO in the geopolymer cement slurry acts as a retarder, effectively delaying cement gelation. The delay allows the cement to be pushed to greater depths that necessitate a slightly longer setting time. While enhancing porosity and reducing permeability, which contributes to increased compressive strength, GO indirectly ensures that the geopolymer well cement achieves adequate thickening time.
Table 10. Thickening time for reference and optimum designs at 90 °C and 3,000 psi.
4. Conclusion
The present study concludes that GO exhibits positive results in the following areas:
Geopolymer cement, with sodium hydroxide molarity ranging from 5 to 8 M and sodium hydroxide to sodium silicate ratio between 0.2 to 2.0, exhibited compressive strengths ranging from 1,304 to 3,663 psi.
The highest compressive strength was achieved with a formulation containing 5 M sodium hydroxide and an alkaline activator ratio of 2. Conversely, the lowest compressive strength of 1,304 psi was observed at a high sodium hydroxide molarity of 8.6 M and an alkaline activator ratio of 1.25.
Sodium hydroxide molarities of 6 M and above exhibited gelation issues during mixing.
Lower sodium hydroxide molarity of 4.4 M, with an alkaline activator ratio of 1.25, resulted in a high compressive strength of 3,336 psi.
The optimal concentration of GO in geopolymer cement depends on the molarity of sodium hydroxide to achieve high compressive strength.
High molarity of sodium hydroxide requires only a small concentration of graphene to achieve high compressive strength, while low molarity of sodium hydroxide necessitates a higher concentration of graphene.
Adding GO to geopolymer cement increased its compressive strength compared to formulations without GO, consistent with previous studies.
The optimized formulation, Formulation OP 1 consists of 3.825 M NaOH and 0.2% bwof GO was obtained from the CCD approach resulting in compressive strength test of 2747 psi.
Functional tests showed that the addition of GO did not significantly affect the rheology measurement of geopolymer cement. All formulations exhibited non-settling and time-independent fluid behaviours at the average test temperature.
Geopolymer cement samples with a graphene concentration of 0.2%. bwof exhibited a lower filtrate volume of 22.9% compared to the reference design without GO.
The inclusion of GO in geopolymer cement slurry acted as a retarder, prolonging the gelation time of the cement. This allowed the cement to be pumped at greater depths, which require slightly longer setting times.
Disclosure statement
No potential conflict of interest was reported by the author(s).
Additional information
Funding
Notes on contributors
Mohd Firdaus Habarudin
Mohd Firdaus Habarudin is currently working as a senior technician at PETRONAS Research Sdn. Bhd., Selangor. He is currently pursuing master's degree in Civil Engineering at Universiti Teknologi PETRONAS, Perak. His interest includes green technology, petroleum products, and circular economy.
Nasir Shafiq
Professor Nasir Shafiq is currently working as a Professor in the Civil Engineering Department at Universiti Teknologi PETRONAS, Perak. His specialties are high performance concrete, structural retrofitting and repair, FE modeling, building information modeling (BIM) and low carbon technologies.
Nurul Nazmin Zulkarnain
Dr. Nurul Nazmin Zulkarnain works as a researcher at PETRONAS Research Sdn. Bhd. She obtained a PhD and Bachelor's degree in Petroleum Engineering from Universiti Teknologi PETRONAS (UTP), Perak, Malaysia. Her interests encompass green technology, analytical chemistry, and well engineering.
Muhammad Aslam Md Yusof
Dr. Muhammad Aslam Md Yusof obtained a PhD in Petroleum Engineering from Universiti Teknologi PETRONAS (UTP), Perak, Malaysia and MEngSc in Petroleum Engineering from University of New South Wales, Australia. He is currently working as a lecturer/consultant in the Department of Petroleum Engineering at UTP. He has about more than 12 years of experience in industry and academics. Currently, a member of the Centre of Research in Enhanced Oil recovery (COREOR), Institute of Hydrocarbon Recovery, UTP which effectively provides consultancy, professional training and focus research on formation damage, carbon sequestration and drilling fluid.
Ahmad Amirhilmi A Razak
Ahmad Amirhilmi A Razak holds a bachelor's degree in Chemical Engineering and a master's degree in Petroleum Engineering. He is a senior researcher at PETRONAS specializing in Reservoir Technology. His work focuses on advancing sustainable solutions in the energy industry, particularly in Enhanced Oil Recovery (EOR) and Carbon Capture, Utilization, and Storage (CCUS).
Yon Azwa Sazali
Yon Azwa Sazali is currently a manager for technology program at PETRONAS Research Sdn. Bhd., Selangor. She obtained her master's degree in chemistry from Universiti Malaya. Her area of interest includes but is not limited to carbon capture, utilizing, and storage (CCUS), circular economy, and fluid technology solution.
Siti Humairah A Rahman
Dr. Siti Humairah Abd Rahman is currently working in management position at PETRONAS' Research entity under the Carbon Capture, Utilization, and Storage (CCUS) Department. The author has completed PhD from Universiti Teknologi PETRONAS (UTP) in Petroleum Engineering, majoring in Well Cementing. She did her first degree in Biochemical Engineering and obtained her Master's degree in Chemical Engineering. Throughout her 20 years of experience in the Oil and Gas industry, she cultivated a diverse range of experience from new technology development, scale up, consultation until commercialization of the technology, involved in forging mutually beneficial collaboration and strategic partnership alliance, negotiation and maximizing profitability from technology sales to the organization. Her area of interest includes but is not limited to commercialization, CCUS and circular economy.
Latief Riyanto
Latief Riyanto is currently working as a Principal Production Technologist at PETRONAS Research Sdn. Bhd., Selangor. His interest includes dual gas lift, remedial sand control, water shut off, flow assurance, well transient multi-phase simulation, hydraulic fracturing, sandstone acid stimulation, and low carbon footprint technologies.
Afif Izwan Abd Hamid
Afif Izwan Abd Hamid is currently Research Scientist at Petroleum Engineering Department, Universiti Teknologi PETRONAS (UTP), Malaysia. He obtained his Bachelor's degree in Petroleum Engineering, majoring in Drilling Engineering in 2015. He also earned his MSc in Petroleum Engineering at the same institution in 2018. His areas of interests are oil well cementing, enhanced oil recovery, production enhancement and circular economy.
References
- Abdullah, M. M. A., Kamaruddin, H., Abdulkareem, O. A., Ghazali, C. M. R., Rafiza, A. R., & Norazian, M. N. (2012). Optimization of alkaline activator/fly ash ratio on the compressive strength of manufacturing fly ash-based geopolymer. Applied Mechanics and Materials, 110–116, 734–739. https://doi.org/10.4028/www.scientific.net/AMM.110-116.734
- API RP 10B-2: Recommended practice for testing well cements (2nd ed.). Washington, USA: American Petroleum Institute (API).
- ASTM C618–19: Standard specification for coal fly ash and raw or calcined natural pozzolan for use in concrete. West Conshohocken, PA, USA: ASTM International.
- Aziz, M., Hamza, M., Rasool, A. M., Ali, U., Ahmed, T., Kharal, Z. N., Khan, A. H., & Rehman, Z. (2023). Use of graphene oxide nanomaterial to improve mechanical properties of cement-treated silty soil. Arabian Journal for Science and Engineering, 48(4), 5603–5618. https://doi.org/10.1007/s13369-022-07530-w
- Gao, Y., Jing, H., Fu, G., Zhao, Z., & Shi, X. (2021). Studies on combined effects of graphene oxide-fly ash hybrid on the workability, mechanical performance and pore structures of cementitious grouting under high W/C ratio. Construction and Building Materials, 281, 122578. https://doi.org/10.1016/j.conbuildmat.2021.122578
- Gholampour, A., & Ozbakkaloglu, T. (2022). Waste-based mortars containing glass powder, GGBS, lead smelter slag and foundry sand reinforced with graphene oxide. Magazine of Concrete Research, 74(23), 1189–1203. https://doi.org/10.1680/jmacr.21.00185
- Gong, K., Pan, Z., Korayem, A. H., Qiu, L., Li, D., Collins, F., Wang, C. M., & Duan, W. H. (2014). Reinforcing effects of graphene oxide on portland cement paste. Journal of Materials in Civil Engineering, 27(2), A4013010. https://doi.org/10.1061/(ASCE)MT.1943-5533.0001125
- Ikram, R., Jan, B. M., Ahmad, W., Sidek, A., Khan, M., & Kenanakis, G. (2022). Rheological investigation of welding waste-derived graphene oxide in water-based drilling fluids. Materials, 15(22), 8266. https://doi.org/10.3390/ma15228266
- Joshi, S., & Kadu, M. (2012). Role of alkaline activator in development of eco-friendly fly ash based geo polymer concrete. International Journal of Environmental Science and Development, 3(5), 417–421. https://doi.org/10.7763/IJESD.2012.V3.258
- Kanesan, D., Irawan, S., Suppiah, R. R., & Kunaisekaran, T. A. (2018). Formulation of geopolymer cement using Class F fly ash for oil well cementing application. International Journal of Applied Engineering Research, 13(6), 3598–3604.
- Kaur, R., Kothiyal, N., & Arora, H. (2020). Studies on combined effect of superplasticizer modified graphene oxide and carbon nanotubes on the physico-mechanical strength and electrical resistivity of fly ash blended cement mortar. Journal of Building Engineering, 30, 101304. https://doi.org/10.1016/j.jobe.2020.101304
- Khed, V. C., Pesaralanka, V., Adamu, M., Ibrahim, Y. E., Azab, M., Reddy, M. A. K., Hakamy, A., & Deifalla, A. F. (2022). Optimization of graphene oxide incorporated in fly ash-based self-compacting concrete. Buildings, 12(11), 2002. https://doi.org/10.3390/buildings12112002
- Kosynkin, D. V., Ceriotti, G., Wilson, K. C., Lomeda, J. R., Scorsone, J. T., Patel, A. D., Friedheim, J. E., & Tour, J. M. (2012). Graphene oxide as a high-performance fluid-loss-control additive in water-based drilling fluids. ACS Applied Materials & Interfaces, 4(1), 222–227. https://doi.org/10.1021/am2012799
- Li, W., Li, X., Chen Su, J., Long, G., Liu Yan, M., & Duan Wen, H. (2017). Effects of nanoalumina and graphene oxide on early-age hydration and mechanical properties of cement paste. Journal of Materials in Civil Engineering, 29(9), 04017087. https://doi.org/10.1061/(ASCE)MT.1943-5533.000192
- Lv, S., Ma, Y., Qiu, C., Sun, T., Liu, J., & Zhou, Q. (2013). Effect of graphene oxide nanosheets of microstructure and mechanical properties of cement composites. Construction and Building Materials, 49, 121–127. https://doi.org/10.1016/j.conbuildmat.2013.08.022
- Manikanta, D., Ravella, D. P., Sri Rama Chand, M., & Janardhan Yadav, M. (2021). Mechanical and durability characteristics of high performance self-compacting concrete containing flyash, silica fume and graphene oxide. Materials Today, 43(2), 2361–2367. https://doi.org/10.1016/j.matpr.2021.01.684
- Massion, C., MercyAchang, Bour, D., & Radonjic, M. (2020). Graphene-enhanced wellbore cement: Improving cement performance in the construction of geothermal wellbores. GRC Transactions, 44, 67–81.
- Mohotti, D.; Mendis, P.; Wijesooriya, K.; Fonseka, I.; Weerasinghe, D.; Lee, C. Abrasion and strength of high percentage graphene oxide (go) incorporated concrete. Electronic Journal of Structural Engineering. 2022, 22(01), 37–43, . https://doi.org/10.56748/ejse.2233001
- Palomo, A., Grutzeck, M., & Blanco, M. (1999). Alkali-activated fly ashes: A cement for the future. Cement and Concrete Research, 29(8), 1323–1329. https://doi.org/10.1016/S0008-8846(98)00243-9
- Pan, Z., He, L., Qiu, L., Korayem, A. H., Li, G., Zhu, J. W., Collins, F., Li, D., Duan, W. H., & Wang, M. C. (2015). Mechanical properties and microstructure of a graphene oxide–cement composite. Cement and Concrete Composites, 58, 140–147. https://doi.org/10.1016/j.cemconcomp.2015.02.001
- Petermann, J. C., Saeed, A., & Hammons, M. I. (2010). Alkali-activated geopolymers: A literature review. Panama City, FL, USA: Applied Research Associates Inc.
- Rafati, R., Smith, S. R., Haddad, A. S., Novara, R., & Hamidi, H. (2018). Effect of nanoparticles on the modifications of drilling fluids properties: A review of recent advances. Journal of Petroleum Science and Engineering, 161, 61–76. https://doi.org/10.1016/j.petrol.2017.11.067
- Rajesh, A. M., Joe, M. A., & Mammen, R. (2014). Study of the strength geopolymer concrete with alkaline solution of varying molarity. IOSR Journal of Engineering, 4(6), 2250–3021.
- Somasri, M., & Kumar, B. N. (2021). Influence of graphene oxide as advanced nanomaterial on fly ash and silica fume-based high-strength self-compacting concrete. In: Biswas, S., Metya, S., Kumar, S., Samui, P. (Eds.), Advances in sustainable construction materials. Lecture notes in civil engineering (Vol. 124). Singapore: Springer. https://doi.org/10.1007/978-981-33-4590-4_59
- Srinivasan, K., & Sivakumar, A. (2013). Geopolymer binders: A need for future concrete construction. International Scholarly Research Notices, 2013, 1–8. https://doi.org/10.1155/2013/509185
- Zulkarnain, N. N., Farhan, S. A., Sazali, Y. A., Shafiq, N., Abd Rahman, S. H., Abd Hamid, A. I., & Habarudin, M. F. (2021). Reducing the waiting-on-cement time of geopolymer well cement using calcium chloride (CaCl2) as the accelerator: Analysis of the compressive strength and acoustic impedance for well logging. Sustainability, 13(11), 6128. https://doi.org/10.3390/su13116128