
 ?Mathematical formulae have been encoded as MathML and are displayed in this HTML version using MathJax in order to improve their display. Uncheck the box to turn MathJax off. This feature requires Javascript. Click on a formula to zoom.
Abstract
Evaluating and comparing two different irrigation scheduling methods like soil moisture (SM) and evapotranspiration (ET)-based irrigation scheduling methods were assessed scientifically to maximize tomato yield, especially in areas where restricted irrigation facilities are available. The experimental design was arranged in a Randomized Complete Block Design (RCBD) with 100%, 75%, and 50% water requirements with three replications. The water was applied to furrows using Randomized Block Design (RBC) flume with an inflow rate of 1.62 l/s. The total amount of water applied in SM- and ET-based methods were 229.1 mm and 280 mm, respectively. The collected data were analyzed using ANOVA (statistical software) at 5% significance level. Values on agronomic characteristics, yield attributes, and yield were determined for those two methods. T1–T6 are the total treatments used in this research. Out of which, T1, T2, and T3 are taken as SM-based represented for 100%, 75%, and 50% of requirements and T4, T5, and T6 as ET-based represented for the same percentage of requirements. The results did not illustrate a huge difference in yield potential. The highest net benefit on yield was obtained at T2 (SM-based), whereas the lowest in T6 (ET-based). It was also observed that SM-based method saved around 18.2% of irrigation water compared to ET-based approach. Therefore, to cultivate high water demanding crops such as tomato in water scarce areas, SM-based irrigation scheduling method is comparatively better than ET-based as far as yield is concerned.
1. Introduction
Impeccable use of scientifically tested irrigation system reduces the food production crisis irrespective of any climatic change intervention. The methods in particular are too crucial for agricultural production in areas where either the water resources are scarce or irrigation facilities are limited (Gu et al., Citation2017). Agriculture is the backbone of the Ethiopian economy. The rural community is completely dependent on farming for their sustainability. In water scarce areas of the country, cultivation of high water demanding crops without irrigation is impossible. Limited irrigation facilities and non-perennial a supply of water through it in the country are practically inadequate (Awulachew & Ayana, Citation2011). The primary issue occurring in the irrigation schemes is improper irrigation water application, particularly over or under irrigations of crop fields that result in lowest water use efficiency (WUE). Test of relative irrigation supply (the ratio of irrigation supply to crop water demand) at scheme level for 10 irrigation schemes in Ethiopia ranged between 0.5 (insufficient) and 5.0 (excesses) for the period of January–May and between 0.8 (insufficient) and 7.0 (excesses) for the period of June–December (Agide et al., Citation2016). Non-scheduled and inconsistent water application regardless of crop type (Daniel et al., Citation2020) has also been observed in many cases. Currently, this has become a major worry among the scientists and scholars for enhancement of WUE (Daniel et al., Citation2020; Derib et al., Citation2011; Yohannes et al., Citation2019). In order to bring an effective agricultural water management and increase agricultural productivity, farmers, irrigation experts, water resources managers, and decision makers suggested proper irrigation scheduling techniques (Daniel et al., Citation2020; SAI Platform, Citation2010).
Scientific irrigation scheduling methods are required to determine when, where, and how irrigation needs to be facilitated (O’Shaughnessy & Rush, Citation2014). Especially, there are two distinctive methods: one by directly monitoring SM using SM sensors and the other using weather data to account for soil-water by soil water balance approach (Sharma, Citation2019). Others classify the methods into three “scientific” irrigation scheduling methods: plant, soil, and climate based (O’Shaughnessy & Rush, Citation2014). Ali’s (Citation2010) classification is more explanatory than other classifications that put them in two main groups as Farmer and Advanced method. From these different classifications, soil- and climate-based methods are considered as “typical” methods as they represent SM and ET-based irrigation scheduling methods (Hanson et al., Citation2000; Sharma, Citation2019). In this study, these two commonly applicable typical methods are comparatively evaluated for their WUE.
The general approach for the ET-based method is maintaining balance of current available SM to the plant by tracking the ETc losses and the additions from irrigation and precipitation (Nouri et al., Citation2016). This method sometimes performed better with significantly less water for the same yield compared to some other irrigation systems (Bartlett et al., Citation2015; Migliaccio et al., Citation2016). The method normally uses climatological parameters to estimate ET for a “well watered” crop. If it is correctly applied, this scheduling practice will have conserving water and maintaining crop yield and quality (McCready & Dukes, Citation2011).
SM-based scheduling depends on soil water holding capacity between Field capacity (FC) and permanent wilting point (PWP). In this method, there are enormous options of tools to conduct irrigation scheduling, such as automatic irrigation controllers, neutron scattering, tension meters, capacitance sensors, electrical resistivity measurements, heat pulse sensors, watermark sensors, and fiber-optic-sensors (Hedley & Yule, Citation2009; Yadav et al., Citation2020). Comparatively, dielectric sensors like time domain reflectometry (TDR) require less field maintenance and have a greater potential for commercial adoption (Munoz-Carpena et al., Citation2005). During the research, volumetric water content was estimated by TDR, and the calibration was performed by gravimeter (Evett, Citation2008).
Under normal circumstances, either SM-based (Junwang et al., Citation2017; Ruixiu, Citation2018; Vellidis et al., Citation2016) or ET-based irrigation scheduling methods are adopted. However, the methods varied as per the data availability and performance based on non-scientific preconditions. The method that is more appropriate needs to be restricted to provide options to farmers for managing their irrigation systems according to their preferences and on-site conditions (Juan et al., Citation2009). Thus, technical knowledge, skills, and unbiased information about the performance of the methods are required to evaluate the extent of effect of the methods. In another way, comparing the effectiveness of the two irrigation scheduling methods for WUE to their climatic condition (Aguilar et al., Citation2015; Grabow et al., Citation2013; Juan et al., Citation2009; Miller et al., Citation2018; Sabine et al., Citation2016) needs to be well understood (BlonquistJr et al., Citation2006; CitationVarble and Chávez, Citation2011).
Past research studies are still unclear about the extent of saving of water between irrigation scheduling methods. The results vary from experiment to experiment and place to place for different attributes and a number of variables such as climate (geographic and seasonal), crop (type and condition), irrigation method, irrigation manager’s level of expertise, and soil type (N. Cooley et al., Citation2010). This indicates proper planning and effective execution of similar types of comparative works for variations. Therefore, it is necessary to carry out a comparative evaluation of the two methods in terms of WUE for crops to provide options that could help the users to manage their irrigated farms effectively under prevailing conditions in the area. The major objectives of the present study were to evaluate SM, ET-based irrigation scheduling methods’ effects, and respective WUE of crop and to evaluate SM and effects on deficit irrigated crop on ET-based irrigation scheduling methods.
In the study area, many researchers have used either SM or ET-based irrigation scheduling method. Unfortunately, none of them tried to evaluate and compare the effectiveness of the methods. The farmers must be provided with options to manage their irrigation scheduling according to their preferences and on-site condition (Juan et al., Citation2009). The growing interest of farmers is to cultivate high water demanding crops such as tomato, which is a big challenge due to water shortage. Appropriate irrigation scheduling method needs to be identifed to sort out the problem for the sustainability of the farmers. This study has been focused on identifying a better irrigation scheduling approach to recommend a healthy irrigated tomato crop under deficit irrigation, especially during dry seasons.
2. Materials and methods
2.1. Study area description
The experiment was conducted near Arba Minch city, southern Ethiopia (Figure ). It is located around 450 km away from Addis Ababa, the capital city of Ethiopia toward South West direction, geographically at 6º04”N latitude and 37º34” E longitude and at an altitude of 1200 m amsl. Two Rift Valley Lakes, Abaya and Chamo, enclose the study area in the east and southeast, respectively. The experiment was conducted during the period of May–September in 2022. Thirty year’s (1987–2018) historical rainfall and temperature data (Figure ) were analyzed to understand the past climatic behavior of the area to select the dry season for conducting this research.
Figure 1. Location map of the study area.
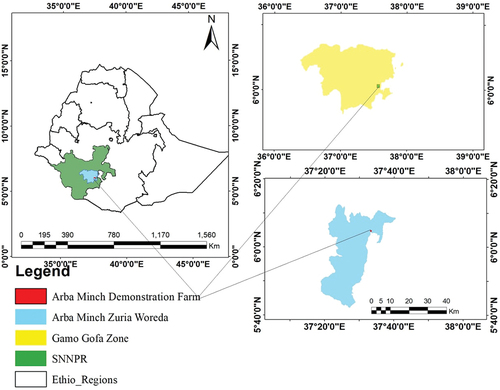
Figure 2. Climate data of the study area.
Meteorological station is a source to collect daily weather data such as temperature, rainfall, sunshine hours, wind speed, and humidity that are ET computation parameters for ET-based scheduling located in Arba Minch University.
According to the data from the meteorological station, the area is characterized by bimodal climatic conditions. The average annual rainfall of the area is 921.8 mm.
2.2. Pre-experimental activities
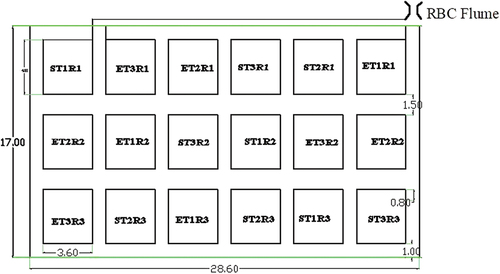
Five furrows per plot of 80 cm spacing, 20 cm deep, and 35 cm wide were provided. The furrow slope along each plot measured as the ratio of vertical distance (m) to horizontal distance (m) is about 0.2%. The plot size is 3.6 m wide and 4 m long with five furrows in each plot. The crop was planted at the side of ridge with 40 cm and 80 cm between plants and rows, respectively. The spacing between each plot and treatment block was 1 m and 1.5 m, respectively. The prepared land comprised of 18 plots each with 4 m × 3.6 m (14.4 m2) (Figure ). Total experimental field of length and width including work and block space was 28.6 m×17 m (0.048 ha). For establishment, seeds were sown in a nursery bed of 5 m long, 1 m wide, and 25 cm raised bed within 20 cm spaced line.
Figure 3. Layout of experimental field.
2.2.1. Soil sample collection and analysis
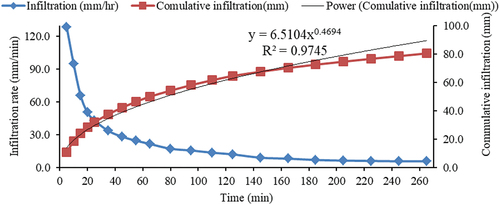
Laboratory analysis was conducted to determine the soil bulk density and soil texture from the depths of 0–20, 20–40, and 40–60 cm from nine representative locations. The texture was determined in the laboratory using Bouyoucos hydrometer method. Soil infiltration test was carried out using double ring infiltrometer with outer and inner diameters and height of 53 cm, 32 cm, and 25 cm, respectively, on bare field procedurally (Savva & Frenken, Citation2002) (Figures ).
Figure 4. Soil infiltration test carried out in the field.
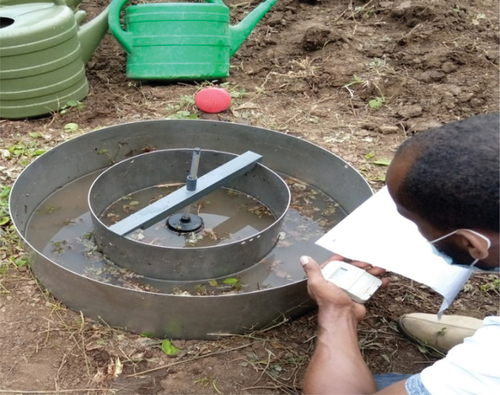
Figure 5. Infiltration test graph.
2.3. Treatments
Of the total treatments of T1, T2, T3, T4, T5, and T6, SM-based was represented by T1, T2, and T3 for 100%, 75%, and 50% of requirement and ET-based was represented by T4, T5, and T6 for 100%, 75%, and 50% of requirement, respectively. Comparative treatments from both sides are T1 = T4 = 100% requirement, T2 = T5 = 75% requirement, and T3 = T6 = 50% requirement. For both sides, six treatments were irrigated by three levels of application for total of 18 Randomized Complete Block Design (RCBD) plots (Table ).
Table 1. Treatments and levels of application
3. Irrigation scheduling methods
3.1. ET-based irrigation scheduling
FAO Penman-Monteith method was used to compute daily ETo from meteorological data of the area (Allen et al., Citation1998; Edamo et al., Citation2022; Ukumo et al., Citation2022). Since the specific crop coefficient was not done in the area, the Kc values used in this work were obtained from the findings of Melkasa research center, with similar agro-climatic conditions (Dirirsa et al., Citation2017). Crop ET is calculated as indicated by Subedi and Chávez (Citation2015) (EquationEquation 1(1)
(1) ).
ET-based irrigation scheduling is carried out by managing soil water balance estimation based on the water lost by ET, and its replacement through irrigation or effective rainfall. The balance was performed using Van (2004) for row crops (EquationEquation 2(2)
(2) ).
Where CSWC is current soil water content (today, mm), PSWC is previous soil water content (yesterday, mm), Pe is effective rainfall since yesterday (mm), Inet is net irrigation since yesterday (mm), and ETc is crop ET (mm/day).
The first step was to determine the amount of water in the soil (PSWC) at the start of the water budget. Usually, PSW Cat one day earlier from first irrigation is returned to FC. The net irrigation water requirement is determined using EquationEquation 3(3)
(3) (Bennett et al., Citation2014).
Where Inet = net irrigation requirement (mm), Pe = effective rainfall (mm), and ETc = crop ET (mm).
Meteorological data indicates that out of total 117.6 mm of rainfall recorded during the experimental season, 58.9 mm is effectively connected to the crop root zone. Assuming no input water except rainfall, the effective rainfall was determined by a comparison of the rainfall with the crop water used (ETc). If ETc of the crop for the day is greater than the rainfall of that day then Pe becomes equal to the rainfall. Otherwise, Pe equals to ETc.
3.2. SM-based scheduling
For SM-based irrigation scheduling, the amount of irrigation water applied was based on the moisture content at the time of sampling in the root zone. The calculation equations of this method are mentioned under Equations 4 and 5 (Haberle & Svoboda, Citation2015). Total available soil water was computed (EquationEquation 4(4)
(4) ).
Where TAW is total available soil water (mm), FC is Field capacity (%), PWP is permanent wilting point (%), and RD is effective root depth of the crop (mm). Readily available soil water was computed by EquationEquation 5.(5)
(5)
Where RAW= readily available water (mm), MAD = maximum allowable depletion (mm), and TAW= total available soil water (mm).
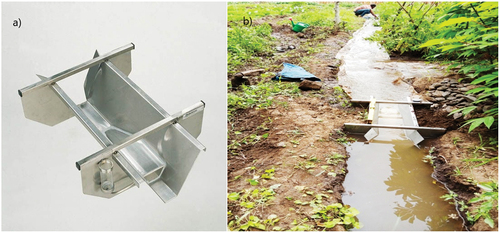
3.3. Discharge measurement (RBC flume)
Irrigation water is allowed to pass through submerged circular pipe and then to Replogle Bos-Clemmens (RBC) flume (Figure ).
Figure 6. RBC flume and b) discharge measurement.
Procedurally, the flow rate was determined by measuring the water level (SH1) in the flume. The sill-referenced water level (SH1) was converted to flow rate by using EquationEquation 6.(6)
(6) From the three alternatives of discharge measurement (Figure ),
Figure 7. The relationship between RBC flume discharge (l/sec) and head (mm).
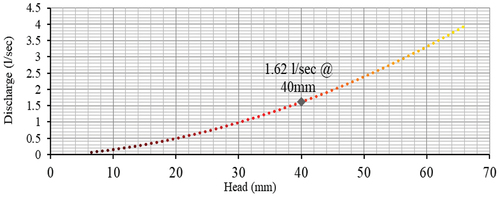
where Q is discharge (l/sec) and SH1 is sill-referenced water level (mm).
The flume was calibrated to a discharge of 1.62 l/sec for SH1 of 40.0 mm (Figure ).
The time (min) of water application to each furrow is calculated using EquationEquation 7(7)
(7) (Kifle, Citation2018) as follows:
where T is application time (min), GIR is gross depth of water applied (mm), L is furrow length in (m), W is furrow spacing in (m), and Q is flow rate (l/s).
3.4. Application efficiency (Ea)
Application efficiency was determined from the relationship between time of water recession (tr) in minute, distance of water advance (x) in meter, time of water advance (tx) in minute, time of opportunity (To) in minute, and the infiltration data of the soil. Having the depth of irrigation application, application efficiency (Ea) is determined by using EquationEquation 8.(8)
(8)
Where I is the average depth of infiltration stored in root zone, Dapp is the depth of application. The depth of irrigation application was determined using EquationEquation 9.(9)
(9)
Where Dapp is the depth of application (mm), Q is the discharge applied (m3/min), tco is the time of cut off (min), and A is the furrow area (m2).
3.5. Crop data collection and harvest
Agronomic and yield data were collected from five randomly selected and tagged plants during the growth stages. Agronomic parameters were determined to compare plant height (cm), number of branches, number of fruits per plant, and number of flowers per plant. Four harvests were performed from 8th to 29th September 2021. Yield attributes included fruit length (cm), fruit diameter (cm), and fruit weight (g). Total fruit yield comprises marketable yield (ton/ha) and non-marketable yield (ton/ha).
3.6. Water productivity
Crop water productivity was calculated by dividing harvested yield by kg per volume of water applied. The indicators are crop water use efficiency (CWUE), irrigation water use efficiency (IWUE), and field water use efficiency (FWUE). These indicators can be calculated using procedures as suggested by Michael (2003).
3.6.1. Crop water use efficiency
The CWUE is the yield harvested per ha-mm of total water used and determined using EquationEquation 10(10)
(10) (Micheal, Citation1997).
Where CWUE is IWUE (kg/m3), Y is total marketable tomato fruit yield (kg/ha), and ETc is crop ET (m3/ha).
3.6.2. Irrigation water use efficiency
The irrigation water efficiency is the ratio of crop yield to the amount of net irrigation (Zhang et al., Citation1998). It is calculated using EquationEquation 11(11)
(11) .
Where IWUE is the irrigation water use efficiency (kg/m3), Y is yield (kg/ha), and Inet net irrigation in (m3/ha).
3.6.3. Field water use efficiency
FWUE is the yield harvested per ha-mm of gross irrigated depth and determined by EquationEquation 12(12)
(12) (Zhang et al., Citation1998).
Where FWUE is the field water use efficiency (kg/m3), Y is yield in (kg/ha), and is gross irrigation in (m3/ha).
3.7. Data analysis
Significant difference among the measured parameters was analyzed by considering the above growth parameters to ANOVA (statistics trail 10) software after arranging and taking the average of the field data using Microsoft Excel. The mean square separation was done using the least significant difference adopting the normal procedures (Gomez & Gomez, Citation1984) for RCBD.
4. Result and discussion
The results of preliminary works such as soil properties are presented in Table . The effects of both irrigation scheduling methods on WUE and net benefit of the methods regarding water use is comparatively presented.
Table 2. Soil properties of the area
The physical properties of soil were determined by Boyouncus method, clay soil is dominant in the area (Table ).
The water ranges between FC and PWP available to the crop was 15.9% in average, which is within the acceptable range (Allen et al., Citation1998). The average hydrogen ion concentration in soil solution is represented by pH for the soil is 7.30 which appear to the neutral indicating suitability for crop production (Oshunsanya, Citation2019; Teklu, Citation2017). The electrical conductivity (EC) of the experimental site soil was 2.14 dS/m in average. Soils having EC less than 4dS/mas non-saline are suitable for the crop.
The basic infiltration rate at which the infiltration rate gets almost constant is 5.7 mm/hr. Sometimes, the infiltration rate for the soil is specified in a range of 1–5 mm/hr for the soil (Brouwer et al., Citation1988). However, Doorenbos and Pruitt (Citation1977) argued the range to be 1-15 mm/hr for clay-type soils, which is consistent to the above result.
4.1. Irrigation scheduling
The net irrigation requirement was determined and presented in Table .
Table 3. Irrigation schedules
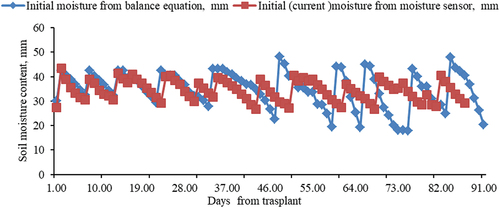
The balance method needs extra irrigation at the end of the season but moisture-based does not require so. Such conditions may indicate that sometimes the assumption-based balance may continue on its track of depletion regardless of actual SM. Figure presents a comparative analysis of SM variation in SM-and ET-based scheduling methods.
Figure 8. SM variations in scheduling methods.
The net irrigation water applied in SM- and ET-based are 229.1 mm and 280 mm, respectively, as shown in the Table . Net irrigation comparison for the methods is presented in Figure .
Figure 9. Net irrigation comparison for scheduling method.
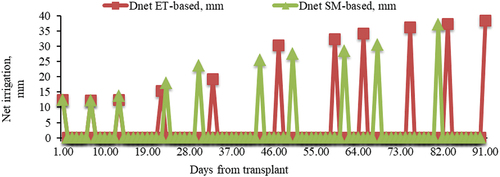
A total of 117.6 mm of rainfall was recorded during the experimental season on ET-based. From this, 58.9 mm of rainfall is effectively stored in the root zone. The effective rainfall on SM-based is estimated from the change in SM reading before and just after rainfall by moisture sensor. In this case, 37.7 mm of water was supplied to the root zone.
Results in Table indicate that SM-based saved 18.2% of water compared to the ET-based method. This indicates direct moisture monitoring could have a better result than the climate-based method (BlonquistJr et al., Citation2006) as 16% water was saved by time domain transmissometry (TDT) sensor-based method compared with ET-based irrigation recommended values. In addition, Miller et al. (Citation2018) reported 31% water saved under SM-based compared with ET-based in tomato-growing fields. In the same way, this SM-based method applied the least amount of irrigation water in results obtained from Smajstrla and Locascio (1990). Although the findings are indicating the advantage of SM-based, all findings including the present findings are different on quantity of saving. The variation between the findings can be due to several factors such as geographic and seasonal, crop type, soil type, irrigation method, irrigation manager’s level of expertise, application technologies, and climatic conditions (N. Cooley et al., Citation2010).
Table 4. Net requirement of irrigation water
4.2. Effects of irrigation scheduling methods on WUE
The crop water use, irrigation water use, and field water use for irrigation scheduling methods are presented in Table . In addition, the table compares the variation of the values for application levels.
Table 5. ANOVA for effects of irrigation scheduling methods on WUE
WUE values are significantly varied for irrigation scheduling methods and water application levels at P < 0.05. The values are higher for low water application. However, this may not be true under all conditions. Not only water applied but the yield obtained could also have effect on the efficiencies. In the same way, Table indicates the lowest WUE from full application but vice versa is not true.
The highest CWUE (18.5 kg/m3) is in the SM-based approach compared to the corresponding highest value (13.5 Kg/m3) in ET-based. This is directly linked to the amount of water applied to the methods. SM-based consumed less water than ET-based, and the ratio of yield to water in T2 is higher than the ratios in T1 and T3. That is why the value is highest for T2. The lowest CWUE in SM-based (15.4 kg/m3) is greater than the highest in ET-based (13.5 kg/m3). This can indicate the dominance of the SM-based approach over ET-based for CWUE. This result agrees with Luke et al.’s (Citation2018) report since SM-based irrigated plants have a greater WUE than the ET-based.
Table shows the highest IWUE at T2 in SM-based and the lowest at T4 in ET-based. T4 is the highest water consumed but with the lowest yield to net consumed water ratio indicating its non-appropriateness. T2 is reasonably fair for both applied water and yield. In the case of application level, the highest deficit level may increase IWUE but it has negative impact on crop yield. This result is in agreement with Luke et al. (Citation2018)’s report that revealed SM-based irrigated plants have the greatest irrigation water use efficiency than ET-based.
FWUE was presented in Table indicating 14.6 kg/m3and 11.8 kg/m3 for SM- and ET-based, respectively, as the highest value for 75% application level. All the WUE values in the above findings are higher in SM-based methods than ET-based, and the results are within a range suggested by Bisa et al. (Citation2018), who suggested WUE of tomato from 5.9 kg/m3 to 30.79 kg/m3 as acceptable.
Comparative studies by Varble and Chávez (Citation2011) and BlonquistJr et al. (Citation2006) also indicated that the SM-based method is more efficient than the ET-based on water saving. Results regarding application levels and WUE in this study are more or less agreed with the previous findings (Ayas, Citation2019; Fereres & Soriano, Citation2007; Luke et al., Citation2018; Marazky El, Citation2018). Despite significant WUE for the higher deficit, it can negatively affect the crop development process by lowering ET rate (Zheng et al., Citation2013). Determining the appropriate level of irrigation to balance crop yield and water use can be complex and depends on biophysical and economic factors (Payero et al., Citation2008). However, the dependence of crop development process on the rate of water use is real. Thus, WUE is needed to be balanced not to cause significant yield reduction. Regarding this work, T2 in SM-based irrigation scheduling method could possibly be more appropriate.
4.3. Effect of irrigation scheduling methods on yield performance
The total yields determined from the analysis are shown in Table , which indicate that the two methods have not shown considerable differences for irrigation scheduling methods at P < 0.05) (Table ).
Table 6. ANOVA for the effect of irrigation scheduling methods on yield performance
The average total yields obtained from the SM-based experimental field (39.2t/ha) is similar to ET-based (39t/ha). In a similar way, Jose (2016) compared checkbook and sensor-based treatments located on two zonal experiments as he named it zone A and B. Result at zone A shows little advantage to ET-based over sensor-based. However, at zone B, the sensor-based achieved marginal advantage. These variations on yield are in agreement with the present finding. The total average yield from both methods in the present study is nearly similar to the predicted average yield (about 40 ton/ha) for the selected determinate open pollinated Roma VF variety. The total yield was decreased toward higher deficit levels, which is in agreement with other findings.
5. Conclusion
The results of the study revealed that the net water applied to perform this experiment under SM-based and ET-based scheduling methods was 229.1 and 280.0 mm, respectively. The comparison of agronomic properties, yield attributes and yield, has not shown a significant difference for irrigation scheduling methods (P < 0.05) used in the area during the investigation period. The cross comparison on results of WUE has shown a clear advantage of SM-based over ET-based scheduling methods in every treatment. This is resulted from 18.2% water saved by the SM-based method during irrigation. On the other hand, the total average yield harvested in SM- and ET-based scheduling methods were 39.2 t/ha and 39 t/ha, respectively, which are nearly similar. Thus, for higher WUE, the SM-based irrigation scheduling method with 75% level of application (T2) is more appropriate and profitable combination for tomato producers in water scarce areas. In water scarce areas like Arba Minch, application of irrigation water management practices is very important to improve WUE. This issue is highly linked with the quantity and timing of irrigation practices that also depend on the use of appropriate irrigation scheduling methods in a given area, since the use of irrigation scheduling with appropriate scheduling methods can alleviate inefficient use of available water during the irrigation seasons. This field experiment was specifically conducted in the area to evaluate the SM- and ET-based irrigation scheduling methods under deficit irrigated tomato crop field based on CWUE, FWUE, and IWUE.
Disclosure statement
No potential conflict of interest was reported by the authors.
Additional information
Notes on contributors
Solomon Mathewos Boltana
Solomon Mathewos Boltana and Manuel Tejada Moral are working as Lecturers in Faculty of Water Resoures Engineering in Arba Minch University, Ethiopia.
Demelash Wondemeneh Bekele
Demelash Wondemeneh Bekele and Tigistu Yisihak Ukumo are employed as Assistant Professors in Faculty of Water Resoures Engineering in Arba Minch University, Ethiopia.
Tigistu Yisihak Ukumo
Demelash Wondemeneh Bekele and Tigistu Yisihak Ukumo are employed as Assistant Professors in Faculty of Water Resoures Engineering in Arba Minch University, Ethiopia.
References
- Agide, Z., Haileslassie, A., Sally, H., Erkossa, T., Schmitter, P., Langan, S., & Hoekstra, D. (2016). Analysis of water delivery performance of smallholder irrigation schemes in Ethiopia: Diversity and lessons across schemes, typologies and reaches. LIVES Working Paper 15. ILRI. https://hdl.handle.net/10568/73684
- Aguilar, J., Rogers, D., & Kisekka, I. (2015). Irrigation scheduling based on soil moisture sensors and evapotranspiration. Kansas Agricultural Experiment Station Research Reports, 1(5), 20. https://doi.org/10.4148/2378-5977.1087
- Ali, H. (2010). Fundamentals of irrigation and on-farm water management. Springer Science & Business Media, 1(Vol. 1). https://doi.org/10.1007/978-1-4419-6335-2
- Allen, R. G., Pereira, L. S., Raes, D., & Smith, M. (1998). Crop evapotranspiration-Guidelines for computing crop water requirements-FAO Irrigation and drainage paper 56. Fao Rome, 300(9), D05109.
- Awulachew, S. B., & Ayana, M. (2011). Performance of irrigation: An assessment at different scales in Ethiopia. Experimental Agriculture, 47(S1), 57–16. https://doi.org/10.1017/S0014479710000955
- Ayas, S. E. R. H. A. T. (2019). Water-yield relationships of deficit irrigated tomato (Lycopersicon lycopersicum L. VAR. HAZAR F1). Applied Ecology and Environmental Research, 17(4), 7765–7781. https://doi.org/10.15666/aeer/1704_77657781
- Bartlett, A. C., Andales, A. A., Arabi, M., & Bauder, T. A. (2015). A smartphone app to extend use of a cloud-based irrigation scheduling tool. Computers and Electronics in Agriculture, 111, 127–130. https://doi.org/10.1016/j.compag.2014.12.021
- Bennett, D. R., Harms, T. E., & Entz, T. (2014). Net irrigation water requirements for major irrigated crops with variation in evaporative demand and precipitation in southern Alberta. Canadian Water Resources Journal/Revue Canadienne des Ressources Hydriques, 39(1), 63–72. https://doi.org/10.1080/07011784.2014.872864
- Bisa, M. E., Desta, F. Y., & Bresci, E. (2018). Yield and water productivity analysis of tomato crop under water stress conditions in Ethiopia. In technological interventions in management of irrigated agriculture. In M. R. N. S. Goyal, Ed., Technological interventions in management of irrigated agriculture (1St, pp. 147–159). Apple academic press. https://doi.org/10.1201/9781315204307
- BlonquistJr, J. M., Jones, S. B., & Robinson, D. A. (2006). Precise irrigation scheduling for turfgrass using a subsurface electromagnetic soil moisture sensor. Agricultural Water Management, 84(1–2), 153–165. https://doi.org/10.1016/j.agwat.2006.01.014
- Brouwer, C., Prins, K., Kay, M., & Heibloem, M. (1988). Irrigation water management: Irrigation methods, training manual No. 5, 1988, food and agriculture organization of the United Nations. http://www.fao.org/3/S8684E/s8684e00.htm#Contents.
- Cooley, N., Ooi, S. K., Mareels, I., Dunn, G., Dassanayake, K., & Saleem, K. (2010). Automation of on-farm irrigation: Horticultural case study. IFAC Proceedings Volumes, 43(26), 256–261. https://doi.org/10.3182/20101206-3-JP-3009.00045
- Daniel, G. E., Berhanu, G. S., & Kassaye, G. L. (2020). Critical review on improving irrigation water use efficiency: Advances, challenges, and opportunities in the Ethiopia context. Water-Energy Nexus, 3, 143–154. https://doi.org/10.1016/j.wen.2020.09.001
- Derib, S. D., Descheemaeker, K., Haileslassie, A., & Amede, T. (2011). Irrigation water productivity as affected by water management in a small-scale irrigation scheme in the Blue Nile basin, Ethiopia. Experimental Agriculture, 47(S1), 39. https://doi.org/10.1017/S0014479710000839
- Dirirsa, G., Bekele, D., & Hordofa, T. (2017). Crop coefficient and water requirement of tomato (Melka Shola Variety) at melkassa, central rift valley of Ethiopia. Academic Research Journal of Agricultural Science and Research, 5(5), 336–340. http://doi.org/10.14662/ARJASR2017.03
- Doorenbos, J., & Pruitt, W. O. (1977). Crop water requirements. FAO irrigation and drainage paper 24. Land and Water Development Division, FAO, Rome, 144(1).
- Edamo, M. L., Ukumo, T. Y., Lohani, T. K., Mirani, K. B., & Ayele, M. A. (2022). Flood inundation mapping under climate change scenarios in the Boyo watershed of Southern Ethiopia. Journal of Water and Climate Change, 13(8), 3170–3188. https://doi.org/10.2166/wcc.2022.193
- Evett, S. (2008). Neutron moisture meters ( No. IAEA-TCS–30). http://wwwpub.iaea.org/MTCD/publications/PDF/TCS-30web.pdf
- Fereres, E., & Soriano, M. A. (2007). Deficit Irrigation for reducing agricultural water use. Journal of Experimental Botany, 58(2), 147–159. https://doi.org/10.1093/jxb/erl165
- Gomez, K. A., & Gomez, A. A. (1984). Statistical procedures for agricultural research. Academic Press
- Grabow, G., Ghali, I., Huffman, R., Miller, G., Bowman, D., & Vasanth, A. (2013). Water application efficiency and adequacy of ET-Based and soil moisture–based irrigation controllers for Turfgrass Irrigation. Journal of Irrigation & Drainage Engineering, 139(2), 113–123. Available from. https://doi.org/10.1061/(ASCE)IR.1943-4774.0000528
- Gu, Z., Qi, Z., Ma, L., Gui, D., Xu, J., Fang, Q., Yuan, S., & Feng, G. (2017). Development of an irrigation scheduling software based on model predicted crop water stress. Computers and Electronics in Agriculture, 143, 208–221. https://doi.org/10.1016/j.compag.2017.10.023
- Haberle, J., & Svoboda, P. (2015). Calculation of available water supply in crop root zone and the water balance of crops. Contributions to Geophysics and Geodesy, 45(4), 285–298. https://doi.org/10.1515/congeo-2015-0025
- Hanson, B., Orloff, S., & Peters, D. (2000). Monitoring soil moisture helps refine irrigation management. California Agriculture, 54(3), 38–42. https://doi.org/10.3733/ca.v054n03p38
- Hedley, C. B., & Yule, I. J. (2009). A method for spatial prediction of daily soil water status for precise irrigation scheduling. Agricultural Water Management, 96(12), 1737–1745. https://doi.org/10.1016/j.agwat.2009.07.009
- Juan, E. J., Wiedenfeld, B., Jifon, J., & Nelson, S. (2009). Onion yield and quality response to two irrigation scheduling strategies. Scientia horticulturae, 120(3), 301–305. https://doi.org/10.1016/j.scienta.2008.11.004
- Junwang, G., JiushengLi, J., QuanzhongHuang, H., Zheng, J., Huang, Q., & Liu, H. (2017). Effect of soil moisture-based furrow irrigation scheduling on melon (Cucumismelo L.) yield and quality in an arid region of Northwest China. Agricultural Water Management, 179(1), 167. https://doi.org/10.1016/j.agwat.2016.04.023
- Kifle, T. (2018). Evaluation of tomato response to deficit irrigation at Humbo Woreda, Ethiopia. International Journal of Research-GRANTHAALAYAH, 6(8), 57–68. https://doi.org/10.29121/granthaalayah.v6.i8.2018.1262
- Luke, M., Vellidis, G., Coolong, T., & Coolong, T. (2018). Comparing a smartphone irrigation scheduling application with water balance and soil moisture-based irrigation methods: Part I—plasticulture-grown tomato. HortTechnology, 28(3), 354–361. https://doi.org/10.21273/HORTTECH04010-18
- Marazky El, M. S. (2018). Effects of scheduling techniques of water application for drip irrigation system on tomato yield in arid region. Egyptian Journal of Agricultural Research, 96(1), 237–251. https://doi.org/10.21608/ejar.2018.132661
- McCready, M. S., & Dukes, M. D. (2011). Landscape irrigation scheduling efficiency and adequacy by various control technologies. Agric Water Manag, 98, 697–704. https://doi.org/10.1016/j.agwat.2010.11.007
- Micheal. (1997). Irrigation theory and practice. Evaluating lands for irrigation commands (Reprinted ed.). 1991. Vikas Publishing house Pvt.Ltd.
- Migliaccio, K. W., Morgan, K. T., Vellidis, G., Zotarelli, L., Fraisse, C., Zurweller, B. A., Andreis, J. H., Crane, J. H., & Rowland, D. L. (2016). Smartphone apps for irrigation scheduling. Transactions ASABE, 59, 291–301. https://doi.org/10.13031/trans.59.11158
- Miller, L., Vellidis, G., & Coolong, T. (2018). Comparing a smartphone irrigation scheduling application with water balance and soil moisture-based irrigation methods: Part II—plasticulture-grown water melon. HortTechnology, 28(3), 362–369. https://doi.org/10.21273/HORTTECH04010-18
- Munoz-Carpena, R., Dukes, M. D., Li, Y., & Klassen, W. (2005). Field comparison of tensiometer and granular matrix sensor automatic drip irrigation on tomato. HortTechnology, 15(3), 584–590. https://doi.org/10.21273/HORTTECH.15.3.0584
- Nouri, H., Glenn, E. P., Beecham, S., ChavoshiBoroujeni, S., Sutton, P., Alaghmand, S., Noori, B., & Nagler, P. (2016). Comparing three approaches of evapotranspiration estimation in mixed urban vegetation: Field-based, remote sensing-based and observational-based methods. Remote Sensing, 8(6), 492. https://doi.org/10.3390/rs8060492
- O’Shaughnessy, S. A., & Rush, C. (2014). Precision agriculture: Irrigation. In N. Alfen (Ed.), Encyclopedia of Agriculture and Food Systems (pp. 521–535). Academic Press.
- Oshunsanya, S. O. (2019). Introductory Chapter: Relevance of soil pH to agriculture. In S. Oshunsanya (Ed.), Soil pH for nutrient availability and crop performance. IntechOpen. https://doi.org/10.5772/intechopen.82551
- Payero, J. O., Tarkalson, D. D., Irmak, S., Davison, D., & Petersen, J. L. (2008). Effect of irrigation amounts applied with subsurface drip irrigation on corn evapotranspiration, yield, water use efficiency, and dry matter production in a semiarid climate. Agric Water Manage, 95(8), 895–908. https://doi.org/10.1016/j.agwat.2008.02.015
- Ruixiu, S. (2018). Irrigation scheduling using soil moisture sensors. The Journal of Agricultural Science, 10(1), No.1. https://doi.org/10.5539/jas.v10n1p1
- Sabine, S. J., Werisch, S., Barfus, K., Wagner, M., Schütze, N., & Laber, H. (2016). Field evaluation of irrigation scheduling strategies using a mechanistic crop growth model. Irrigation and Drainage, 65(2), 214–223. https://doi.org/10.1002/ird.1942
- SAI Platform. (2010). Irrigation scheduling.Water Conservation Technical Briefs Tb6Saleh Taghvaeian, 2017. Surface Irrigation Systems. Oklohoma state university. https://extension.okstate.edu/
- Savva, A. P., & Frenken, K. (2002). Planning, development, monitoring and evaluation of irrigated agriculture with farmers’ perception, vol 2. In Food and agriculture organization of the united nations (FAO) sub-regional office for east and southern africa (SAFR) (pp. 1–14).
- Sharma. (2019). Evapotranspiration based irrigation scheduling on water-balance method. University of Minnesota Extension. https://blog-cropnews.extension.umn.edu/2019/01/soil-water-basics-for-irrigation.html
- Subedi, A., & Chávez, J. L. (2015). Crop evapotranspiration (ET) estimation models: A review and discussion of the applicability and limitations of ET methods. The Journal of Agricultural Science, 7(6), 50. https://doi.org/10.5539/jas.v7n6p50
- Teklu, L. (2017 April). Effect of furrow irrigation methods and deficit levels on soil properties and yield of tomato (Solanum lycopersicum L.) at Dugda District, Central Rift Valley, Ethiopia. 6(04).
- Ukumo, T. Y., Edamo, M. L., Abdi, D. M., & Derebe, M. A. (2022). Evaluating water availability under changing climate scenarios in the Woybo catchment, Ethiopia. Journal of Water and Climate Change, 13(11), 4130–4149. https://doi.org/10.2166/wcc.2022.343
- Varble, J. L., & Chávez, J. L. (2011). Case study: improved agricultural irrigation scheduling using a soil water content sensor (Doctoral dissertation, Colorado State University Libraries). https://doi.org/10.25675/10217/200990
- Vellidis, G., Liakos, V., Perry, C., Porter, W., & Tucker, M. (2016). Irrigation scheduling for cotton using soil moisture sensors, smartphone apps, and traditional methods. In S. Boyd, M. Huffman, & B. Robertson (Eds.), In: Proceedings of the 2016a Beltwide Cotton Conference (pp. 772–780). New Orleans: National Cotton Council, Memphis.
- Yadav, P. K., Sharma, F. C., Thao, T., & Goorahoo, D. (2020). Soil moisture sensor-based irrigation scheduling to optimize water use efficiency in vegetables. Irrigation Association, 1–7.
- Yohannes, D. F., Ritsema, C. J., Eyasua, Y., Solomona, H., Dam, J. C. V., Froebrich, J., Meressa, A., & Meressa, A. (2019). A participatory and practical irrigation scheduling in semiarid areas: The case of the Gumselassa irrigation scheme in Northern Ethiopia. Agricultural Water Management, 218, 102–114. https://doi.org/10.1016/j.agwat.2019.03.036
- Zhang, J., Sui, X., Li, B., Su, B., Li, J., & Zhou, D. (1998). An improved water-use efficiency for winter wheat grown under reduced irrigation. Field Crops Research, 59(2), 91–98. https://doi.org/10.1016/S0378-4290(98)00104-X
- Zheng, J., Huang, G., Jia, D., Wang, J., Mota, M., Pereira, L. S., Liu, H., Xu, X., & Liu, H. (2013). Responses of drip irrigated tomato (Solanum lycopersicum L.) yield, quality and water productivity to various soil matric potential thresholds in an arid region of Northwest China. Agricultural Water Management, 129, 181–193. https://doi.org/10.1016/j.agwat.2013.08.001