
 ?Mathematical formulae have been encoded as MathML and are displayed in this HTML version using MathJax in order to improve their display. Uncheck the box to turn MathJax off. This feature requires Javascript. Click on a formula to zoom.
Abstract
Fish oil is a nutrient-dense dietary product that contains long-chain omega-3 polyunsaturated fatty acid which is used to prevent and reduce type II diabetes, coronary heart disease, stroke, excessive blood pressure, and other cholesterol-related health issues. This study’s main goal is to use a solvent to extract omega-3 fatty acids from fish oil. The extraction of omega-3-fatty acid was carried out at a speed of 4000rpm, temperature 60 oC, pH 6.5, 70-minute extraction period and a ratio of Methanol: Chloroform (2:1 v/v %). The extracted samples were characterized by proximate value and the result was found to be moisture content of (0.933), Organic dry matter (53.11%), ash content (1.18
) total protein (0.96),Insoluble matter(0.01), acid value (14.96
), peroxide value (22.433
),Refractive index(1.414), Saponification value (99.3
31.2), Fat% 43.7
, iodine value (31.72
), Density Value(0.975
, % free fatty acid (0.846), pH (6.233
), value specific gravity (1.31
). The instrumental characterization was performed by using GC-MS, for the analysis of the FFA profiles and functional constitutions; we used UV-Visible and FTIR spectroscopy. To maintain compliance with commercial specifications and food standards, it is crucial to quantify proximate composition. With a ratio of 1.325 to 2.567, the high quantities of unsaturated fatty acids and low levels of saturated fatty acids imply that the oils and fatty acids have low cholesterol levels overall. Ratio for economic evaluation is necessary to ensure that by-products have a bright future and may be turned into new goods with a significant value addition.
1. Introduction
Fish is typically regarded as a healthy dietary source and is occasionally referred to as “brain food.” Besides fish oil can be obtained through eating fish or by taking supplements that are linked to the treatment of several fish/fish oil-related conditions. Because it contains long-chain omega-3 polyunsaturated fatty acids (PUFA), like docosahexaenoic acid (DHA), docosapentaenoic acid (DPA), and eicosapentaenoic acid (EPA), which are currently highly valued for their preventative and therapeutic properties in the nutritional and health fields, fish oil is an industrial product with significant nutritional value. The amount of EPA and DHA in fish oil is a crucial indicator of the product’s quality (Amuamuta et al., Citation2014). The absence of these fatty acids is linked to a variety of inflammatory processes and the fragile neural development in human patients. These fatty acids are related to many neuronal functions. Additionally, fish oils are recognized to help diabetic people. Fatty acids have also been said to benefit the therapy of AODS sufferers, according to reports. The American Heart Association Nutrition Committee advises eating fish two to three times a week due to the significant health benefits of seafood consumption (NO Halisdemir University, Citation2019; Rocio Bonilla-Mindez & Luis Hoyos-Concha, Citation2018). Omega-3 fatty acids have long been recognized as a necessary nutrient for human growth and as a healthy food, but they cannot be produced by the body and must be received from an outside source. Omega-3 PUFAs are only found in aquatic creatures and are mostly present in the blubber of marine mammals like seals and whales, the body of oily fish like mackerel, menhaden, and salmon, and the liver of lean white fish like cod and halibut. The body transforms the major omega-3 fatty acid, alpha-linoleic acid (ALA), into the fatty acids eicosapentaenoic acid (EPA) and docosahexaenoic acid (DHA). These PUFAs serve a variety of physiological roles and have many uses. For instance, EPA has been utilized in Japan since 1990 to treat arteriosclerosis and hyperlipemia. DHA helps to prevent a variety of illnesses in people, including cardiovascular disease. For these reasons, PUFA can be derived from marine species like fish, and the main commercial source of PUFA is fish oil. Tuna oil containing DHA has also been utilized as a food product as an ingredient in infant formulae. About 50% of the weight of the fish is made up of byproducts from fish processing. Such by-products are either used as fertilizers or to make fishmeal, which also produces fish oil. The amount of fish oil varies depending on the species of fish (catfish, Nile perch, and tilapia). By raising heart rate variability, lowering the risk of stroke, lowering serum triacylglycerol (TAG) levels, lowering systolic and diastolic blood pressure, and modifying glucose metabolism, marine long-chain n-3 PUFA have positive health impacts. Additionally, n-3 PUFA possesses anti-inflammatory and anti-cancer properties (Huang et al., Citation2021; Morris, Citation2019; Sierra Lopera et al., Citation2018; Y. Zhao et al., Citation2018). The most prevalent sources of n-3 PUFAs are oils of marine origin, which are also utilized in food, medicinal products, animal feeds, and other sectors of the agricultural and aquaculture industries. DHA and EPA make up more than 80% of the total n-3 PUFAs found in marine fish oils, which typically comprise 20% to 30% of these fatty acids. Fatty acid nutritional analysis can be divided into qualitative and quantitative categories. Data on the composition of fatty acids are obtained through qualitative examination of fatty acids and are presented as percentages of all fatty acids (% of total fatty acids). Quantitative analysis, on the other hand, can determine the precise weight of each fatty acid present in the food. Several different analytical techniques have been used to determine the amount of fat in foods. One particular worry was that using hydrochloric acid to hydrolyze fat or oil would result in the formation of FAME (fatty acid methyl ester), which would then polymerize to create an ether extractable. These extraneous materials would be classified as fat (Innes & Calder, Citation2020; KO et al., Citation2019; Z. J. C. Maron et al., Citation2016). In pre-agricultural times, the foods available to humans were game meat, fish, shellfish, green leafy vegetables, fruits, berries, honey, and nuts. In general, the gut and frame part of fish used for extracting large amounts of oil and food while other parts used as source of gelatin, leather, fish meal, and non-oily product. This diet influenced the genetics of human nutrition because it had more n-3 PUFA and less n-6 PUFA than modern diets. But the consumption of cereals significantly grew after the agricultural revolution. Because cereals are high in n-6 PUFA and low in n-3 PUFA, throughout the past 10,000 years, the n-6/n-3 PUFA balance to which humans have become accustomed has changed significantly (Bura Mohanarangan, Citation2012). The weight of each fatty acid in a given amount can be determined using quantitative analysis. Several different analytical techniques have been used to determine the amount of fat in foods. The hydrochloric ac id was a particular worry. Fat oil would be converted by the hydrolysis technique to FAME (fatty acid methyl ester), which would then polymerise to create ether extractable fat. Most research works done on the omega 3-fatty acid sources such as algae, from which omega 3 fatty acid is obtained by conversion while that from fish is direct. Cholesterol-dependent health problem such as coronary heart disease, stroke, type 2 diabetes and high blood pressure can be prevented and reduced through this omega 3- fatty acid extracted from different fish species. EPA and DHA cannot be synthesized endogenously in human body. There is only a low conversion rate of -linolenic acids (ALA) to EPA and DHA in human body as shown by several studies. Commonly used Omega 3-fatty acid extraction method is Enzymatic Extraction which is not cost effective and its availability is too low, while solvent-dependent extraction is proved possibility in recent study. It is considered that most fish species can produce Omega 3 fatty acids based on the majority of studies conducted in the area; however a recent study compared the yield and efficiency of at least three fish species and chose the best for future analysis as shown in Scheme (Ibrahim et al., Citation2020; Ryan et al., Citation2020).
Alpha-linolenic acid (ALA): With 18 carbon atoms and 3 double bonds, alpha-linolenic acid (18:3n-3) is a polyunsaturated fatty acid. In vegetable items, only this omega-3 fatty acid is present (Rocio Bonilla-Mindez & Luis Hoyos-Concha, Citation2018; Z. J. C. Maron et al., Citation2016).
Eicosapentaenoic acid (EPA): Long-chain fatty acids with a long, unbranched aliphatic tail (chain) of saturated or unsaturated carboxylic acid are the source of eicosapentaenoic acids (20:5n-3). Fish oil, marine weeds, algae, and seafood all contain EPA. EPA is used to treat cystic fibrosis, high blood pressure, diabetes, Alzheimer’s disease, depression, and high risk pregnancies (Bura Mohanarangan, Citation2012; Rocio Bonilla-Mindez & Luis Hoyos-Concha, Citation2018) and (Ibrahim et al., Citation2020).
Docosahexaenoic acid (DHA): Long-chain fatty acids having a long, unbranched aliphatic tail (chain) of a saturated or unsaturated carboxylic acid are known as docosahexaenoic acids (22:6n-3). Fish oil, sea weeds, algae, and seafood all contain DHA. Basic sources of DHA include oily fish, such as cod liver, herring, mackerel, salmon, and sardines, as well as byproducts of algal fermentation (Ryan et al., Citation2020).
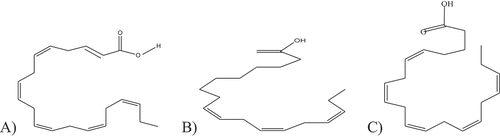
Scheme 1. Structure of DHA (A), ALA (B), and EPA in Figure C. Accordingly (Bura Mohanarangan, Citation2012; C & I, Citation2016), .
The continuous looking effort of our country toward the manufacturing of omega 3-fatty acid to compete at a national health problem in a country, because of a serious health problem due to cardiovascular disease (CVD) is expected as the leading cause of mortality in the society. In line , market competition among oil manufacturing and processing industries on oil rich grain extraction focuses slowly on quantity. Therefore pulse and related grain based oil is going to be produced with high degree of saturation that can cause cholesterol lead disease specifically cardiovascular diseases. Cholesterol-dependent health problem such as coronary heart disease, stroke, type 2 diabetes and high blood pressure can be prevented and reduced through this omega 3- \fatty acid extracted from different fish species. EPA and DHA cannot be synthesized endogenously in human body. There is only a low conversion rate of -linolenic acids (ALA) to EPA and DHA in human body as shown by several studies. All these reasons have pressed a number of organizations to recommend higher intakes of these n-3 fatty acids (Z. J. C. Maron et al., Citation2016). Nowadays, due to growing public demand for functional food such as Creams, processed cheese, milk, egg and breads, most of the coffee creamers are considered as unhealthy products because they contain high amount of saturated fats and/or hydrogenated oils as lactose intolerance which are avoided by some consumers who are with allergic potential. So, this study has a solution to stable nutrient constituting fatty acid and health problem of heart, blood clotting related disease as direct food product or as value added product in addition, the by-product from processing of fatty acid can be applied as fish silage (as enzyme) for further extraction method and neutralized with easily available chemical to less effect causing product. As a result, this study focused on the synthesis and characterization of fish oil fatty acids for their primary usage as food products and as improvers.
2. Materials and methods
2.1. Description of the study area
Chamo Lake is found in the SNNPR (South Nation Nationality People and Region) of Ethiopia, located in the Main Ethiopian Rift, at an elevation of 1,110 meters. The Chamo Lake is just to the south of Lake Abaya and the city of Arba Minch, east of the Guge Mountains, and west of the Amaro Mountains. According to figures published by the Central Statistical Agency, it is about 32 kilometers long and 13 km wide, with a surface area of 317 square kilometers and a maximum depth of 14 meters with a catchment of about 18,757 square kilometers in size.
2.2. Materials and chemicals
Chloroform and hexanes were gained from Arba Minch University Laboratory. Additional chemicals used were also obtained from chemical laboglass and Laboratory.
Chemicals: CHCL3, (C2H5)2O, HCL, H2SO4, KOH, CH3OH, CH3OH, C6H14, Na2SO4 C10H16N2O8, C6H5CH3, C6H14, (95%), C3H8O, CH3COH, KI, Na2S2O3 and CCL4.
2.3. Materials and equipment’s
The equipment used in this study were Round Bottom Flask, GC-MS, Measuring Cylinder,Mechanical Shaker(RECIPRO SHAKER SSL2), Conical Flask, Hot Mantle, Ice Box Test Tubes, Plastic Bags, pH-Meter(HI 99,121 pH meter), Separatory Funnel, Filter, Paper FTIR (IR 8900,shimadzu japan,) Aluminum Foil, Knife Cutter, Thermometer, UV-Spectrometer(UV-SECORD PLUS:GERMANY), Rotary Evaporator(RVO 400, NY), Thimble, Thermometer, Mechanical Balance, Reflux Condenser and Centrifuge(HERMLE, Z300).
2.4. Sample preparation
Initially trapped fish were separated at ambient temperature and their tails and heads were properly separated. Then the prepared fish meat samples of three fish types Catfish (Ambaza), Nile (Nech Asa) and Tilapia (Koroso Asa) kept on ice block in the icebox in order to maintain the cold chain (low temperature storage) to reduce spoilage (Amuamuta et al., Citation2014). The samples were stored in the icebox with labeled plastic containers and transported to the laboratory for the next stage process.
2.5. Method for extraction of fat
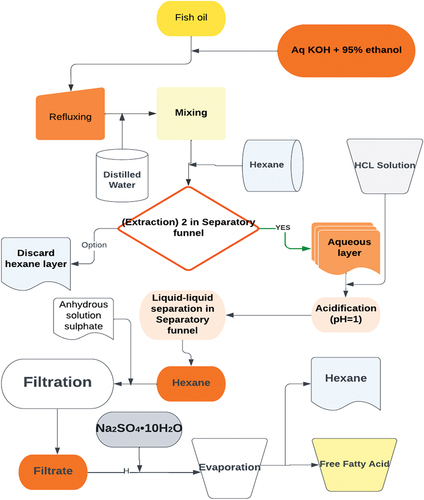
From each of the three samples 100 g of fish species (Nile, Tilapia and Cat), 200 mL of methanol and 100 mL of chloroform mean that Methanol and chloroform were utilized in a ratio of 2:1, respectively were combined, mixed for two minutes, and then shaken (STUART RECIPROCATING SHAKER SSL-2). A further 100 cc of chloroform were added, and the mixture was maintained for 30 seconds. Following this, 100 ml distilled water was added and blending continued with shaker for another 30s. The homogenate was centrifuged for 15 minutes at 5°C and 4000 rpm (HERMLE, Z300). The liquid was finally filtered, and the filtrate was saved for later processing. The particles were then mixed with 20 mL of the solvent (chloroform: methanol), and centrifugation was performed once more. Filters were used to remove the solids from the liquid. After being blended, the two filtrates were poured into a separatory funnel. A bed of anhydrous sodium sulfate was used to collect and filter the lowest layer of chloroform (1 gm). A rotary evaporator was used to evaporate the mixed filtrate at 60°C (RVO 400, NY). Finally, Primary Extract Catfish was chosen based on the percentage of extraction efficiency. Additionally, only a certain variety of fish is used for the secondary extraction process (Cat fish).
2.6. Concentrating of Omega-3 fatty acids
In this work, free fatty acids were separated from fish oil using suitable extraction methods. Acid hydrolysis was performed, in which about 30 mL of HCl were added to the sample solution. Next to this 50 mL of mixture of petroleum ether and diethyl ether at the same proportion were added and mixed for two minutes with the solution. At this stage, fatty acid was placed at the upper phase that was poured at balloon by using a separating funnel and then a rotary evaporator was used to evaporate the solvent at 40C. Later the total fatty acids extracted were weighed and used for percentage yield determination as shown in figure (Amuamuta et al., Citation2014; C & I, Citation2016).
Figure 1. A schematic for extracting and concentrating fish oil’s free fatty acids (Chandra Shahi et al., Citation2017) .
2.7. Physical and proximate compositional analysis
The four major constituents in the edible portion of fish are water, lipid (fat and oil) and ash (mineral). The analysis of these four basic constituents of fish muscle is referred to as proximate analysis.
Acid Value, Specific gravity, Refractive index, free fatty acids, Peroxide value were determined According to (AOCS, 2000).
The Moisture Content, Ash Content, Iodine Value, saponification value, Fat content, Carbohydrate, protein content was determined by using AOAC, (2000) method
Percent organic matter of samples were estimated by subtracting total ash of the respective from Hundred as follows.
Percent of Organic Dry matter (ODM) = 100-Total ash
2.8. Peroxide value
According to (AOCS, 2000) the peroxide value was determined as 5 g of the extracted oil sample was added in a 250 ml Erlenmeyer flask and 30 ml of 3:2 ratio of acetic acid-chloroform solution was added and swirled to dissolve the sample. Then 0.5 ml potassium iodide solution was added and allowed for 1 min with occasional shaking. Finally, 30 ml of distilled water was added; and the sample was titrated against 0.1N sodium thio-sulfate until the yellow color was disappears. About 0.5 ml of starch indicator solution added and the titration continued with constant agitation later the blue color disappeared. A blank was prepared without adding the sample (KO et al., Citation2019; Ndidiamaka & Emmanuel Ifeanyi, Citation2018). The peroxide value (milli equivalents) peroxide/1000 g sample) was determined by applying the following formula:
Where,
S = ml of standard potassium thiosulphate used for titration of sample
B= ml of standard potassium thiosulphate used for titration of blank
N = normality of sodium thiosulphate solution
1000 = per 1000 g of sample
W = gram of sample
2.9. Ash determination
Ash was determined by the method of the Association of Official Analytical Chemists (AOAC), using the official method. Clean ceramic crucible, dried at 120ºC in an oven, then cooled in desiccators and weighed (M1). A 4 g of samples were weighed into a dried and weighed (M2) crucible. Then crucible with the contents were placed in a Muffle furnace, at 600°C for 6 hours for ignite until ash was complete. After this period the crucible with its content was removed and cooled in desiccator. Then the crucible with the residue was weighed (M3).
The weights of the ash were expressed as a percentage of the initial weight of the samples. The total ash was expressed as percentages on dry matter basis as follows [57,58].
Where: (M2-M1) is sample mass in g on dry base and (M3-M1) mass of ash in gm.
2.10. Determination of organic dry matter (ODM)
Percent organic matter of samples were estimated by subtracting total ash of the respective from Hundred as follows.
Percent of Organic Dry matter (ODM) = 100-Total ash
2.11. Density value
The density value of catfish was determined by weighing the mass in gram with relative to the known volume of sample in triplicate reading as follows: 10 ml of Sample 1 was taken and weighed to weigh 12.8 g; again same volume and sample weigh 9.3 g and third reading of 9.7 g. While test 2 of same sample with same volume of 10 ml weigh 8.6, 8.25 and 9.1 while third reading is 10.7 g, 9.6 g and 9.47 g based this mass and volume, density value determined as: Mean average of three mass values versus volume is 31.8 g, 25.95 and 30.01 g. Based this mass and volume, density value determined as:
2.12. Moisture content determination
The Moisture Content was determined according to the AOAC Method (1984, 2000) three aluminum dish of known diameter and thickness was weighed to be 40.5 g, 25.5 g and 43.7 g. 5 g of fat were added to all dishes. The dishes and its contents were weighed (45.3 g, 30.1and 48.7 g placed in an air oven of known model (UF-260) at 65C and dried in 24 hours. After drying to a constant weight, the covered dish was transferred to desiccator to cool and then it was reweighed. The Percentage of moisture content was calculated as following:
Where, W1- Original weight of crucible and sample
W2- Weight of empty dish and W o- weight of sample
2.13. Determination of iodine value
Iodine value (IV) is measure of the total number of double bonds present in fats (it is index of unsaturation). It is expressed as the “number of grams of iodine that will react with the double bonds in 100 grams of fats or oils”. The determination is conducted by dissolving a weighed sample in a non-polar solvent Carbon Tetrachloride, then adding glacial acetic acid. The double bonds are reacted with an excess of a solution of iodine Tetrachloride in glacial acetic acid. Initially 20 ml of carbon tetrachloride (solvent) was added into 0.2 g sample that is placed into 250 ml flask and the mixture swirled. Then about 25 ml of Wijs’s iodine solution was pipette into flask containing the sample and covered with glass cork and swirled to ensure an imitate mixture. A blank was prepared simultaneously under similar experimental condition. The flask was stored in the dark for 30 minutes at a temperature of 25 C±5C after which 15 ml of potassium iodide (KI) solution was added, followed by 100 ml of distilled water. The solution was being titrated with 0.1 M sodium thiosulphate solution using starch as an indicator with constant and vigorous shaking (Singh et al., Citation2017).
2.14. Determination of saponification value
2.00 g of the sample was weighed into 25 ml of 0.5N alcoholic KOH solution. Then the reaction mixture is refluxed using a water condenser on a water bath for 30 minutes with constant shaking. The resulting solution is cooled and titrated against a 0.5N HCL Solution adding 1 ml of phenolphthalein. The number of ml of acid required is recorded.
An exactly identical blank experiment (leaving the fat or oil) is performed. Number of ml of hydrochloric acid required is recorded (O S I Okafor & C, Citation2016; Purnamayati et al., Citation2019).
2.15. Fat content
The total fat content of fat oil extract was determined by using AOAC, (2000) method. 250 ml of 1:1 ratio chloroform to Methanol solution was taken in two separate round bottom flasks (capacity, each 250 ml) and were used for fat extraction.
A Soxlet extractor was properly arranged (shown in Appendix 3.5) on each of the round bottom flasks containing solvent Chloroform: Methanol. The cover was introduced into the extractor, and the fat extraction was performed for 2 hours at 60C. Then, the solvent (chloroform and Methanol) was recovered under separation by using a rotary evaporator (RVO 400) at 65C (see Appendix 3.5). The fat residue was allowed to dry and the mass was recorded. The total fat content was calculated as (Khalili Tilamiaand Sabine Samples & Sampels, Citation2018).
2.16. Determination of carbohydrate
The percentage of carbohydrate was calculated by subtracting the value obtained for percentage of the protein, fat, moisture and ash from 100. But for fish carbohydrate % is zero. Fish itself, as a protein, does not contain any carbohydrates until it is cooked with flour or another substance that includes carbohydrates.
2.17. Determination of acid value
The acid value of the fatty acid sample was being determined according to the procedure described in the AOCS official methods (AOCS, 1989). 125 ml of 1:1 toluene-isopropyl alcohol and 2 ml of phenolphthalein indicator was added into 250 ml glass Erlenmeyer flask and neutralized with 0.1N potassium hydroxide to a faint permanent pink color. 0.5 g sample was neutralized with the added 125 ml of solvent mixture and the titration was then carried out with 0.1N potassium hydroxide solution until the permanent pink color appear and that was used for calculation the acid content in the extracted samples. The acid value (mg KOH/g of sample) was given by the following formula (Bura Mohanarangan, Citation2012).
Where:
A= ml of standard alkali used in the titrating the sample
B= ml of standard alkali used in the titrating the blank
N= normality of standard alkali
W= weight of sample in gram
56.1= molecular weight of KOH in gram potassium thiosulphate
2.18. Determination of specific gravity
Density bottle was used to determine the density of the fat. A clean and dry bottle of 25 mL capacity was weighed (W0) and then filled with the oil, stopper inserted and reweighed to give (W1). The oil was substituted with water after washing and drying the bottle and weighed to give (W2). The specific gravity (Sp.gr) was obtained from the appearance (AOCS, 1992) (Rasel Molla & Abdur Rashid Mia, Citation2016).
2.19. Determination protein
Protein of the sample was determined using the Kjeldhal method described by AOAC. A one gram of dried sample was digested in a 500-mL Kjeldhal digestion flask by boiling with, 3.4 ml of concentrated sulfuric acid (98%) and 3.4 g of K2SO4 and 0.183 g CuSO4 used as catalyst and to elevate the boiling point of sulfuric acid. The digestion was continued for 3 hours at 400°C until the mixture became a clear solution.
2.19.1. The digestion step reaction
Breakage of nitrogen bonds and reduction to Ammonium ions (NH4+)
Then, the digested sample made by adding 25 ml of 40% NaOH and 50 ml of distilled water. The solution was slowly and automatically added to mixture by Kjeldha titration apparatus.
The ammonia liberated was collected in 20 ml of boric acid with 10 drops of methyl red indicator solution. Steam was applied to the solution to distill out ammonia evolved with the distillate collected into the boric acid solution. As the distillation was continued, the pink color solution of the receiver flask was turned to green which indicating the presence of ammonia.
2.19.2. The reaction steps of distillation process
The green color solution was then titrated with 0.02N hydrochloric acid solutions. At the end point, the green color turned to red pink color, which indicated that, all the nitrogen trapped as ammonium borate have been removed as ammonium chloride. Blank nitrogen determination was carried out in a similar manner and subtracted from the sample nitrogen.
2.19.3. The reaction step of titration process
Titration with standard acid determines the amount of ammonia and therefore nitrogen in the sample.
The nitrogen content of the sample is given by the formula below (Gupta, Citation2014) and Percent crude protein is percent nitrogen x 6.25.
% Protein = % N × 6.25
Where V is the volume of hydrochloric acid solution in the titration (cm3), B is the volume of hydrochloric acid solution obtained in the titration of the blanks (cm3), Na = concentration or normality of acid, V1 = volume of distilled water used for distilling the digest (50 cm3), V2 = volume of aliquot used for distillation (10 cm3), G = Original weight of sample used in gram (Bako, Citation2017).
2.20. Determination of refractive index
Refractometer was used to determine refractive index in which few drops of the sample were transferred into the glass slide of the refractometer (Digital Refratometer represented on Appendix no 3.1).Refractive Index refractometer was used in the determination of refractive index and in this case, a few drops of the sample were transferred into the glass slide refractometer.
Water at 30°C was circulated round the glass slide to keep its temperature uniform. Through the space of the refractometer, the dark portion viewed was adjusted to be in line with the intersection of the cross. The refractometer was calibrated using distilled water where the refractive index of water at that temperature was obtained. The procedure was repeated for triplicate samples and their refractive indices were obtained at 30°C. The mean value for each sample was noted and recorded as the refractive index. At no parallax error, the pointer on the scale pointed to the refractive index (AOCS, 1992) (Rasel Molla & Abdur Rashid Mia, Citation2016; YF Lamayi et al., Citation2013) and (M et al., Citation2017).
2.21. Qualitative determination and characterization
2.21.1. Determination of pH Value
Determination of the pH will be performed without previous dilution of the fatty oil and performed by inserting electrode into the sample at the temperature of 252C.The potentiometer model pH(HI 99,121 pH meter) represented on Appendix no 3.2).
2.22.2. Determination of free fatty acids (FFA)
FFA value was determined according to the method describe in AOCS method (AOCS, 1992). The extracted fish oil sample 5 g was mixed with 75 mL of 95% neutral ethyl alcohol and swirled with Phenolphthalein indicator. The solution was titrated with 0.1N sodium hydroxide until pinkish color was observed at end point. Percentage for FFA was expressed as oleic acid. [Represented on appendix 2] Fish oil with the lowest FFA value could be extracted at 90 °C for 25 minutes. FFA was calculated as (B et al., Citation2018; C & I, Citation2016): and (Rincon-Cervera et al., Citation2020).
The free fatty acids amount of the fat and oils determines the quality of the oil itself Oils which are high in free fatty acids content have poor quality of oil and suffer significant losses during refining process The maximum standard specification set by the Palm Oil Refiners Association for the free fatty acids content (as palmitic acid) in crude palm oil (CPO) is 5 % and should be lower than 0.1 % in Refined Bleached Deodorized Oil (RBDO). The FFA value is a measure of the extent to which the glyceride in the oil has been decomposed by lipase action. Since rancidity is usually accompanied by free fatty acid formation, the determination is often used as a general indication of the condition and edibility of the oil which also gives an indication of the age and the quality of fat (Rincon-Cervera et al., Citation2020; Y, “Nutritional and Phytochemical Evaluation of Anchote Cocciniaabyssinica Accessions to Promote its Contribution for Food Security and Medicinal Use”, Citation2016).
2.23.3. Analysis of methyl esters
Initially, 2 mL of H2SO4-MeOH solution (1 percent) was added to 40 mL of fat sample that had been deposited in 10 mL centrifugal tubes. The mixture was heated for one hour at 70°C. 3 mL of n-hexane and 2 mL of distilled water were added and well mixed when the mixture had cooled to room temperature. For GC analysis, the extracts were taken out (Aitta et al., Citation2021).
2.24.4. Analysis by GC-MS
A GC-MS with an HP-INNOWax capillary column (HP-88, 30 m × 0.25 mm x 0.20 m) was used to analyze the methyl esters. With a split ratio of 30:1, nitrogen was used as the carrier gas at a flow rate of 0.5 mL/min. The temperature was 210°C at the start. The temperature then rose at a rate of 1°C/min until it reached 240°C, where it was maintained for 17°C min. The temperatures of the injector and detector were 250 and 300°C, respectively. Fatty acid methyl esters were introduced into the GC column as a 1 L sample. By calculating the functional assay’s retention period, the fatty acids were identified (Aitta et al., Citation2021; Innes & Calder, Citation2020) and (H. Zhao et al., Citation2018). FFAs were quantified as their corresponding FAMEs. The free fatty acids were then converted into fatty acid methyl ester by being methylated with methanol and derivatized (FAME). Only the methyl ester form of the fatty acid composition may be separated using gas chromatography. Based on the degree of unsaturation and the number of carbon atoms in the fatty acid chain, this machinery separates the fatty acids (Liguori et al., Citation2020; Manning & Manning, Citation2014; Saganuwan & Saganuwan, Citation2017).
2.25.5. FTIR analysis
The FTIR Spectrometer (model: 8900, Shimadzu, Japan) was employed to determine the presence of a functional group of fish sample components in fish oil samples (J. C. Maron et al., Citation2016). In this investigation, a drop of the liquid sample was deposited on the surface of a polished salt plate (KBr) to prepare it for IR analysis. Next, a second plate was placed on top of the first plate to spread the liquid into a thin layer between the two plates and secure the plate clamps. At last, the liquid rubbed off the plate’s edge, sandwich plate onto sample holder. Residue from fish oil was removed by centrifuging the oil at 4000 rpm for 15 minutes by using a mechanical centrifuge machine and the upper layer liquid was poured. The obtained product rinsed with distilled water three times. The spectra were then scanned (operated) in the 4000-400 cm−1 wavenumber range with a resolution of 4 c−m1 after the application of a KBr-sample pellet. After that, using a micro centrifuge and isotonic saline solution of KBr solution, the cells will be washed twice. Before gathering FTIR spectrum data, the films were then allowed to dry for 30 minutes in a desiccator.
2.22. Statistical analysis
Results are expressed as the mean and standard deviation of three separate determinations based on Excel (Microsoft Office 2010) data interpretation, while Origin lab pro v8 0724.7 applied for graphical data interpretation.
3. Results and discussions
3.1. Physico-chemical properties
The physicochemical properties of Omega 3 fatty acid extracted from fish oil were determined and presented on Table :
Table 1. Fish species and their basic nutrient contents [5]
3.2. Peroxide value
As Peroxide value (PV) determines the range to which the oil and fat undergo rancidity during storage and it can be used to monitor the quality and stability of lipids with the low PV value shows better extract to be kept for a very long time. Because deterioration of the extract causes rancidity of the fat. On the other hand using such types of fat as a means of food additive will enhance the quality of the product through keeping the nature of the product as normal as it is 10 meq/kg as WHO (Dagnachew et al., Citation2015; Shahidi & Ambigaipalan, Citation2018). The higher the peroxide number, the higher the oil’s quality. In order to prevent rancid flavor, the peroxide value should generally not exceed 10 to 20 meq/kg fat.
3.3. Iodine value
Iodine value from the current study was 31.72 which show presences of saturated fatty acid in sample in addition to unsaturated fatty acid. The relative level of unsaturation in fat components is measured by the uptake of halogen and is known as the “Iodine Value.” Because the degree of unsaturation affects the melting point and oxidative stability, IV offers an estimate of these quality factors. The more unsaturation and oxidation susceptibility there is, the higher the iodine value. The quantity of reactive double bonds in the sample is indicated by a greater iodine value, which does not, however, reflect the quality of the sample of the product. The iodine value obtained is better as compared with the result (Saganuwan & Saganuwan, Citation2017; Shahidi & Ambigaipalan, Citation2018). Catfish is low in calories and packed with lean protein, healthy fats, vitamins, and minerals. It’s particularly rich in heart-healthy omega-3 fats and vitamin B12. It can be a healthy addition to any meal, though deep frying adds far more calories and fat than dry heat cooking methods like baking or broiling.
3.4. The total fat content
The content of fat in present study (43.7demonstrates that the cat fish is rich in oil, which is crucial for diet since it aids in the absorption of fat, soluble vitamins, and high-energy nutrients. as relative to 27.8 + 0.35% (Dagnachew et al., Citation2015). Total fat content was determined to know the quantity of the impurity, as the total fat content is very high which showed that the sample has a small quantity of impurities.
3.5. Specific gravity
Specific gravity for the Cat fish oil was 1.31 and this is quite similar to the published values of 0.89 to 0.92 for edible oils (Atinafu & Bedemo, Citation2011). The specific gravity of the cat fish oil is a respectable number is relative to suggested reference.
3.6. Acid value
The value of acid from current work is 14.96 which are below WHO standard and higher as compared to previous works. The amount of acid in the sample is measured using the acid value (mg KOH/g of sample), which also demonstrates how recently the fat sample was taken. Lower acid value means more cleansing (detergency) as rancidity is usually accompanied by free fatty acid formation, determination of acid value is frequently used as a general indication of the condition and edibility of fat. The capacity of the fat and oil to withstand hydrolytic rancidity is demonstrated by their low acid value and free fatty acids (Dagnachew et al., Citation2015). The level of free fatty acids rises with increasing acid value, which results in a reduction in oil quality. For oil samples, the acid concentration should be less than 0.6 mg KOH/g (measured in potassium hydroxide per gram) (Ahmed et al., Citation2020). The FAO and WHO specification of 2017 states that the permissible Acid value is 45 mg KOH/g (Ibrahim et al., Citation2020).
3.7. Saponification value
According to the oil study’s saponification value, the oil contains more short chain fatty acids (C12) than is permitted by the CODEX-STAN210-1999 standard permissibility threshold (190–209 mg KOH/g) (Ahmed et al., Citation2020). Due to the existence of a lengthy chain of unsaturated fatty acids and a lower molecular weight, the saponification value from the current study is 99.3 ± 31.2, which is below the standard value. Sometimes, the saponification value is utilized to look for contamination. The ability of an oil and oil to produce soap increases with the saponification number. More medium chain fatty acids are suggested by higher triglyceride saponification levels.
4. Moisture content
The extracted fish oil has a percentage moisture content of (0.933 ± 0.023), which indicates that the fatty acid sample has low dry matter content. This is advantageous because it has a tendency to reduce microbial activities, prevent oxidation-reduction reactions, limit the growth of algae and fungi, and extend shelf life proper storage alone may not be sufficient. The moisture content of catfish oil was 0.933 ± 0.023 in the current study and was 0.340 ± 0.01 in the study before it (Ahmed et al., Citation2020; Sumardiantob et al., Citation0000).
4.1. Protein content value
The result of protein value from the current study is 0.96 which shows less constituent of protein than expected due to temperature range during primary extraction which may lead protein to denature and decrease. The protein content of this study was less as compared to FAO recommended value 19.8% (WHO, 2004) it is expected that there may be denature due to high temperature during extraction. These findings are comparable to those found in protein studies that ranged from 6.7 to 19.4 (Atinafu & Bedemo, Citation2011; Chandra Shahi et al., Citation2017).
4.2. Density value
Centered on this mass and volume data the density of fish oil in this investigation came out to 0.975 ± 0.099. This outcome was better than that of the study, which claimed that density had an impact on the oil’s composition-related quality According to the study of (Lucia Viana Do Nascimentd1, Citation2015). Fish oil has a density ranging from 0.85–0.88. So the current study reveals the maxima of the density ranges. When the fats melt, their volume increases and therefore the density decreases.
4.3. Free fatty acid value
Percentage for FFA was expressed as oleic acid. FFA was calculated as 0.88 + 0.20 which was supported with the study of (Dagnachew et al., Citation2015; Saganuwan & Saganuwan, Citation2017). If the rate of frying is insufficient to sufficiently drive the water from the meal, free fatty acids occur as a result of the presence of moisture in the foods exposed to oil and fat, and the FFA concentration rises quickly. Fish oil with a greater FFA value was produced as a result of the higher extraction temperature. In line with rising extraction temperatures, FFA values fell.
4.4. Ash Determination
The fishes have an ash content ranging of 1.89 to 0.02 with frozen scrums having the greatest value. Both fish species are good sources of minerals like calcium, potassium, zinc, iron, and magnesium, according to the observed range of ash content. The percentage ash content is comparable to what other authors (Atinafu & Bedemo, Citation2011; Pravinkumar et al., Citation2014) reported. When it was said that the fish species were good providers of minerals based on the observed range of ash content (1.18%–0.21%). The high inorganic matter that could be kept in the body is indicated by the percent ash content (C & I, Citation2016), which supplies high energy nutrients.
4.5. Refractive index
Refractive Index refractometer was used in the determination of refractive index and in this case, a few drops of the sample were transferred into the glass slide refractometer. In this study the observed value of refractive index was 1.423 which reveals similarity with previous study of which was 1.6642 (Ahmed et al., Citation2020; Pravinkumar et al., Citation2014). The results suggest that Cat fish oil is desirable for purposes.
4.6. pH value
Determination of the pH will be performed without previous dilution of the fatty oil and performed by inserting electrode into the sample at the temperature of 252C.The potentiometer model pH (HI 99,121 pH meter). The pH result reading is 5.6, 6.2 and 6.9 which is acceptable, value of pH since it is near neutral range and slightly acidic. Additionally the recommendable value of acidifying fats and oils pH value is 4.0–6.9 and 7.36 ± 0.04 as report of reference material from (Ahmed et al., Citation2020; Shahidi & Ambigaipalan, Citation2018).
5. GC-MS result analysis
From the table below and () the GC-MS chromatogram of a methylated extract of fish oil showed nearly 15 compounds. Most of the compounds which were reported from fish samples are unsaturated fatty acids. The two predominant unsaturated fatty acids in catfish oil were oleic and linoleic. The saturated fatty acids included Palmitic and stearic acids, along with Docosahexaenoic acid, 9-octadecenoic acid, methyl ester, and hexadecanoic acid. Linoleic acid is present in significant concentrations in fish oil. Its presence in the body protects against several cardiac and vascular illnesses, which is in line with the findings of (Shahidi & Ambigaipalan, Citation2018). As seen in the table above, the sample has a very high concentration of omega-3 polyunsaturated fatty acids (especially Docosahexaenoic fatty acid). The highest levels of polyunsaturated fatty acids are seen in catfish (DHA). The amount of mono-unsaturated fatty acids (MUFA) in the fish sample under study is essentially the same. In line with expectations, trace levels of omega-6 fatty acids have also been found (9,12,15-Octadecatrienoic acid, (Z,Z,Z)-, Octadecadienoic acid (Z,Z)-, 5,8,11,14-Eicosatetraenoic acid methyl ester, (all-Z)-, 8,11,14-Eicosatrienoic acid, methyl ester). Palmitic acid is the saturated fatty acid found in higher concentrations in the samples under study.
Figure 2. Docosapentanoic acid.
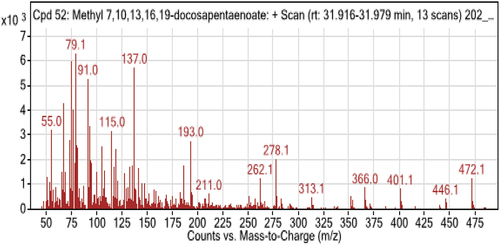
Figure 3. Eicosapentanoic acid.
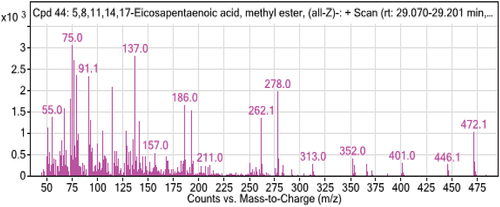
Figure 4. Docosahexaenoic acid.
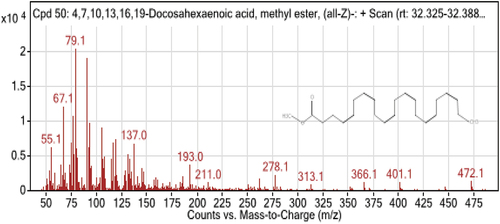
Table 2. Physicochemical properties fatty acid extract
Table 3. Analytical test report of fatty acids composition of sample obtained by GC-MS
The best criterion for assessing the relative nutritional benefits of fish oils from various species has been proposed to be the n-3/n-6 ratio; earlier research has showed that the n-3/n-6 PUFA ratio varied from 1 to 4 for freshwater fish species. The n-3/n-6 ratio for catfish in this study was evaluated as 1.325–2.567 based on earlier research, which found that it ranged from 1.15 to 3.71 (Z. J. C. Maron et al., Citation2016). The range (0.44–1.00) of the fish species’ PUFA/SFA ratios was studied. The Cat fish species are a good source of PUFA, particularly ALA, EPA, and DHA, making them suitable for addition in highly unsaturated low-fat diets based on the ratio of previous work from (Chandra Shahi et al., Citation2017; Pravinkumar et al., Citation2014). A minimum value of PUFA/SFA ratio recommended is 0.45, which was lower than those obtained from freshwater fish species investigated in the present work (0.389–0.476). Saturated, monounsaturated, and polyunsaturated fatty acids are all thought to be present in catfish oil, per the research.
5.1. FTIR analysis
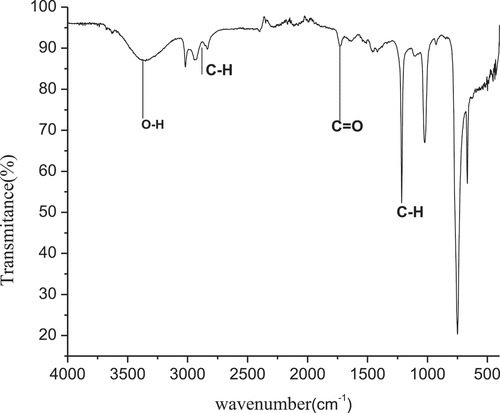
FT-IR spectroscopy was used to identify the functional groups of many compounds in the plant. Figure depicts the results of an FT-IR study of omega 3 fatty acid extracted from Fish oil. The results were interpreted based on the appearance of various bands on the FT-IR spectra that corresponded to specific types of functional groups. The discovered individual bands were assigned to a single functional category based on their wave numbers. This spectrum can be split into five sections for simpler reading. There are five parts of the mid-infrared light spectrum (4000–400 cm−1). The five spectra had absorption bands at 3468.01 cm−1, 3005.95 cm−1, 3005.95 cm−1 and 1375 cm−1 respectively which show that fatty acid has an OH, C-H symmetric bending, and unsaturated alkene functional group. Free hydroxyl group of fish oil was observed in wavenumber at 3468.01 cm−1. While OH bonding in the carboxylic groups found at wavenumber of 3005.95 cm−1. These data show a widened C-H Vibration From CH2 and -CH3 groups and also one small absorption band at wavelength of 3005.95 cm−1 for unsaturated alkene(-CH=CH-) (H. Zhao et al., Citation2018, Lucia Viana Do Nascimentd1, Citation2015) and (Rehana Saeed, Citation2014).
Figure 5. FT-IR spectra omega 3 fatty acid extracted from Fish oil.
6. Conclusions
The secondary fatty acid extract of fish oil contained significant levels of oleic acid and unsaturated Omega-3 fatty acids, according to the results of the fatty acid analysis. Individual fatty acids present in the sample were identified and quantified using the GC-MS technique, while the functional makeup of two classes of fatty acids (unsaturated as a whole, of which ω −3 and DHA individually are, and saturated) was assessed based on FTIR. High quantities of unsaturated fatty acids and low levels of saturated fatty acids imply low cholesterol among the oils and fatty acids, making them suitable for use as food additives and in food preparation to lower the risk of heart illnesses. It may be said that cat fish oil, with its high concentration of EPA and DHA, has the potential to be employed as a regional source of PUFA. By taking into account the temperature, extraction duration, and solvent ratio for cost evaluation, the ideal circumstances (an extraction temperature of 60 °C, an extraction time of 90 min, and a solvent ratio (Methanol: Chloroform) of 2:1 v/v percent) were employed for fish oil extractions. The catfish n-3/n-6 ratio in this study was graded as 1.325–2.567. The range (0.44–1.00) of the fish species’ PUFA/SFA ratios was studied. The examined fish oil is more suitable for nutritional uses, especially in reducing the risk of CHD, because it contains higher levels of unsaturated fatty acids than saturated fatty acids.
Ethical approval
Human/animal testing is unnecessary in this study. Human subject is not involved in this study. Patients are also not involved in this study.
Correction
This article has been corrected with minor changes. These changes do not impact the academic content of the article.
Acknowledgments
The authors appreciate the laboratory facilities and financial support provided by Arba Minch University, College of Natural Science’s, Department of Chemistry.
Disclosure statement
No potential conflict of interest was reported by the authors.
Additional information
Notes on contributors
Birhanu Zeleke Tilinti
Birhanu Zeleke Tilinti is Senior Lecturer in Food Science and Technology at Arba Minch University
Tewodros Birhanu Ayichiluhim
Tewodros Birhanu Ayichiluhim is Senior Assistant Professor in Industrial Chemistry at Arba Minch University
Alemu Mekonnen Tura
Alemu Mekonnen Tura is Senior Assistant Professor in Physical Chemistry at Arba Minch University
Ramesh Duraisamy
Ramesh Duraisamy is Senior Asscociate Professor in Industrial Chemistry at Arba MInch University
References
- Ahmed, M., Liaquat, M., Shah, A. S., Abdel-Farid, I. B., & Jahangir, M. (2020). Proximate composition and fatty acid profiles of selected fish species from Pakistan. The Journal of Animal & Plant Sciences, 30(4), 869–20.
- Aitta, E., Marsol-Vall, A., Damerau, A., & Yang, B. (2021). Annelie Damerau, Enzyme-assisted extraction of fish oil from whole fish and by-products of baltic herring (Clupea harengus membras. Journal Foods, 10(8), 1811. https://doi.org/10.3390/foods10081811
- Amuamuta, A., Mekonnen, Z., & Agazie, A. (2014). Extraction and analysis of oil/fat and fatty acids content from different Indigenous Fish of Lake Tana Source, Northwest Ethiopia. World Journal of Fish & Marine Sciences, 6, 417–423.
- Atinafu, D. G., & Bedemo, B. (2011). Estimation of total free fatty acid and cholesterol content in some commercial edible oils in Ethiopia. Journal of Cereals and Oil Seeds, 2(6), 71–76. https://doi.org/10.5897/JCO11.025
- Bako, T. (2017). Victor Imolemhe Umogbai, John Okanagba Awulu, Criteria for the extraction of fish oil. Journal of Agricultural and Environmental Engineering, 19, 120–132.
- B, T. D., Ndamitso, M. M., & Ajai, A. I. (2018). Determination of physicochemical properties and fatty acid profile of oil extract of blighiasapida fruit from selected areas in niger state, Nigeria. Nigerian Journal of Chemical Research, 23, 1119–1222.
- Bura Mohanarangan, A. (2012). Extraction of Omega-3 Fatty Acids from Atlantic Herring (Clupea Harengus). Department of Process Engineering and Applied Science Unpublished.
- Chandra Shahi, N., Goutam, S., Thakur, R., Singh, A., & Lohani, U. (2017). Rajeev Ranjan Thakur, Anupama Singh and Umesh Chandra Lohani effect of process parameters on oil yield in process optimization for extraction of essential fatty acid from fish using solvent extraction. Current Journal of Applied Science and Technology, 25(3), 1–12
- C, O. E., & I, O. S. (2016). Determination of the proximate composition, physicochemical analysis and characterization of fatty acid on the seed and oil of gossypium hirsutum. International Journal of Chemistry, 8(3), 1916–9701. https://doi.org/10.5539/ijc.v8n3p57
- Dagnachew, Y., Asteraye, Y., & Mensigitu, T. (2015). Mathewos Anza extraction and physico-chemical characterization of Cordia Africana Lam Seed Oil. Journal of Advanced Botany and Zoology, 3, 2348–7313.
- Gupta, A., Isolation and characterization of omega-3 fatty acids producing marine microbes Submitted in fulfillment of the requirements, B.E, M.Tech Deakin university thesis summited; 2014.
- Huang, J., Fangyun, L., Yujie, W., Wang, D., Weimin, X., Zou, Y., & Sun, W. (2021). Enzymatic extraction and functional properties of phosphatidylcholine from chicken liver. The Journal of Agricultural Science, 101(6), 101689. https://doi.org/10.1016/j.psj.2021.101689
- Ibrahim, N. I., Hamzah, Y. J., Yin, Z., & Sohaimi, K. S. A. (2020). Extraction of Omega-3 Fatty Acid from Jade Perch (Scortum barcoo) Using Enzymatic Hydrolysis Technique. Indonesian Journal of Chemistry, 20(2), 282–291. https://doi.org/10.22146/ijc.40903
- Innes, J. K., & Calder, P. C. (2020). Marine Omega-3 (N-3) Fatty Acids for Cardiovascular Health. International Journal of Molecular Sciences, 21(4), 1362. https://doi.org/10.3390/ijms21041362
- Khalili Tilamiaand Sabine Samples, S., & Sampels, S. (2018). Nutritional value of fish: Lipids, Proteins, Vitamins, and Minerals. Reviews in Fisheries Science & Aquaculture, 26(2), 2–5. https://doi.org/10.1080/23308249.2017.1399104
- KO, O., Iroha, O. K., Edeke, A. A., Omeje, H. C., & Apeh. (2019). Characterization and fatty acid profile analysis of oil extracted from unexploited seed of African star apple (Udara). Journal of Edition Diffusion Presses Sciences, 26, 10. https://doi.org/10.1051/ocl/2019007
- Liguori, A., Lucia Belsito, E., Luisa Di Gioia, M., AntonellaLeggio, F. M., EmanuelaRomio, C. S., Tagarelli, A., Siciliano, C., & Tagarelli, A. (2020). GC/MS Analysis of Fatty Acids in Italian Dry Fermented Sausages. The Open Food Science Journal, 12(1), 5–13. https://doi.org/10.2174/1874256401509010005
- Lucia Viana Do Nascimentd1, V. (2015). Victoria Maura Silva Bermudez, Andre Luis Lima De Dliveira, characterization of hydrolyzed oil obtained from fish waste for nutraceutical application. Journal of Food Science Technology, 35(2), 321–325. https://doi.org/10.1590/1678-457x.6583
- M, A., A, K. M., Abdullahi, N., A, K. I., I, I. S., Y, M. Y., & Extraction, A. I. A. (2017). Characterization and fatty acids profiles of nymphaea lotus and nymphaea pubescens seed oils. Biosciences, Biotechnology Research Asia, 14(4). https://doi.org/10.13005/bbra/2573
- Manning, L., & Manning, L. (2014). Developing systems to control food adulteration. Elsevier Editorial System(tm) for Food Policy, 49(1), 23–32. https://doi.org/10.1016/j.foodpol.2014.06.005
- Maron, J. C., Pacs, M., & Bost, J. (2016). Uses Omega-3 for Optimal Life. Why You Need Fish Oil.
- Maron, Z. J. C., Pacs, M., & Bost, J. (2016). Uses Omega-3 for Optimal Life. Why You Need Fish Oil.
- Morris, D. H. (2019). Examining omega-3 nutrition. Handbook of Flax Council of Canada, 4, 465–467.
- Ndidiamaka, N. C., & Emmanuel Ifeanyi, O. (2018). Proximate and physicochemical analysis of oil obtained from two fish species (fresh and frozen. International Journal of Advanced Research in Biological Sciences, 5, 2348–8069.
- NO Halisdemir University. (2019). Faculty of agricultural sciences and technologies, Nigde, Turkey, Omega-3 fatty acids and health benefits. European Journal of Food Science and Technology.
- O S I Okafor, E. C., & C, O. E. (2016). Determination of the Proximate composition, physicochemical analysis and characterization of fatty acid on the seed and oil of gossypium hirsutum. International Journal of Chemistry, 8(3), 1916–1970
- Pravinkumar, M., Xavier Eugien, L., Viswanathan, C., & Raffi, S. M. (2014). Extraction, purification and evaluation of fatty acid composition fish oil from sardinella longiceps of Muttom Coastal waters. International Journal of Pharmaceutical & Biological Archives, 5, 102.
- Purnamayati, L., & Dewi, E. N. (2019, March). Physical blending characteristic of fish oil and sesame oil. In IOP Conference Series: Earth and Environmental Science (Vol. 246, No. (1), p. 012054). IOP Publishing.
- Rasel Molla, A. K. M. A., & Abdur Rashid Mia, M. (2016). Nutritional status, characterization and fatty acid composition of oil and lecithin isolated from fresh water fish shoul (Channa striata). International Journal of Nutrition and Food Sciences, 5(1), 9–15. https://doi.org/10.11648/j.ijnfs.20160501.12
- Rehana Saeed, E. Z. (2014). Mehwish Abdul Hameed, Quality by Fourier Transform-Infrared (FT-IR) SpectroscopyAnjum yousuf, study of physicochemical properties of edible oil and evaluation of frying oil. Arabian Journal of Chemistry, 1321(10), S3870–S3876.
- Rincon-Cervera, M. A., GonzAlez-Barrig, V., Romero, J., Rojas, R., & Lopez-Arana, S. (2020). Quantification and distribution of omega-3 fatty acids in south pacific fish and shellfish species. Journal of Foods, 9(2), 233. https://doi.org/10.3390/foods9020233
- Rocio Bonilla-Mindez, J., & Luis Hoyos-Concha, J. (2018). Methods of extraction, refining and concentration of fish oil as a source of omega-3 fatty acids. Corpoica Science Technology Agropecuaria, Mosquera (Colombia), 19(3), 645–668.
- Ryan, T., Peters, M., Yadav, G., Fabiano, L. A., Warren, D., & Seider, W. D. (2020, October). Seider Omega-3 fatty acids from algae produced biodiesel, Algal Research. Algal Research, 51( Volume 51), 102047. https://doi.org/10.1016/j.algal.2020.102047
- Saganuwan, A., Saganuwan, S. A. (2017). Synthesis of central nervous system (CNS) acting drugs, central nervous system agents in medicinal chemistry, 17(2), 135–140.
- Shahidi, F., & Ambigaipalan, P. (2018). Annual Review of Food Science and Technology Omega-3 Polyunsaturated Fatty Acids and Their Health Benefits. Annual Review of Food Science and Technology, 9(1), 16–17. https://doi.org/10.1146/annurev-food-111317-095850
- Sierra Lopera, M., Tatiana Sepulveda Rincon, C., Vasquez Mazo, P., Alfredo Figueroa Moreno, O., & Edgar Zapata Montoya, J. (2018). Byproducts of aquaculture processes: Development and prospective uses. review. By Products of Aquaculture Processes, 25(3), 128–140. https://doi.org/10.17533/udea.vitae.v25n3a03
- Singh, S., Lohani, U. C., Thakur, R., Singh, A., & Lohani, U. (2017). Effect of process parameters on oil yield in process optimization for extraction of essential fatty acid from fish Using Solvent Extraction. Current Journal of Applied Science and Technology, 25(3), 1–12. https://doi.org/10.9734/CJAST/2017/38391
- Sumardiantob, L. P., Romadhon and Dewi, E. N., Physical blending characteristic of fish oil and sesame oil, Conference Series: Earth and Environmental Science, 246, 2019.
- Yenenesh, A., Negissie, R., Gulelat, D., & Ali, M. (2016). Nutritional and Phytochemical Evaluation of Anchote(Coccinia abyssinica)(Lam.)(Cogn.) Accessions to Promote its Contribution for Food Security and Medicinal Use. A PhD dissertation, Addis Ababa University,
- YF Lamayi, D., Sadiq, B., & Usman, Y. (2013). M Proximate and Some Mineral Analysis of Pumpkin (Cucurbitamaxima). Journal of Medical and Biological Sciences, 3(2), 8–14.
- Zhao, H., Zhang, Y., Shen, Y., Su, H., Jin, J., Jin, Q., & Wang, X. (2018). Characterization of positional distribution of fatty acids and triacylglycerol molecular compositions of marine fish oils rich in omega-3 polyu12nsaturated fatty acids Huijun Zhang. Journal of Biomedical Research International, 2018, 18–21
- Zhao, Y., Zhang, H., YingbinShen, H. S., Jin, J., Jin, Q., Wang, X., Jin, Q., & Wang, X. (2018). Characterization of positional distribution of fatty acids and triacylglycerol molecular compositions of marine fish oils rich in omega-3 polyu12nsaturated fatty acids Huijun Zhang. Journal of Biomedical Research International, 2018, 18–21. https://doi.org/10.1155/2018/3529682