
 ?Mathematical formulae have been encoded as MathML and are displayed in this HTML version using MathJax in order to improve their display. Uncheck the box to turn MathJax off. This feature requires Javascript. Click on a formula to zoom.
Abstract
The social dependence on the soil to guarantee its fertility and ensure food security have generated poor management practices globally. Nevertheless, the soil is considered a fundamental factor in the transition towards a sustainable bioeconomy because of its societal importance due to the biomass source to produce value-added products. Soil thermal properties are critical factors because of the microclimate, so fertility and soil chemistry are controlled by the heat exchange between the soil and the surrounding; therefore, knowledge of these parameters is essential to crop planning better. Access to advanced techniques to monitor the growth and quality of crops in rural areas of the Latin American region is scarce. Several characterization techniques have been used to get soil thermal properties but are needed to provide open access to these techniques and obtain higher-resolution data. This study employs the so-called Hot Ball method to obtain thermal conductivity. The effect of particle size, thermal stability, and mineralogical composition on thermal conductivity is studied. Also, soil structure and electrical conductivity are studied. This study is expected to be a tool for making strategic decisions that lead to better planning of crops in the bioeconomy context.
1. Introduction
Soil is an essential component of the planet. Its role is vital for crop production, climate change control, regulating other ecosystem services, and supporting life on Earth (Helming et al., Citation2018). According to the Food and Agricultural Organization of the United Nations (FAO), “Land and soils constitute the foundation for sustainable agricultural development, essential ecosystem functions, and food security (FAO, Citation2023).” They are crucial to sustaining life on Earth. The soil functions include a medium for plant growth, a regulator of water supplies, a recycler of raw materials, a habitat for soil organisms, and a landscaping and engineering medium (Vogel et al., Citation2019). However, the soil security concept is needed to understand the critical role of soil in society. Soil security is anchored by food security, water security, energy security, climate change abatement, biodiversity protection, and ecosystem service (McBratney et al., Citation2014). McBratney and coworkers define soil security through seven functions: biomass production, storing, filtering, and transforming nutrients, substances, and water, biodiversity pool, physical and cultural environment, and source of raw materials, acting as a carbon pool archive of geological and cultural heritage. More recently, the soil is considered a fundamental factor in the transition towards a sustainable bioeconomy (Juerges & Hansjürgens, Citation2018) because fertile soil’s societal dependence guarantees food security and biomass to produce value-added products (Marín-Valencia et al., Citation2021). Due to soil’s strategic importance, there is a need to develop tools to help us understand its properties more in-depth.
In this sense, density, texture, hydraulic conductivity, organic matter content, cation exchange capacity, pH, electrical conductivity, and mineralogical features are the physicochemical properties traditionally measured (Weil & Brady, Citation2016). Besides its importance, less attention is paid to the soil’s thermal properties, like thermal conductivity. This thermophysical property is critical in several applications, such as geotechnical engineering. Heat transfer efficiency affects the efficiency of energy geostructures (X. R. Zhang et al., Citation2020); the knowledge of thermal properties reduces construction costs (Cao et al., Citation2018; Webb, Citation1956).
The exogenous climate conditions control the microclimate, infrared radiation due to greenhouse gases, precipitations (Harte et al., Citation1995; van Wijk, Citation1965), and the heat exchange capacity between the soil and surrounding air; therefore, the knowledge of this interaction plays a crucial role in agronomics and food security (Hernández & Pastor Piñeiro, Citation2008) or climate change control. The ability of soil to conduct heat determines how fast its temperature changes during the day. Therefore, temperature is the critical factor that affects the rate of the chemical and biological processes in the soil (Sauer & Horton, Citation2005).
Thermal diffusivity (α) and thermal conductivity (κ) are thermophysical properties widely used in materials science, energy, chemical industry, and soil studies (Ren et al., Citation2019). Thermal conductivity is a crucial parameter to characterize heat transport (Li et al., Citation2019); therefore, knowledge of thermal conductivity is necessary for modeling heat behavior. The thermal conductivity of soil is a fundamental physical property related to heat conduction. Several methods are used to study soil thermal conductivity (Li et al., Citation2019; N. Zhang & Wang, Citation2017; Oladunjoye & Sanuade, Citation2012; Shiozawa & Campbell, Citation1990); most of those methods are based on continuous heat transmission; even though transient methods have proven suitable for getting thermal conductivity in porous materials provided the right experimental conditions (Glorieux et al., Citation2017; Hudec et al., Citation2015). In previous work, the Hot Ball technique was used to measure thermal conductivity in sugarcane soil, and it was demonstrated that it is possible to correlate the thermal conductivity with the soil quality index (Flores Cuautle et al., Citation2019).
The Hot Ball (HB) technique is a transient method used for getting thermal conductivity and has been described elsewhere (Fidríková & Kubičár, Citation2012; Glorieux et al., Citation2017; Hudec et al., Citation2016; Kubicar, Citation1990). The working model assumes the Hot Ball sensor as a punctual heat source that releases heat as a step function producing a continuous heat flux at the ball surface and evaluated at the long-time limit. The sample surrounds the Hot Ball sensor, and when the sample is considered infinite, the boundary temperature at the heat source and sample interface is described by Equationequation 1(1)
(1) :
With κ being the sample thermal conductivity and α thermal diffusivity, Q the released heat, r the sensor radius, and erfc (x) the complementary error function. As shown by Equationequation 1(1)
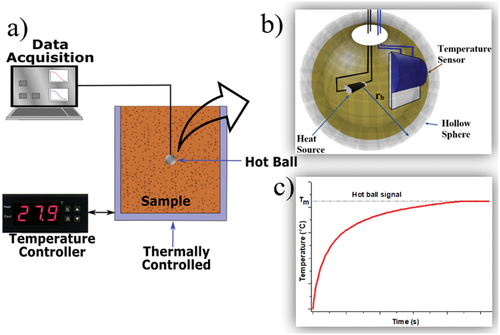
(1) , the thermal conductivity and diffusivity can be extracted from the same experimental configuration, provided the ball radius and released heat are known. Figure shows a sensor working model scheme and the experimental arrangement for a typical temperature-dependent measurement. Hot Ball is chosen to obtain the thermal conductivity because its measurement lasts seconds to give accurate results comparable to traditional methods even for low thermal conductivity samples (Glorieux et al., Citation2017). In this work, Hot Ball is used to obtain thermal conductivity values. Also, soil components with different particle sizes were studied. This study is expected to gain a deeper understanding of the effect of soil temperature changes on thermal conductivity.
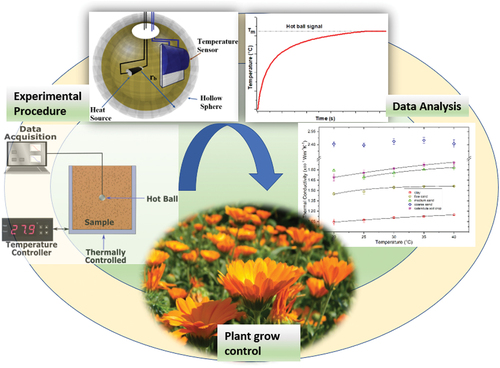
Figure 1. a) Experimental setup, b) Scheme of the Hot Ball sensor, c) Example of the temperature response for constant heat in water being Tm the steady-state temperature.
2. Materials and methods
2.1. Samples
Soil samples were collected at N 5° 41’ 48.3“W 73° 45’ 30.6” and stored in plastic bags according to the United State Department of Agriculture (USDA) recommendation (USDA, Citation1999). Samples were sieved and classified into fine (500 μm), medium (0.595 mm), coarse sands(1.190 mm), and clay(less than 75 μm); additionally, because calendula harvesting is a preponderant activity at the samples collecting area soil from calendula crops was also studied. Before characterization, soil samples were dried at 60°C for 24 h to release the surface humidity.
3. Characterization
3.1. Thermal conductivity measurements
The thermal conductivity was obtained using the HB technique; the HB sensor was built using a platinum thermistor as the temperature sensor, a 1 mm metallic resistor as the heat source, and a 3 mm diameter hollow copper ball, Figure a). The heat was obtained by applying a current through the metallic resistor, and the thermistor resistance was monitored every 300 ms to obtain the HB temperature. To consider the uncertainty provoked by the sensor construction, effective released heat and ball radius are employed in calculations; those effective parameters were obtained in advance by sensor calibration using samples with known thermal conductivity and diffusivity. Because Equationequation 1(1)
(1) requires the ball to have zero heat capacity and no thermal resistance between the sensor and the sample affecting mainly thermal diffusivity values, calculations were carried out at the temperature stabilization times (Kouyaté et al., Citation2015). Therefore, the thermal diffusivity values are discarded, and only thermal conductivity values are presented here.
The Hot Ball sensor was placed in the central part of the sample, and samples were compacted around the sensor to achieve good thermal contact between the sample and the sensor. Furthermore, a thin thermal grease layer lowers the thermal resistance between the sample and the sensor. The sample-sensor set is placed into a temperature-controlled chamber (70 cm3 volume). Samples under study are set at the desired temperature with a temperature variation lower than 0.1 °C; afterward, constant heat is supplied through the sensor while the sample-sensor interface temperature is monitored. Solar radiation can raise the soil surface temperature; temperature influences soil processes such as organic matter decomposition, nutrient availability, moisture, aeration, structure, microbial and enzyme activities, and other soil chemical reactions (Onwuka & Mang, Citation2018). Therefore, samples were analyzed between 20 °C and 40 °C.
3.2. Thermogravimetric analysis
The thermal stability of the samples is studied by thermogravimetric analysis (TGA) on a TA instrument, model TGA Q500 thermogravimetric analyzer (TA Instrument, Delaware, DE, USA). Measurements were made on 10.0 mg of sample, using a high-resolution algorithm (sensitivity: 1, resolution: 5) with N2 flow (100 mL min−1) at a heating rate of 10 °C min−1. The measurement range is from 21 to 800 °C.
3.3. Structural characterization by XRD
The X-Ray Diffraction (XRD) patterns of the powder samples are performed at room temperature with a Bragg–Brentano focusing geometry in a RIGAKU MINIFLEX II diffractometer (Rigaku Company, Tokyo Japan), using CuKα radiation at 30 kV and 15 mA with a scan rate of 2° min−1, range between 3 to 70° 2θ. Polyhedral representation is drawn in Vesta Software (Momma & Izumi, Citation2011) from the CIF data obtained from the Crystallography Open Data Base.
3.4. Electrical properties
Electrical conductivity experiments are performed over powder soil fraction samples kept between two brass electrodes under spring-loaded pressure; the effective diameter for the working electrode is 10 mm [5]. Samples are measured at room temperature (25 °C) using a dielectric interface SOLARTRON 1296 coupled to SOLARTRON 1260 analyzer (Solartron Analytical, Farnborough, UK). Data are recorded in a frequency range of 10 MHz to 0.1 Hz with a 100-mV voltage amplitude. The electrical conductivity can be extracted from the impedance EquationEquation (2)(2)
(2) .
where Z´ and Z´´ are the real and imaginary components of the complex impedance, respectively, d is the electrodes distance and A the electrode diameter.
4. Results and discussion
4.1. Thermal conductivity
Figure shows a representative plotting of the Hot Ball signals at 20 °C for each studied soil; the solid line best fits EquationEquation 1(1)
(1) to the experimental data using the thermal conductivity as a fitting parameter.
Figure 2. HB signals for all samples, symbols are experimental data (squares: clay mineral, circles: fine sand, triangle: medium sand, rhombi: gross sand, stars: calendula soil), and the solid line is the best fitting of Equationequation 1(1)
(1) to each data set.
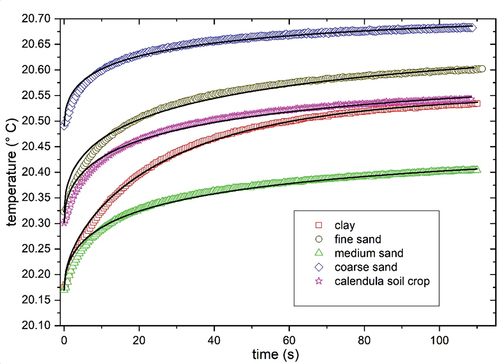
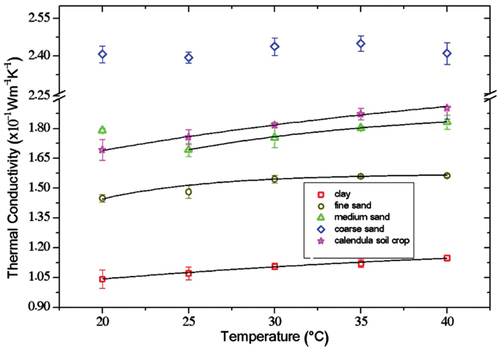
Figure shows the studied samples’ thermal conductivity results as temperature functions. Coarse sand presents the highest thermal conductivity; clay mineral shows the lowest thermal conductivity. There is an increased thermal conductivity as the temperature was raised, except for coarse sand.
Figure 3. Thermal conductivity of studied samples as a function of temperature, solid lines represent the proposed fitting according to equation. 3.
Thermal conductivity values were modeled as a temperature function using an exponential Equationequation (3)(3)
(3) .
Where κ0, F, and G are the constant characteristics of the sample, while T represents temperature in Celsius, the constants obtained from EquationEquation 3(3)
(3) are shown in Table . R2 is the correlation coefficient between the proposed Equation and the experimental data. The difference in the thermal conductivity between the studied samples is associated with the particle size, amount of water in the structure, and mineral composition, as discussed in the following sections. For the case of coarse sand the data does not show any trend therefore it is not fitting line presented.
Table 1. Fitting results for the studied samples
4.2. Thermogravimetric analysis
Thermograms for the studied samples are shown in Figure , and the first derivate of mass loss is shown in Figure . Table compiles the mass losses determined from TGA profiles for different temperature ranges. For mass loss interpretation, the data were grouped into seven regions as follows from room temperature to 100 °C (Region I), 100–200 °C (Region II), 200–300 °C (Region III), 300–400 °C (Region IV), 400–500 °C (Region V), 500–600 °C (Region VI), and higher than 600 °C (Region VII).
Figure 4. Thermogravimetric Analysis. (a) Thermograms, (b) Differential thermal gravimetric analysis, the insert in (a) represents an increase in mass loss scale.
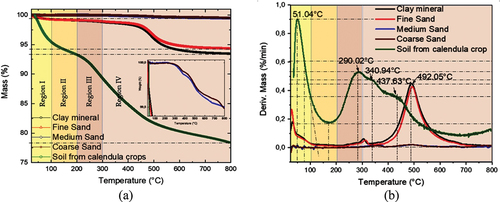
Table 2. Mass losses for the studied samples
Calendula soil crops lose more mass than the other analyzed samples (Figure ), clay mineral and fine sand show almost the same thermal behavior as medium and coarse sand in all temperature ranges studied. As can be seen, the calendula soil crops lose 21.6% of their initial mass. The total mass loss followed the order calendula soil crop>clay mineral> fine sand> coarse sand> medium sand.
The first thermal event succeeded at around 50°C (Figure ) for calendula soil. Below 50 °C, there is a maximum in DTG for the other studied samples. This mass loss is assigned to the release of physisorbed water or dehydration reaction due to the weak water—surface site interaction (Kristl et al., Citation2016). Calendula soil crops present a maximum in DTG At 290.02 °C. Clay minerals and fine sand exhibit a displacement of 15 and 20 °C higher; meanwhile, it is 75 and 69.15 °C higher for medium and coarse sand, as observed in Figure . Mass loss in this temperature range (Region III) can be associated with the surface dehydroxylation of inorganic oxides and interlayer water release from the clay mineral (Kristl et al., Citation2016).
Until 300 °C, the mass loss for the calendula soil sample is 10.70 %w, and at 340.94 °C, the calendula soil crops lose 4.46 %; the maxima in DTG at this temperature is absent for clay fraction, fine, medium, and coarse sand. The literature reports the decomposition of labile and straightforward organic structures as carboxylic, methylene, alcoholic, aldehydes, amides, amines, phenol groups, polysaccharides, and biodegradable compounds soils around 220–430 °C (Boguta et al., Citation2017). The combustion of carbohydrates and other aliphatic compounds occurs within the 200–320 °C range.
The primary mass loss for fine sand and clay mineral samples is around 300 °C; meanwhile, it is 50 °C higher for medium and coarse sand. This mass loss resulted from water loss from the particle surface and interlayer water in the clayed sample (Grekov et al., Citation2019).
Additionally, compared to calendula soil crops with the studied samples, there is a temperature displacement for the thermal event at 437.63 °C, around 54.42 °C. Between 300 °C and 500 °C, the mass loss for calendula soil crops is 7.6 %. This mass loss in this temperature range is associated with the decomposition of organic matter and nitrogen-associated compounds and the thermal degradation of more stable aromatic compounds at 330–530 °C (Kristl et al., Citation2016). Conversely, the inorganic matrix’s oxygen losses and OH—occur at temperatures higher than 500 °C (Ndzana et al., Citation2019), especially for clay minerals.
The mass losses around 492 °C for clay, fine, medium, and coarse sand is associated with the quartz β-α polymorph transition (Grekov et al., Citation2019). Above 500 °C, mass losses are attributed to the dehydroxylation from the lattice (Ndzana et al., Citation2019).
4.3. Structural analysis
XRD method was used to elucidate the crystallographic components of the analyzed samples. The XRD patterns for clay minerals and the different sands are shown in Figure . For clay minerals and fine sand, the diffraction reflection indicates the presence of kaolinite (ICDD 00-001-0527, ICDD 00-005-0490), illite (ICDD 00-002-0462), and halloysite (ICDD 00-003-0184).
Figure 5. XRD patterns for (a) Soil for calendula crop, (b) clay mineral, (c) fine sand, (d) medium sand, (e) coarse sand.
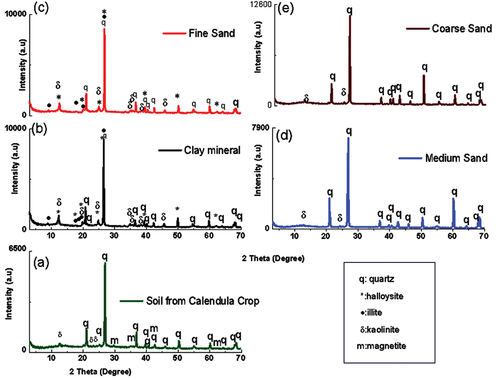
Quartz (ICDD 00-005-0490; ICDD 00-003-0444) and kaolinite (ICDD 00-001-0527) are minor materials for medium and coarse sand. For calendula soil diffraction reflection is found at 12.64°, 20.12°, 21.06°, 23.48°, 24.42°, 25.24°, 26.92°, 29.72°, 35.20°, 36.90°, 39.76°, 40.54°, 42.70°, 45.98°,48.78°, 50.40°, 55.06°, 60.20°, 62.52°,64.28°, 68.08°, 68.44° 2θ. They were characteristics of quartz (ICDD 00-003-0444), kaolinite (ICDD 00-001-0527 and magnetite (ICDD 00-002-1035).
From the structural perspective, thermal conductivity is expected to change with the mineralogical composition. As XRD (Figure ) described, quartz is the only mineralogical phase found in coarse and medium sand. There is a mix of mineral phases for clay minerals and fine sand-like halloysite, kaolinite, and illite minerals. Additionally, there is a presence of low quantities of magnetite in calendula soil. Figure shows the polyhedral representation of the minerals found in the calendula soil, clay mineral, and sands. A brief description of the mineral structures is presented below.
Figure 6. Polyhedral representation of the minerals found in the studied samples. (a) Quartz. (b) Halloysite. (c) Illite. (d) Kaolinite. (e) Magnetite. Red circles: O, light blue polyhedral: Al3+, blue polyhedral: Si+4, brown polyhedral: Fe+2 and Fe+3, violet circles: Mg+2, Fe+2, and pink circles: OH−. Al+3 is in octahedral coordination, Si+4 is in tetrahedral coordination, Fe+2 is in tetrahedral coordination, and Fe+3 is in octahedral coordination.
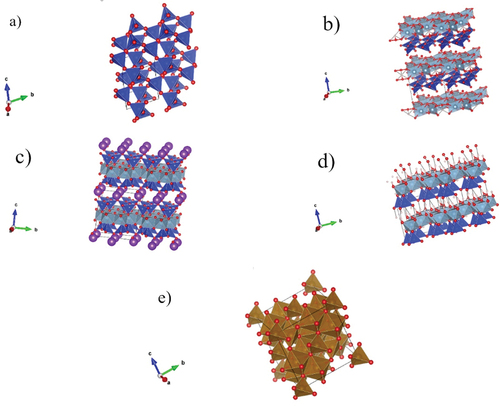
Halloysite, kaolinite, and illite belong to the phyllosilicate family. They are layered minerals comprised of Al3+ in octahedral coordination and Si4+ in tetrahedral coordination, forming octahedral and tetrahedral sheets. Depending on the octahedral and tetrahedral sheet quantity, clay minerals can be classified as 1:1 (1 octahedral sheet: 1 tetrahedral sheet), 2:1 (2 octahedral sheets: 1 tetrahedral sheet). Halloysite and kaolinite are 1:1 clay minerals, but illite is a non-expandable 2:1 clay mineral. Particularly, halloysite has a nanotube structure (Andrini et al., Citation2019), kaolinite has roughly hexagonal platy crystals (S. Zhang et al., Citation2017), and illite has a flake-ribbon morphology (Keller et al., Citation1986). A general description of their chemical composition is shown in Table .
Table 3. General description for kaolinite, halloysite, and illite
Literature reports small quantities of water in illite interlayer space (Gualtieri et al., Citation2008). For kaolinite, four dioctahedral sheets are occupied by Al3+ cations, and two are vacant. The negative charge of the oxygen anion framework is balanced by the tetrahedral and octahedral cations (Meunier, Citation2005).
Quartz comprises building blocks of SiO2 in which each Si+4 atom is surrounded by four O2– forming tetrahedral coordination (Huggins, Citation1922). On the other hand, Magnetite (Fe3O4) is an inverse spinel material, containing 32 O2– anions and 24 mixed-valence Fe cations, one half of the Fe+3 occupies 8 of the 64 available tetrahedral interstices, and the other half of Fe+3 together with an equal amount of Fe+2 ions, occupy 16 of the 32 available octahedral interstices (Kozlenko et al., Citation2019; Mariotto et al., Citation2002).
4.4. Effect of water and particle size over thermal conductivity
As can be seen (Figure ) from the structural point of view, clay minerals are complex structures. In silicates and oxides, the heat transfer is dominated by phonons (Höfer & R, Citation2002). The presence of clayed materials decreases thermal conductivity due to phonon scattering because of their crystal and structural anisotropy, defects at grain boundaries, and stacking faults (Gavrenko et al., Citation1995; Hartmut, Citation2001; Jorand et al., Citation2013). Also, the different exchange ions, porosities, and water contents affect thermal conductivity in clay minerals.
Therefore, the heat conduction in clay minerals is favored at low porosities and water contents due to more particle-particle contact. Thermal conductivity in soils is governed mainly by quartz (Różański & Stefaniuk, Citation2016) due to less structural anisotropy than clay minerals (Figure ), and the contact between particles of the same nature favored heat transport, as evidenced in Figure .
Thermal conductivity obtained at 25 °C is plotted as shown in Figure , and a linear fitting is performed to evaluate if the water amount affected thermal conductivity. The following Equation is found , with the Pearson coefficient of −0.88 and R2 0.77. It indicates the inverse correlation between both parameters. Water content also plays an essential role in thermophysical properties, particularly in heat capacity; Hinkel and coworkers indicated that higher moisture increases heat capacity and vice versa (Hinkel et al., Citation2001). Work performed by Zhu and collaborators found that the soil has a lower thermal diffusivity with more organic materials in the soil. On the other hand, Zhao (Zhao & Si, Citation2019) and Tarnawski (Tarnawski & Leong, Citation2012) independently found a decrease in thermal conductivity with the increase of organic matter in soils, similar to the behavior presented in our work, as can be seen in Figure . In general, the thermal conductivity of minerals is about eight times higher than organic soils (Tarnawski & Leong, Citation2012).
Figure 7. Effect of water in thermal conductivity at room temperature for soil, clay mineral, and sands. The insert shows the fitting of the experimental data in the strong water-inorganic matrix interaction zone.
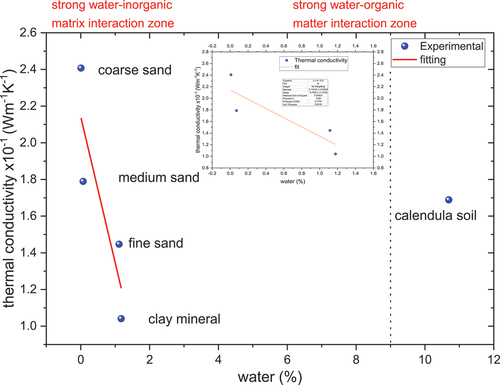
In particulate materials, as in soils, water can be adsorbed on the particle surface (bound water) or between the pores (micro—meso or macropores) as capillary water (Revil & Lu, Citation2013). The surface energy to attract water molecules is less on the surface than in the pores. Also, water stored in the smallest pores requires more energy to move or release from the material and is affected by the ions that conform to the mineral structure (Hinkel et al., Citation2001). On the other hand, gradients provide the driving force for moisture movement (Chang & Weng, Citation2002). Thus, the remaining water stored in clay minerals requires more energy to release from the solid.
Revil and Lu (Revil & Lu, Citation2013) indicate that water and mineral interaction can be divided into the saturation regime and below saturation. In the last regime, the interaction between water molecules and the mineral surface is affected by the film flow from residual non-bound water. Zhou et al. report that the heat flow in soils mainly goes through connected aggregates (Zhou et al., Citation2019). On the other hand, the quantity of phonons is highest in the wet phase, reducing the heat transfer efficiency because of the increase of the scattering events and reducing the mean free path (Xiong & Zhang, Citation2019). According to TGA results (Figure ), the water content in clay was higher than in coarse sand. The results suggest that in medium and coarse sand, the heat mechanism transfer is mainly due to particle-particle interaction.
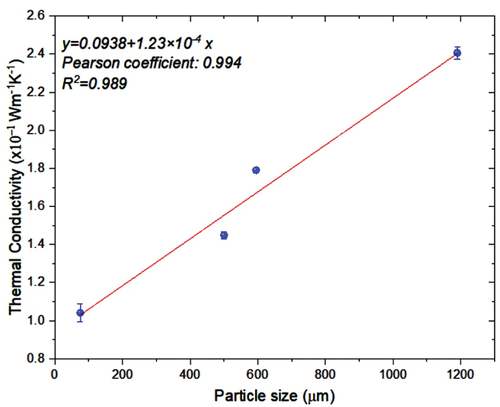
Conversely, the particle size effect on thermal conductivity is shown in Figure . There was an increase in thermal conductivity as the particle size increased. We believe that the air content per surface area increases as particle size increases, favoring heat transfer. However, factors such as porosity, grain shape, and type of contact between the particles should be analyzed. Heat transfer performance is significantly enhanced in porous materials due to the large contact area between the solid matrix and the pore fluid (Jbeili & Zhang, Citation2021). The literature reports that these additional parameters affect the heat transfer process (Gerzhova et al., Citation2019).
Figure 8. Effect of particle size on thermal conductivity.
In the studied samples, the thermal conductivity of calendula soil is higher than clay mineral and fine sand. This behavior can be understood as the organic matter’s contribution. The organic matter is attached to the solid phase forming coordination complexes or electrostatic interactions (cation and anion exchange processes), adsorption, chemisorption, interactions via van der Waals forces, and H bonding (Sparks, Citation1995). However, the primary binding mechanism reported for organic matter with soil is through Fe2+, Fe3+, or Al3+ oxy or oxo bridge for carboxyl and hydroxyl functional groups in humic acids and hydrogen bonding for neutral and negatively charged polysaccharides (Cheshire et al., Citation2000; de Melo et al., Citation2016). The humic substances have unsaturation (presence of double bonds) and strong interaction with the solid particles, creating effective bridges and pathways for thermal conduction. Therefore, organic matter improves the soil’s thermal properties, as reported (Usowicz & Lipiec, Citation2020).
4.5. Electrical properties
Alternating Current (AC) Conductivity Analysis is done to elucidate the charge transport’s nature and magnitude. The real component of AC conductivity for calendula soil is three orders of magnitude higher than the clay fraction of studied soil and fine sand. There is a difference of five orders of magnitude higher than medium and coarse sand on the range of frequencies studied, as shown in Figure .
Figure 9. Electrical behavior of soil fractions.
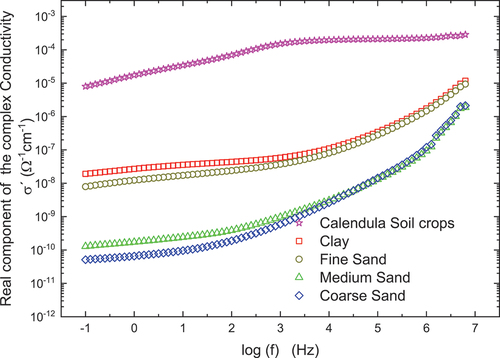
The calendula soil presents a plateau at frequencies higher than 1 KHz; below this frequency is a low-frequency dispersion. For sands, there is a plateau below 1 KHz; at higher frequencies, there is an exponential increase in the real component of the complex conductivity. The high-frequency plateau for calendula soil is associated with the contribution of three phenomena: electron conduction provided by the organic matter (carboxyl and phenolic groups) due to the delocalized electrons in its structure (Mielnik & Asensio, Citation2018), electron hopping in the magnetite structure (Kündig & Steven Hargrove, Citation1969), and proton conduction from the inorganic matrix surface (Arias et al., Citation2019). Because of the soil structure, regarded as three phases component: inorganic matrix, water, and air, it is possible to assign the low-frequency dispersion in a soil sample to ionic conduction in tiny pores, mainly from the interlayer region of the halloysite and illite (Rai et al., Citation2017), and with molecular association from humic and fulvic acids in the organic matter (de Melo et al., Citation2016). For clay and fine sand, the conduction mechanism at high frequency is by protons and ions in pores at low frequency. Meanwhile, the mechanism proposed by medium and coarse sand is mainly due to the protons covering the surface particle.
5. Conclusions
Thermal, structural, and electrical tools were applied to understand the soil properties.
Less structural anisotropy and better contact between particles produce effective pathways for heat transfer; therefore, the thermal conductivity increases.
There was evidence of quartz in the studied samples. Also, halloysite, kaolinite, and illite were found. A low quantity of magnetite was found in the calendula soil.
AC electrical conductivity was measured in clay fraction, fine, medium, coarse sand, and calendula soil.
The results suggest that organic matter has an essential effect on electrical conductivity because of the unsaturation in organic molecules.
It was possible to determine the presence of organic matter through thermophysical and electrical methods. Those methods contribute to a better understanding of the complex structure of the soil.
This study is a baseline to improve the methodologies that permit planning strategies to improve the soil conditions for better food access.
This characterization technique is essential to better plan crops as calendula and as a baseline for the sustainability of crops under a bioeconomy context.
Author contributions
Conceptualization, NPA, OHG, and JJA; Data curation, GHL, PFG; Formal analysis, NPA and JJA; Investigation, OHG; Methodology, PFG, NPA, GHL; Resources, OHG; Validation, NPA, GHL and JJA; Visualization, GLH, PFG; Writing—original draft, NPA, GLH, PFG, and JJA; Writing—review & editing, NPA, GHL, and JJA. All authors have read and agreed to the published version of the manuscript.
Acknowledgments
The authors thank Universidad de Sucre and Universidad Nacional de Colombia Sede Manizales for financial support.
Disclosure statement
No potential conflict of interest was reported by the authors.
Additional information
Notes on contributors
Nayda Patricia Arias Duque
N.P. Arias and J.J.A. Flores contributed equally to this work
The Bioeconomy, Sensors and Thermal Applications Network is a multidisciplinary group whose research focuses on biorefineries, agribusiness, thermal phenomena, advanced materials, and applications. This research group is made up of members from Colombia and Mexico who seek the application of their knowledge in the sustainable use of biomass as a source of energy and value-added products as support of bioeconomy. The training of the members of this group addresses various areas of knowledge, such as chemistry, condensed matter, biotechnology, engineering, mechatronics, electronics, and bionics. The diversity of academic formations of this group provides a broader vision of the various problems. Common interests include the study of soils, biofuels, smart materials, and sensor development.
Jose de Jesus Agustin Flores Cuautle
N.P. Arias and J.J.A. Flores contributed equally to this work
The Bioeconomy, Sensors and Thermal Applications Network is a multidisciplinary group whose research focuses on biorefineries, agribusiness, thermal phenomena, advanced materials, and applications. This research group is made up of members from Colombia and Mexico who seek the application of their knowledge in the sustainable use of biomass as a source of energy and value-added products as support of bioeconomy. The training of the members of this group addresses various areas of knowledge, such as chemistry, condensed matter, biotechnology, engineering, mechatronics, electronics, and bionics. The diversity of academic formations of this group provides a broader vision of the various problems. Common interests include the study of soils, biofuels, smart materials, and sensor development.
Pablo Fernando Grajales Carrillo
N.P. Arias and J.J.A. Flores contributed equally to this work
The Bioeconomy, Sensors and Thermal Applications Network is a multidisciplinary group whose research focuses on biorefineries, agribusiness, thermal phenomena, advanced materials, and applications. This research group is made up of members from Colombia and Mexico who seek the application of their knowledge in the sustainable use of biomass as a source of energy and value-added products as support of bioeconomy. The training of the members of this group addresses various areas of knowledge, such as chemistry, condensed matter, biotechnology, engineering, mechatronics, electronics, and bionics. The diversity of academic formations of this group provides a broader vision of the various problems. Common interests include the study of soils, biofuels, smart materials, and sensor development.
Oscar Giraldo-Osorio
N.P. Arias and J.J.A. Flores contributed equally to this work
The Bioeconomy, Sensors and Thermal Applications Network is a multidisciplinary group whose research focuses on biorefineries, agribusiness, thermal phenomena, advanced materials, and applications. This research group is made up of members from Colombia and Mexico who seek the application of their knowledge in the sustainable use of biomass as a source of energy and value-added products as support of bioeconomy. The training of the members of this group addresses various areas of knowledge, such as chemistry, condensed matter, biotechnology, engineering, mechatronics, electronics, and bionics. The diversity of academic formations of this group provides a broader vision of the various problems. Common interests include the study of soils, biofuels, smart materials, and sensor development.
Gemima Lara Hernández
N.P. Arias and J.J.A. Flores contributed equally to this work
The Bioeconomy, Sensors and Thermal Applications Network is a multidisciplinary group whose research focuses on biorefineries, agribusiness, thermal phenomena, advanced materials, and applications. This research group is made up of members from Colombia and Mexico who seek the application of their knowledge in the sustainable use of biomass as a source of energy and value-added products as support of bioeconomy. The training of the members of this group addresses various areas of knowledge, such as chemistry, condensed matter, biotechnology, engineering, mechatronics, electronics, and bionics. The diversity of academic formations of this group provides a broader vision of the various problems. Common interests include the study of soils, biofuels, smart materials, and sensor development.
References
- Andrini, L., Moreira Toja, R., Conconi, M. S., Requejo, F. G., & Rendtorff, N. M. (2019). Halloysite nanotube and its firing products: Structural characterization of halloysite, metahalloysite, spinel type silicoaluminate and mullite. Journal of Electron Spectroscopy and Related Phenomena, 234, 19–17. https://doi.org/10.1016/j.elspec.2019.05.007
- Arias, N. P., Becerra, M. E., & Giraldo, O. (2019). Electrical behavior of a catalyst composed of laminar manganese oxide supported on γ-Al2O3. Molecules, 24(16), 2984. https://doi.org/10.3390/molecules24162984
- Boguta, P., Sokołowska, Z., Skic, K., & Mukherjee, A. (2017). Use of thermal analysis coupled with differential scanning calorimetry, quadrupole mass spectrometry and infrared spectroscopy (TG-DSC-QMS-FTIR) to monitor chemical properties and thermal stability of fulvic and humic acids. PLoS ONE, 12(12), e0189653. https://doi.org/10.1371/journal.pone.0189653
- Cao, Q., Gong, S., Li, P., Wan, H., & Cheng, D. (2018). Correlation analysis of thermal physical indexes in subway engineering. Proceedings of the IOP Conference Series: Materials Science and Engineering, Xishuangbanna, Yunnan, China.
- Chang, W. J., & Weng, C. I. (2002). 10 - Heat and Mass Transfer in Porous Material. In D. B. Ingham & I. Pop (Eds.), Transport phenomena in porous media II (pp. 257–275). Pergamon.
- Cheshire, M. V., Dumat, C., Fraser, A. R., Hillier, S., & Staunton, S. (2000). The interaction between soil organic matter and soil clay minerals by selective removal and controlled addition of organic matter. European Journal of Soil Science, 51(3), 497–509. https://doi.org/10.1111/j.1365-2389.2000.00325.x
- de Melo, B. A. G., Motta, F. L., & Santana, M. H. A. (2016). Humic acids: Structural properties and multiple functionalities for novel technological developments. Materials Science and Engineering: C, 62, 967–974. https://doi.org/10.1016/j.msec.2015.12.001
- FAO. (2023). FAO and the 2030 Agenda for sustainable development. “Food and Agricultural Organization of the United Nations”. Retrieved 4/25/2023 from https://www.fao.org/sustainable-development-goals/overview/fao-and-the-2030-agenda-for-sustainable-development/land-and-soils/en/
- Fidríková, D., & Kubičár, Ľ. (2012). The use of the hot-ball method for observing the transport of moisture in porous stones. Slovak Journal of Civil Engineering, 20(3), 9. https://doi.org/10.2478/v10189-012-0013-8
- Flores Cuautle, J. J. A., Arias, N. P., Sandoval González, O. O., Martínez Sibaja, A., Landeta Escamilla, O., & Rivera Vargas, A. (2019). Investigation of thermal conductivity by Hot Ball method and its correlation with soil quality index of veracruz sugarcane soil. Sugar Technology, 21(3), 407–414. https://doi.org/10.1007/s12355-018-0682-3
- Gavrenko, O. A., Khadjai, G. Y., Merisov, B. A., & Sologubenko, A. V. (1995). Mechanisms of phonon scattering in layered clays. Physica Scripta, 51(2), 282. https://doi.org/10.1088/0031-8949/51/2/018
- Gerzhova, N., Cote, J., Blanchet, P., Dagenais, C., & Menard, S. (2019). A conceptual framework for modelling the thermal conductivity of dry green roof substrates [Green roof; growing medium; green roof substrate; thermal conductivity; high temperature]. BioResources, 14(4), 27. 2019. https://ojs.cnr.ncsu.edu/index.php/BioRes/article/view/BioRes_14_4_8573_Gerzhova_Conceptual_Framework_Modelling_Thermal
- Glorieux, C., Hudec, J., Guarachi, J., Martinez, K., Flores Cuautle, J. J. A., Kubicar, L., Bohac, V., Marin, E., Calderon Arenas, J. A., Alvarado, S., Janssen, H., & Van De Walle, W. (2017). Round robin test between different heat transport techniques characterizing low thermal conductivity materials. 33rd International Thermal Conductivity Conference and 21st International Thermal Expansion Symposium, Utah.
- Grekov, D., Montavon, G., Robinet, J.-C., & Grambow, B. (2019). Smectite fraction assessment in complex natural clay rocks from interlayer water content determined by thermogravimetric and thermoporometry analysis. Journal of Colloid and Interface Science, 555, 157–165. https://doi.org/10.1016/j.jcis.2019.07.076
- Gualtieri, A. F., Ferrari, S., Leoni, M., Grathoff, G., Hugo, R., Shatnawi, M., Paglia, G., & Billinge, S. (2008). Structural characterization of the clay mineral illite-1M. Journal of Applied Crystallography, 41(2), 402–415. https://doi.org/10.1107/S0021889808004202
- Harte, J., Torn, M. S., Chang, F.-R., Feifarek, B., Kinzig, A. P., Shaw, R., & Shen, K. (1995). Global warming and soil microclimate: Results from a meadow‐warming experiment. Ecological Applications, 5(1), 132–150. https://doi.org/10.2307/1942058
- Hartmut, Z. (2001). Phonons in layered compounds. Journal of Physics: Condensed Matter, 13(34), 7679. https://doi.org/10.1088/0953-8984/13/34/313
- Helming, K., Daedlow, K., Paul, C., Techen, A. K., Bartke, S., Bartkowski, B., Kaiser, D., Wollschläger, U., & Vogel, H. J. (2018). Managing soil functions for a sustainable bioeconomy—assessment framework and state of the art. Land Degradation & Development, 29(9), 3112–3126. https://doi.org/10.1002/ldr.3066
- Hernández, A. J., & Pastor Piñeiro, J. (2008). La restauración en sistemas con suelos degradados: estudio de casos en agroecosistemas mediterráneos y taludes de carretera [Restoration in systems with degraded soils: case studies in Mediterranean agroecosystems and road slopes.].
- Hinkel, K. M., Paetzold, F., Nelson, F. E., & Bockheim, J. G. (2001). Patterns of soil temperature and moisture in the active layer and upper permafrost at Barrow, Alaska: 1993–1999. Global and Planetary Change, 29(3), 293–309. https://doi.org/10.1016/S0921-8181(01)00096-0
- Höfer, M., & R, F. (2002). Heat transfer in quartz, orthoclase, and sanidine at elevated temperature. Physics and Chemistry of Minerals, 29(9), 571–584. https://doi.org/10.1007/s00269-002-0277-z
- Hudec, J., Dieska, P., Vitkovic, M., & Kubicar, L. (2015). Sensor based on the hot-ball method for measuring thermophysical parameters. measurement.
- Hudec, J., Glorieux, C., Dieška, P., & Kubičár, Ľ. (2016). Experimental comparison and validation of hot-ball method with guarded hot plate method on polyurethane foams. AIP Conference Proceedings, 1752(1), 040008. https://doi.org/10.1063/1.4955239
- Huggins, M. L. (1922). The crystal structure of quartz. Physical Review, 19(4), 363–368. https://doi.org/10.1103/PhysRev.19.363
- Jbeili, M., & Zhang, J. (2021). Effects of microscopic properties on macroscopic thermal conductivity for convective heat transfer in porous materials. Micromachines, 12(11), 1369. https://doi.org/10.3390/mi12111369
- Jorand, R., Vogt, C., Marquart, G., & Clauser, C. (2013). Effective thermal conductivity of heterogeneous rocks from laboratory experiments and numerical modeling [https://doi.org/10.1002/jgrb.50373]. Journal of Geophysical Research: Solid Earth, 118(10), 5225–5235. https://doi.org/10.1002/jgrb.50373
- Juerges, N., & Hansjürgens, B. (2018). Soil governance in the transition towards a sustainable bioeconomy–A review. Journal of Cleaner Production, 170, 1628–1639. https://doi.org/10.1016/j.jclepro.2016.10.143
- Keller, W. D., Reynolds, R. C., & Inoue, A. (1986). Morphology of clay minerals in the smectite-to-illite conversion series by scanning electron microscopy. Clays and Clay Minerals, 34(2), 187–197. https://doi.org/10.1346/CCMN.1986.0340209
- Kouyaté, M., Flores-Cuautle, J. J. A., Slenders, E., Sermeus, J., Verstraeten, B., Garay Ramirez, B. M. L., San Martin Martinez, E., Kubicar, L., Vretenar, V., Hudec, J., & Glorieux, C. (2015). Study of thermophysical properties of silver nanofluids by ISS-HD, Hot Ball and IPPE techniques. International Journal of Thermophysics, 36(10–11), 1–11. https://doi.org/10.1007/s10765-015-1985-1
- Kozlenko, D. P., Dubrovinsky, L. S., Kichanov, S. E., Lukin, E. V., Cerantola, V., Chumakov, A. I., & Savenko, B. N. (2019). Magnetic and electronic properties of magnetite across the high pressure anomaly. Scientific Reports, 9(1), 4464. https://doi.org/10.1038/s41598-019-41184-3
- Kristl, M., Muršec, M., Šuštar, V., & Kristl, J. (2016). Application of thermogravimetric analysis for the evaluation of organic and inorganic carbon contents in agricultural soils. Journal of Thermal Analysis and Calorimetry, 123(3), 2139–2147. https://doi.org/10.1007/s10973-015-4844-1
- Kubicar, L. (1990). Pulse method of measuring basic thermophysical parameters. In G. Svehla (Ed.), Comprehensive analytical chemistry, vol XII, thermal analysis (Vol. XII, pp. 1–350). Elsevier.
- Kündig, W., & Steven Hargrove, R. (1969). Electron hopping in magnetite. Solid State Communications, 7(1), 223–227. https://doi.org/10.1016/0038-1098(69)90729-7
- Li, R., Zhao, L., Wu, T., Wang, Q., Ding, Y., Yao, J., Wu, X., Hu, G., Xiao, Y., Du, Y., Zhu, X., Qin, Y., Yang, S., Bai, R., Du, E., Liu, G., Zou, D., Qiao, Y., & Shi, J. (2019). Soil thermal conductivity and its influencing factors at the tanggula permafrost region on the Qinghai–Tibet plateau. Agricultural and Forest Meteorology, 264, 235–246. https://doi.org/10.1016/j.agrformet.2018.10.011
- Marín-Valencia, P. A., Carmona-Garcia, E., Poveda Giraldo, J. A., Arias Duque, N. P., Ballesteros, L. F., & Cardona Alzate, C. A. (2021). The integral use of aromatic plants: Prefeasibility comparison of stand-alone and biorefinery processes using thyme (Thymus vulgaris) as base case. Biomass Conversion and Biorefinery, 11(2), 681–691. https://doi.org/10.1007/s13399-020-00734-w
- Mariotto, G., Murphy, S., & Shvets, I. V. (2002). Charge ordering on the surface of ${\mathrm{Fe}}_{3}{\mathrm{O}}_{4}(001)$. Physical Review B, 66(24), 245426. https://doi.org/10.1103/PhysRevB.66.245426
- McBratney, A., Field, D. J., & Koch, A. (2014). The dimensions of soil security. Geoderma, 213, 203–213. https://doi.org/10.1016/j.geoderma.2013.08.013
- Meunier, A. (2005). Clays. Springer Science & Business Media.
- Mielnik, L., & Asensio, C. (2018). Using delayed luminescence to characterize humic acids from lake sediments. Journal of Soils and Sediments, 18(8), 2844–2850. https://doi.org/10.1007/s11368-018-1914-6
- Momma, K., & Izumi, F. (2011). VESTA 3 for three-dimensional visualization of crystal, volumetric and morphology data. Journal of Applied Crystallography, 44(6), 1272–1276. https://doi.org/10.1107/S0021889811038970
- Ndzana, G. M., Huang, L., Zhang, Z., Zhu, J., Liu, F., & Bhattacharyya, R. (2019). The transformation of clay minerals in the particle size fractions of two soils from different latitude in China. CATENA, 175, 317–328. https://doi.org/10.1016/j.catena.2018.12.026
- Oladunjoye, M. A., & Sanuade, O. A. (2012). In situ determination of thermal resistivity of soil: Case study of olorunsogo power plant, Southwestern Nigeria. ISRN Civil Engineering, 2012, 591450. https://doi.org/10.5402/2012/591450
- Onwuka, B., & Mang, B. (2018). Effects of soil temperature on some soil properties and plant growth. Adv. Plants Agric. Res, 8(1), 34–37.
- Rai, R. K., Singh, V. P., & Upadhyay, A. (2017). Soil Analysis. In Planning and evaluation of irrigation projects: Methods and implementation pp. 505–523. Elsevier Science. https://books.google.com.mx/books?id=ddq1DQAAQBAJ https://doi.org/10.1016/B978-0-12-811748-4.00017-0
- Ren, J., Men, L., Zhang, W., & Yang, J. (2019). A new empirical model for the estimation of soil thermal conductivity. Environmental Earth Sciences, 78(12), 1–16. https://doi.org/10.1007/s12665-019-8360-7
- Revil, A., & Lu, N. (2013). Unified water isotherms for clayey porous materials. Water Resources Research, 49(9), 5685–5699. https://doi.org/10.1002/wrcr.20426
- Różański, A., & Stefaniuk, D. (2016). Prediction of soil solid thermal conductivity from soil separates and organic matter content: Computational micromechanics approach. European Journal of Soil Science, 67(5), 551–563. https://doi.org/10.1111/ejss.12368
- Sauer, T. J., & Horton, R. (2005). Soil heat flux. Micrometeorology in Agricultural Systems, 131–154. https://doi.org/10.2134/agronmonogr47.c7
- Shiozawa, S., & Campbell, G. S. (1990). Soil thermal conductivity. Remote Sensing Reviews, 5(1), 301–310. https://doi.org/10.1080/02757259009532137
- Sparks, D. L. (1995). Environmental Soil Chemistry: An Overview. In Donald L. S. (Ed.), Environmental Soil Chemistry (pp. 1–22). Academic Press.
- Tarnawski, V. R., & Leong, W. H. (2012). A series-parallel model for estimating the thermal conductivity of unsaturated soils. International Journal of Thermophysics, 33(7), 1191–1218. https://doi.org/10.1007/s10765-012-1282-1
- USDA. (1999). Soil quality kit guide. USDA-NRCS-ARS-SQI. Soil Quality Institute, National Resources Conservation Service, United States Department of Agriculture.
- Usowicz, B., & Lipiec, J. (2020). The effect of exogenous organic matter on the thermal properties of tilled soils in Poland and the Czech Republic. Journal of Soils and Sediments, 20(1), 365–379. https://doi.org/10.1007/s11368-019-02388-2
- van Wijk, W. R. (1965). Soil Microclimate, Its Creation, Observation and Modification. In P. E. Waggoner, D. M. Gates, E. K. Webb, W. R. van Wijk, J. A. Businger, T. V. Crawford, C. H. Hendershott, D. N. Moss, H. D. Johnson, W. S. Chepil, W. R. Henson, W. R. Gardner, B. Slavík, C. W. Thornthwaite, F. K. Hare, & J. D. McQuigg (Eds.), Agricultural meteorology (pp. 59–73). American Meteorological Society. https://doi.org/10.1007/978-1-940033-58-7_3
- Vogel, H.-J., Eberhardt, E., Franko, U., Lang, B., Ließ, M., Weller, U., Wiesmeier, M., & Wollschläger, U. (2019). Quantitative evaluation of soil functions: Potential and state. Frontiers in Environmental Science, 7, 164. https://doi.org/10.3389/fenvs.2019.00164
- Webb, J. (1956). Thermal conductivity of soil. Nature, 178(4541), 1074–1075. https://doi.org/10.1038/1781074b0
- Weil, R., & Brady, N. (2016). The nature and properties of soils (Vol. 910, 15th ed.). Pearson.
- Xiong, Z., & Zhang, B. (2019). Thermal transport properties of olivine, wadsleyite, and ringwoodite—a review. Minerals, 9(9), 519. https://doi.org/10.3390/min9090519
- Zhang, X. R., Kong, G. Q., Wang, L. H., & Xu, X. L. (2020). Measurement and prediction on thermal conductivity of fused quartz. Scientific Reports, 10(1), 6559. https://doi.org/10.1038/s41598-020-62299-y
- Zhang, S., Liu, Q., Yang, Y., Wang, D., He, J., & Sun, L. (2017). Preparation, morphology, and structure of kaolinites with various aspect ratios. Applied Clay Science, 147, 117–122. https://doi.org/10.1016/j.clay.2017.07.014
- Zhang, N., & Wang, Z. (2017). Review of soil thermal conductivity and predictive models. International Journal of Thermal Sciences, 117, 172–183. https://doi.org/10.1016/j.ijthermalsci.2017.03.013
- Zhao, Y., & Si, B. (2019). Thermal properties of sandy and peat soils under unfrozen and frozen conditions. Soil and Tillage Research, 189, 64–72. https://doi.org/10.1016/j.still.2018.12.026
- Zhou, Y., Yan, C., Tang, A. M., Duan, C., & Dong, S. (2019). Mesoscopic prediction on the effective thermal conductivity of unsaturated clayey soils with double porosity system. International Journal of Heat and Mass Transfer, 130, 747–756. https://doi.org/10.1016/j.ijheatmasstransfer.2018.11.001