
 ?Mathematical formulae have been encoded as MathML and are displayed in this HTML version using MathJax in order to improve their display. Uncheck the box to turn MathJax off. This feature requires Javascript. Click on a formula to zoom.
Abstract
Maize (Zea Mays L.) is one of the cereals most consumed worldwide, not only because of food uses but also because of its industrial uses. Physical processes are used when transforming maize industrially, particularly thermal processes are employed. Because of this, it is necessary to enhance the industrial procedures that constitute the grain processing chain. The additional information that allows advances in procedures and techniques in commodities like cereals gives an advantage to the food industry. The processes that involve temperature are benefiting of thermal properties knowledge. Therefore, maize thermal properties of each component are studied. Three standard varieties of maize seeds (GSV2, SLP, and P6) were thermally characterized. Photopyroelectric and open photoacoustic cell techniques were employed for characterization. The maize analyzed components were pericarp, endosperm (floury and vitreous), and germ. The outer maize layer’s pericarp presents the lowest thermal conductivity for GSV2 and P6 samples, whereas the P6 sample components have similar thermal conductivity values. The obtained results show a thermal impedance between some of the maize components. The presented information can be used to improve the maize thermal process transformation.
1. Introduction
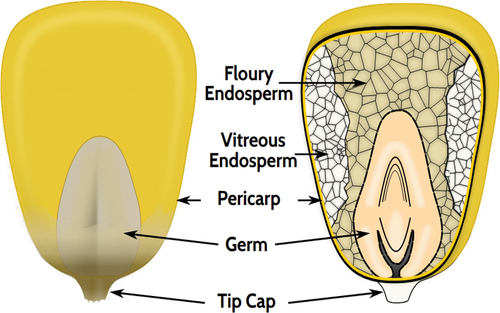
Maize (Zea mays L.) is the most-produced grain in the world, with more than 1 billion metric tons produced in 2022 (Foreign Agricultural Service, Citation2023). Maize is essential in Latin America, Africa, and Asia diets (Nuss & Tanumihardjo, Citation2010; Saldivar & Perez-Carrillo, Citation2016; Wang et al., Citation2015); in Africa, maize accounts for 19% of the calories per capita (Santpoort, Citation2020). The maize seed comprises three parts: the pericarp, endosperm, and germ, as illustrated in Figure (Singh et al., Citation2014). The pericarp is the grain’s most superficial or external part and the protective mantle that protects it. The endosperm has a carbohydrate composition and represents approximately 80 percent of the grain weight; it contains a significant source of starch and protein. The endosperm is classified into vitreous and floury (Singh et al., Citation2014). The vitreous endosperm has an elongated appearance and is composed of starch granules and proteins. The floury endosperm is located directly in the center of the grain and is made up of large starch granules, and each part of the grain is used to obtain a large number of products.
Figure 1. Main components of a maize seed.
The use of maize is not limited to food; it is considered a flexible grain because of its broad uses, such as flour, edible oil, and livestock feed (FAO, Citation2023). Industrial applications also stand out for maize as a biomass, biofuel, ethanol, starch source, thermoplastics, and film (Choudhary et al., Citation2020; FAO, Citation2023; Masanabo et al., Citation2022; Yıldırım-Yalçın et al., Citation2021; Żołek-Tryznowska & Kałuża, Citation2021). In other industries, as in material science, the knowledge of the thermal conductivity values can be used in the design and optimization of thermal insulation materials or building materials (Abbas et al., Citation2020; Lagouin et al., Citation2019; Mayer Laigle et al., Citation2021). In environmental science, thermal property values can be used to model and simulate the heat transfer in soils and sediments containing maize residues (Zhao et al., Citation2020).
In maize transformation, three main pathways are known: dry milling, wet milling, and nixtamalization (Saldivar & Perez-Carrillo, Citation2016). The endosperm and germ can be transformed into flour and oil in dry milling (Saldivar & Perez-Carrillo, Citation2016), as shown in Figure . Dry-milling includes several thermal processes, such as drying at 60°C and cooling at 24°C until it reaches 12% moisture (Saldivar & Perez-Carrillo, Citation2016).
Figure 2. Flowchart of the degerming-tempering dry-milling process of maize. Reprinted from encyclopedia of food and health, saldivar, S. O. Serna Perez-Carrillo, E., maize, 601–609, Copyright 2016, with permission from Elsevier, license 5,505,421,441,690.
Wet milling is used to obtain starch, protein, fiber, and germ (Saldivar & Perez-Carrillo, Citation2016); a wet milling starch production flowchart is shown in Figure . The starch production includes heating the entire grain at temperatures between 48°C and 50°C, and drying germ, bran, and gluten (Saldivar & Perez-Carrillo, Citation2016). Figures illustrate that the maize grain industrial process involves thermal processes and seed component separation (Saldivar & Perez-Carrillo, Citation2016). The knowledge of the thermal properties of each part of the maize seed could help improve the cooking methods of products made up of each part of the grain. Even it can help enhance the oil extraction methods; therefore, knowledge of their thermal properties is crucial. The importance of maize is so high that several techniques have been used to assess maize grain quality, ranging from destructive to non-destructive tests (Domínguez-Pacheco et al., Citation2014; Hernández-Aguilar et al., Citation2015; Pacheco et al., Citation2013; Wang et al., Citation2016).
Figure 3. Flowchart of the sulfur dioxide wet-milling process for maize starch production. Reprinted from encyclopedia of food and health, Saldivar, S. O. Serna Perez-Carrillo, E., maize, 601–609, Copyright 2016, with permission from Elsevier, license 5,505,421,441,690.
Among the non-destructive techniques, photothermal techniques have measured the thermal properties of solid, liquid, and gel samples with a 5% precision (Carbajal-Valdez et al., Citation2017; Correa-Pacheco et al., Citation2015; Xu et al., Citation2016). All these techniques are based on a fundamental principle: energy absorption by either the sample or sensor leads to heat diffusion. Detecting temperature variations experienced by the material under study allows for obtaining diverse information about its properties. Various configurations have been used to obtain the thermal properties of samples, including photoacoustic spectroscopy, photothermal radiometry, thermal lens spectrometry, and photopyroelectric technique (Balderas-López & Mandelis, Citation2020; Flores Cuautle et al., Citation2019; Gallardo-Hernández et al., Citation2017; Hernández-Aguilar et al., Citation2019; Lara Hernandez et al., Citation2020; Lara-Hernández et al., Citation2017). The Photopyroelectric Technique (PPE) has been used to characterize solids or liquids thermally as described elsewhere (Flores-Cuautle et al., Citation2009; Gallardo-Hernández et al., Citation2017; Lara Hernandez et al., Citation2013). The so-called Open Photoacoustic Cell (OPC) experimentally measured the thermal diffusivity of the solid and liquid samples (Marquezini et al., Citation1991; Velasco et al., Citation2011).
The literature reports photoacoustic spectroscopy (Rojas-Lima et al., Citation2018) and photothermal microscopy (Hernández-Aguilar et al., Citation2015) on maize grains which give an insight into the optical and thermal behavior of the sample; this type of study gives qualitative information, but not quantitative information regardless of the sample. On the other hand, those studies report the maize thermal information using entire grains as samples. Differential scanning calorimetry has been used to study maize’ pericarp (Arámbula-Villa et al., Citation2007); in such a study, the sample must undergo several grinding steps. This study analyzed each part of the corn kernel separately to know its thermal properties.
Despite the variety of methods for evaluating grain part properties like bulk density, porosity, moisture, and specific heat (Carbajal-Valdez et al., Citation2017; Correa-Pacheco et al., Citation2015), more information must be given on the thermal properties of each maize seed component. This work presents measurements of the thermal effusivity and diffusivity of the pericarp, vitreous and floury endosperm, and germ of maize seed using two well-known techniques: Open Photoacoustic Cell and Inverse photopyroelectric (Flores-Cuautle et al., Citation2009; Lara Hernandez et al., Citation2013; Marquezini et al., Citation1991; Velasco et al., Citation2011). Thermal properties reported are an average of 10 tablets; additionally, each sample in tablet form is made up of samples of different grains of the same specie to determine the thermal properties of the specie in general.
2. Experimental setup and procedures
2.1. Source of raw materials
Notwithstanding hundreds of maize hybrid varieties, most have a common origin in a few significant races (Goodman & Bird, Citation1977). Therefore, standard plant material, GSV2, SLP, and P6-133-CL-7 (named here as P6), was used in this study. The studied maize are enhanced varieties, P6 corresponds to a simple cross, SPL is a free pollination, and GSV2 is a simple variety. All those samples are registered samples according to Mexican law (Carballo-Carballo et al., Citation2013) and are equivalent to certified seeds according to the Association of official seed certifying agencies (AOSCA) (Carballo-Carballo et al., Citation2013). Samples were obtained from Genetic Resources and Productivity Program, Seed Production (Programa de Recursos Genéticos y Productividad, Producción de semillas), Estado de México, México.
The analyzed maize contains moisture levels of 11.7 ± 0.05, 10.03± and 12.21 ± 0.08 g/100 g for GSV2, SLP, and P6-133×CL-7, respectively, which is allowed by Mexican Official Standard NMX-FF-034/1-SCFI-2002. In this sense, the moisture content of the corn satisfies the moisture requirement according to the standard. The standard establishes a moisture of 14% as a maximum value to store and preserve maize (Molteberg et al., Citation1995; Norma Oficial Mexicana, Citation2002)
2.2. Seed components separation
Considering maize seed comprises three main components, each component was separated using a scalpel, and each sample component was settled dried. Because thermal measurements require a solid sample, each component was pressed into pellets. Before making the pellets, each element was dry ground to obtain a uniform particle size. Depending on the physical composition of each component (vitreous endosperm, floury endosperm, and germ), different pressures are required to achieve compaction of the pellets, ranging from 5 to 15 tons to form circular pellets with 9.52 mm diameter.
For vitreous and floury endosperm tablets, polyvinyl alcohol was used as a binding agent, and the alcohol was evaporated to avoid influencing the properties of the samples. The polyvinyl alcohol used to bind each sample was 20 µl, and the binding agent was added at the pressing stage using a micropipette of 20 ± 0.2 µl (Eppendorf). Sample measurements were performed after the polyvinyl alcohol was fully evaporated; therefore, the binding agent did not influence the samples’ thermal properties. In the case of the pericarp sample, the binding agent was unnecessary because it had a film form, and in the case of the germ sample, the oil content eliminates the agglutinate agent necessity. Because the sample thickness value is necessary for the calculations, all thicknesses are obtained by sampling several points on each sample. The analyzed pellets have 38.07, 42.80 y 53.25 µm average for GSV2, SLP, and P6 samples; all measurements were performed over 10 pellets.
2.3. Thermal effusivity
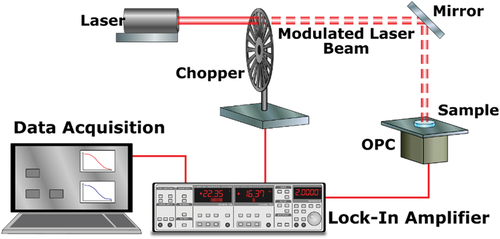
The photopyroelectric technique facilitates the optical and thermal characterization of various materials. This technique consists of frequency-modulated light impinging on one side of a pyroelectric (PE) sensor. The sample is placed on the opposite side of the pyroelectric sensor, as Figure shows. This configuration is called the inverse or frontal photopyroelectric configuration (IPPE or FPPE) (Chirtoc & Mihailescu, Citation1989; Mandelis & Zver, Citation1985; Sahraoui et al., Citation2002) and can be used to determine thermal effusivity ().
Figure 4. Experimental setup used to obtain the maize samples’ thermal effusivity through the IPPE configuration (Flores Cuautle et al., Citation2019). Reproduced under the creative commons attribution 4.0 international license.
The theoretical expression of the pyroelectric signal in the inverse configuration is reported by Sahraoui and coworkers (Sahraoui et al., Citation2002). Assuming an optically and thermally thick pyroelectric, meaning the pyroelectric thermal diffusion length is smaller than the pyroelectric thickness (Caerels et al., Citation1998), and
, additionally it can be assumed that the gas-pyroelectric reflection coefficient
then, the pyroelectric signal can be expressed as Equation 1 (Caerels et al., Citation1998).
Where is the normalized PE detector output signal,
is the thickness of pyroelectric,
the complex coefficient of thermal diffusion,
the thermal diffusion coefficient of the sample (s) and pyroelectric (p),
angular frequency of incident light,
,
, with
and
the thermal effusivities for sample and PE, respectively, the subscript
refers to the sample, and pyroelectric and
the imaginary part.
The samples were analyzed using a 150 mW Argon-ion laser (Modu-Lase Stellar-Pro) and a PZT as a pyroelectric sensor 200 µm thick. The IPPE signals were obtained in the 2–50 Hz range with 5% exponential increments for all the studied samples. The thermal properties of the pyroelectric sensor (m/s2,
Ws1/2m−2K−1) were obtained in advance at room temperature (22°C) using the described experimental configuration and reference materials as a sample with known thermal properties.
2.4. Thermal diffusivity
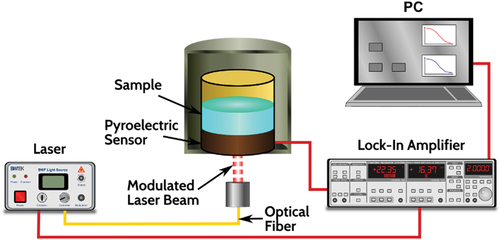
The OPC technique consists of applying a modulated laser light to the sample placed on a microphone, as Figure shows. Therefore, the sample energy absorption is converted into a gas pressure variation inside the photoacoustic cell. The photoacoustic cell is an electret microphone where the sample to be studied is placed over the opening. The microphone cavity is an acoustic chamber with minimal volume and without other transducers. The microphone can be considered electrically equivalent to a parallel RC circuit with a current source proportional to the ratio of change of the membrane connection. When a modulated light impinges on one side of the sample, the opposite side of the sample acts as a piston compressing the air inside the acoustic chamber.
Figure 5. Experimental setup used to obtain the thermal diffusivity of the maize samples employing the OPC configuration (Flores Cuautle et al., Citation2019). Reproduced under the creative commons attribution 4.0 international licence.
Marquezini (Marquezini et al., Citation1991) and Perondi (Perondi & Miranda, Citation1987) have already reported the mathematical expression for the microphone voltage on OPC configuration. When the sample is considered optically opaque (,) leads to
and assuming a thermally thick sample, which means that the product of the sample thickness times thermal diffusion coefficient is more than 1 (
), the mathematical expression for the microphone voltage can be reduced to Eq. 2. In the case of optically transparent simples, as in the case of the pericarp, the sample can be turned into an optically opaque sample using a dark thin metal layer with known thermal properties.
Where is the ratio of heat capacities,
is the ambient pressure,
the absorbed light intensity,
the thermal diffusivity of gas,
the modulation frequency,
the conductivity of the sample, and
the thickness of the sample. Expressing equation 2 in exponential form and taking the signal phase, an adjustment function was obtained depending on the angular frequency (
) at which the microphone membrane oscillates, the same as the incident laser frequency. The signal phase is employed because it is more stable due to the immunity to optical factors and laser intensity. The signal phase can be expressed as
leading to
Expressions 2 and 3 demonstrate the feasibility of obtaining the thermal diffusivity of the sample by performing a frequency sweep. EquationEquation 3(3)
(3) fits the data obtained from the measurements when sweeping at high frequencies. In this way, the slope-fitting parameter
was determined, and it was used to determine the diffusivity of the sample (
). As sample thickness must be known to use EquationEquation 4
(4)
(4) , sample thicknesses were obtained using a micrometer (Mitutoyo 2119–50) with 1 µm resolution. All samples’ thicknesses were obtained by sampling 10 different points of the pellets, and the thickness used for the thermal diffusivity calculation is the average of the measurements.
2.5. Thermal conductivity
Because the thermal properties are related, a complete thermal characterization can be achieved when two different thermal properties are known. Therefore, the thermal conductivity of analyzed samples was obtained by using the relationship between measured thermal diffusivities and effusivities ().
3. Results
3.1. Thermal effusivity
When the pyroelectric thermal parameters are known, thermal effusivity can be extracted from EquationEquation 1(1)
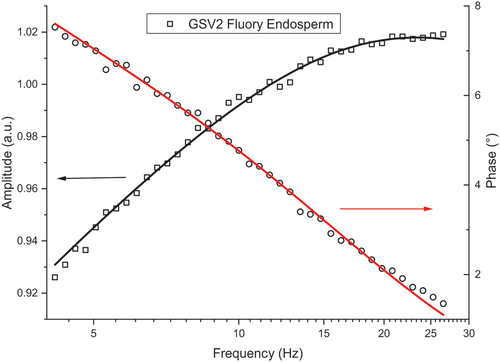
(1) by fitting the Equation to the experimental data. The fitting can be performed using either the amplitude, the phase, or a complex fitting. Figure shows an example of the IPPE normalized signal amplitude (black squares) and phase (red circles) for the germ-GSV2 sample. The solid lines best fit EquationEquation 1
(1)
(1) to the experimental data; for the fit to happen, amplitude and phase signals were fitted simultaneously using the thermal effusivity as a fitting parameter.
Figure 6. IPPE normalized amplitude and phase as a function of the light modulation frequency for the maize sample Germ-GSV2. The circles and squares represent the experimental data, and the solid line best fits the amplitude and phase of complex EquationEquation 1(1)
(1) to the experimental PPE signal.
3.2. Thermal diffusivity
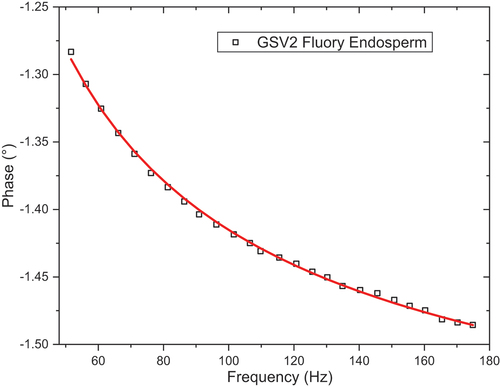
The fitting is performed using the phase component of the pyroelectric signal. The phase component was used because it is more stable than the amplitude and is independent of the sample surface optical factors and laser intensity (Balderas-López & Mandelis, Citation2003). Figure shows the best fit of EquationEquation 3(3)
(3) to the phase component of the experimental data of the germ GSV2 sample. The solid red line is the best fit, and the squares are the experimental data; the frequency sweep was performed with a 5 Hz step.
Figure 7. PPE phase as a function of the light modulation frequency for the maize sample Germ-GSV2. The squares represent the experimental data, and the solid red line best fits the phase of Eq.3 to the experimental PPE data.
Thermoelastic contributions can appear at low frequencies in the photothermal signal. This contribution is because of the relatively large thermal diffusion length and the small thickness of the sample; this was considered in the EquationEquation 3(3)
(3) fitting.
Figure shows the thermal effusivity values of all the samples and their components. The presented error bar is the confidence interval for the performed measurements. In the error bar calculation, error propagation comprises the measurement uncertainty, mathematical treatment, and the number of samples studied. Thermal effusivity values were obtained using the procedure described in the methods section.
Figure 8. Values of thermal effusivity obtained by IPPE configuration of different maize seed components and maize seeds.
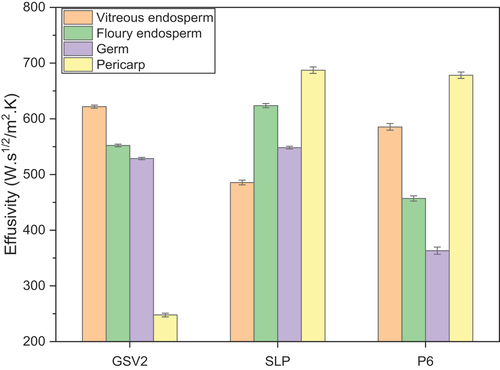
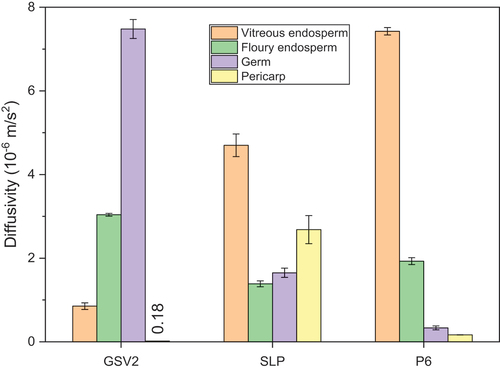
Figure shows the measured thermal diffusivity values with their corresponding confidence intervals.
Figure 9. Values of thermal effusivity obtained by OPC configuration of different maize seed components and maize seeds.
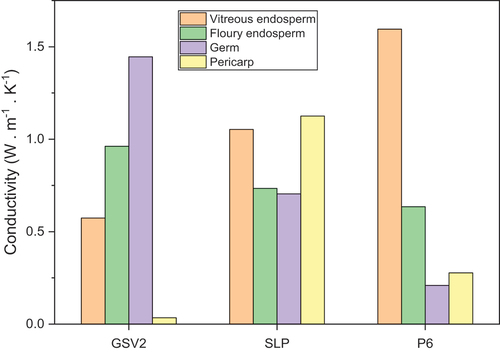
Because of the relationships of thermal properties, a complete thermal characterization of these samples is achieved when two thermal parameters are known. Therefore, thermal conductivity is obtained using the measured thermal diffusivities and effusivities (); thermal conductivity values are presented in Figure .
Figure 10. Thermal conductivity values calculated from the thermal effusivities and thermal diffusivities.
Remarkably, the SPL pericarp’s thermal effusivity is 687 Ws1/2m−2K−1, more than 2.5 times the GSV2 pericarp value of 248 Ws1/2m−2K−1; this can be related to the postharvest treatment. The remaining components have an effusivity value ranging from 363 Ws1/2m−2K−1 to 678 Ws1/2m−2K−1, which gives an insight into the thermal behavior of this seed. The germ is the grain part which presents more thermal property variation, which can be related to the oil content across different races. Because in GSV2 and SLP, there is higher oil content, and both have greater thermal effusivity than P6, it is reasonable to relate the oil content to the thermal effusivity.
The knowledge of oil content is also valuable because of economic reasons. The analyzed samples were formed using several different grains from the same race to ensure the results accurately represent the race information. All measurements were repeated 10 times to ensure a representative value; the standard deviation of measurements and error propagation were considered for reporting the thermal value error.
4. Conclusions
The thermal conductivity of the pericarp in the SLP variety is remarkably higher compared to GSV2 and P6 varieties. The thermal conductivity of the studied components of the SLP variety was close to each other, which means there was a low thermal impedance among the layers composing the maize variety.
The low thermal diffusivity found in the GSV2 pericarp sample can be explained due to the small thickness of the analyzed pericarp samples. Thermal diffusivity is proportional to the squared thickness and inversely proportional to the squared P parameter. GSV2 pericarp’ P value is the highest compared to the rest of the analyzed samples. The low thermal conductivity value shown by the GSV2 pericarp is because thermal conductivity is proportional to thermal diffusivity and effusivity, as previously mentioned.
The knowledge of the thermal properties of the maize pericarp, germ, and endosperm opens the windows for improving the grain and its separate components’ preservation. Thermal conductivity can be used to optimize the drying process in industrial processes. In agricultural applications, the thermal conductivity values can be used to develop new methods for measuring maize grains’ moisture content and quality.
On the other hand, thermal property values can be used to optimize the production of biofuels from maize residues and byproducts. In general, the thermal conductivity values of maize pericarp, germ, and endosperm are essential parameters for understanding the thermal behavior of maize and its byproducts in various scientific and engineering applications.
Disclosure statement
No potential conflict of interest was reported by the author(s).
Additional information
Notes on contributors
Gemima Lara Hernández
The sensors and thermal applications network is a multidisciplinary group whose research focuses on thermal phenomena, materials, and applications. This research group is looking for a growing thermal properties database and new methods to obtain the thermal properties of the most different samples. The training of the members of this group addresses various areas of knowledge, such as physics, mechatronics, electronics, and bionics. The diversity of the academic backgrounds of this group provides a broader vision of the various problems. Common interests include the study of biofuels, vegetable oils, and smart materials and the development of various sensors.
Claudia Hernández Aguilar
The sensors and thermal applications network is a multidisciplinary group whose research focuses on thermal phenomena, materials, and applications. This research group is looking for a growing thermal properties database and new methods to obtain the thermal properties of the most different samples. The training of the members of this group addresses various areas of knowledge, such as physics, mechatronics, electronics, and bionics. The diversity of the academic backgrounds of this group provides a broader vision of the various problems. Common interests include the study of biofuels, vegetable oils, and smart materials and the development of various sensors.
Arturo Domínguez Pacheco
The sensors and thermal applications network is a multidisciplinary group whose research focuses on thermal phenomena, materials, and applications. This research group is looking for a growing thermal properties database and new methods to obtain the thermal properties of the most different samples. The training of the members of this group addresses various areas of knowledge, such as physics, mechatronics, electronics, and bionics. The diversity of the academic backgrounds of this group provides a broader vision of the various problems. Common interests include the study of biofuels, vegetable oils, and smart materials and the development of various sensors.
Albino Martínez Sibaja
The sensors and thermal applications network is a multidisciplinary group whose research focuses on thermal phenomena, materials, and applications. This research group is looking for a growing thermal properties database and new methods to obtain the thermal properties of the most different samples. The training of the members of this group addresses various areas of knowledge, such as physics, mechatronics, electronics, and bionics. The diversity of the academic backgrounds of this group provides a broader vision of the various problems. Common interests include the study of biofuels, vegetable oils, and smart materials and the development of various sensors.
Alfredo Cruz Orea A.
The sensors and thermal applications network is a multidisciplinary group whose research focuses on thermal phenomena, materials, and applications. This research group is looking for a growing thermal properties database and new methods to obtain the thermal properties of the most different samples. The training of the members of this group addresses various areas of knowledge, such as physics, mechatronics, electronics, and bionics. The diversity of the academic backgrounds of this group provides a broader vision of the various problems. Common interests include the study of biofuels, vegetable oils, and smart materials and the development of various sensors.
Jose de Jesus Agustin Flores Cuautle
The sensors and thermal applications network is a multidisciplinary group whose research focuses on thermal phenomena, materials, and applications. This research group is looking for a growing thermal properties database and new methods to obtain the thermal properties of the most different samples. The training of the members of this group addresses various areas of knowledge, such as physics, mechatronics, electronics, and bionics. The diversity of the academic backgrounds of this group provides a broader vision of the various problems. Common interests include the study of biofuels, vegetable oils, and smart materials and the development of various sensors.
References
- Abbas, M. S., Mcgregor, F., Fabbri, A., & Ferroukhi, M. Y. (2020). The use of pith in the formulation of lightweight bio-based composites: Impact on mechanical and hygrothermal properties. Construction and Building Materials, 259, 120573. https://doi.org/10.1016/j.conbuildmat.2020.120573
- Arámbula-Villa, G., Gutiérrez-Árias, E., & Moreno-Martínez, E. (2007). Thermal properties of maize masa and tortillas with different components from maize grains, and additives. Journal of Food Engineering, 80(1), 55–13. https://doi.org/10.1016/j.jfoodeng.2006.05.004
- Balderas-López, J. A., & Mandelis, A. (2003). Self-normalized photothermal technique for accurate thermal diffusivity measurements in thin metal layers. Review of Scientific Instruments, 74(12), 5219–5225. https://doi.org/10.1063/1.1623626
- Balderas-López, J. A., & Mandelis, A. (2020). Photopyroelectric spectroscopy of pure fluids and liquid mixtures: Foundations and state-of-the-art applications. International Journal of Thermophysics, 41(6), 78. https://doi.org/10.1007/s10765-020-02662-3
- Caerels, J., Glorieux, C., & Thoen, J. (1998). Absolute values of specific heat capacity and thermal conductivity of liquids from different modes of operation of a simple photopyroelectric setup. Review of Scientific Instruments, 69(6), 2452–2458. https://doi.org/10.1063/1.1148973
- Carbajal-Valdez, R., Jiménez-Pérez, J. L., Cruz-Orea, A., Correa-Pacheco, Z. N., Alvarado-Noguez, M. L., Romero-Ibarra, I. C., & Mendoza-Alvarez, J. G. (2017). Thermal properties of centrifuged oils measured by alternative photothermal techniques. Thermochimica Acta, 657(Supplement C), 66–71. https://doi.org/10.1016/j.tca.2017.09.014
- Carballo-Carballo, A., Alcázar Andrade, J., Estrada Gómez, J., Aguilera Peña, M., García García, M., Benítez Riquelme, I., & Guerrero Ortiz, J. L. (2013). Regla para la calificación de semilla de maíz (Zea mays L.). (NOM-001-SAG/FITO-2013). Secretaría de Agricultura, Ganadería, Desarrollo Rural, Pesca y Alimentación
- Chirtoc, M., & Mihailescu, G. (1989). Theory of the photopyroelectric method for investigation of optical and thermal materials properties. Physical Review B, B40(null), 9606–9617. https://doi.org/10.1103/physrevb.40.9606
- Choudhary, M., Singh, A., Gupta, M., & Rakshit, S. (2020). Enabling technologies for utilization of maize as a bioenergy feedstock. Biofuels, Bioproducts and Biorefining, 14(2), 402–416. https://doi.org/10.1002/bbb.2060
- Correa-Pacheco, Z. N., Cruz-Orea, A., Jiménez-Pérez, J. L., Solorzano-Ojeda, S. C., & Tramón-Pregnan, C. L. (2015). Measurement of thermal properties of triticale starch films using photothermal techniques. International Journal of Thermophysics, 36(5), 873–879. https://doi.org/10.1007/s10765-014-1771-5
- Domínguez-Pacheco, A., Hernández-Aguilar, C., & Cruz-Orea, A. (2014). Thermal images of seeds obtained at different depths by Photoacoustic Microscopy (PAM). International Journal of Thermophysics, 36(5–6), 1–7. https://doi.org/10.1007/s10765-014-1789-8
- FAO. (2023). FAOSTAT, maiz data. FAOSTAT. https://www.fao.org/faostat/en/#search/maize
- Flores-Cuautle, J. J. A., Cruz-Orea, A., & Suaste-Gomez, E. (2009). Thermal effusivity of the Pb(0.88)Ln(0.08)Ti(0.98)Mn(0.02)O(3) (Ln=La, Eu) ferroelectric ceramic system by inverse photopyroelectric technique. Ferroelectrics, 386(1), 36–40. https://doi.org/10.1080/00150190902961264
- Flores Cuautle, J. J., Lara Hernández, G., Cruz Orea, A., Suaste Gómez, E., Hernández Aguilar, C., Gonzalez Moran, C., Miranda Hernández, J. G., & Sandoval Gonzalez, O. (2019). Study of thermal properties on the different layers composing a commercial ceramic tile. Revista Mexicana de Física, 65(2 Mar–Apr), 124–127. https://doi.org/10.31349/RevMexFis.65.124
- Foreign Agricultural Service. (2023). Corn 2022 world production. U.S. Department of agriculture. Retrieved October 3, 2023 from https://ipad.fas.usda.gov/cropexplorer/ce_contact.aspx
- Gallardo-Hernández, E. A., Lara-Hernández, G., Nieto-Camacho, F., Domínguez-Pacheco, A., Cruz-Orea, A., Hernández-Aguilar, C., Contreras-Gallegos, E., Torres, M. V., & Flores-Cuautle, J. J. A. (2017). Thermal and tribological properties of jatropha oil as additive in commercial oil. International Journal of Thermophysics, 38(4), 54. https://doi.org/10.1007/s10765-017-2185-y
- Goodman, M. M., & Bird, R. M. (1977). The races of maize iv: Tentative grouping of 219 Latin American races. Economic Botany, 31(2), 204–221. https://doi.org/10.1007/BF02866591
- Hernández-Aguilar, C., Domínguez-Pacheco, A., Cruz-Orea, A., & Ivanov, R. (2019). Photoacoustic spectroscopy in the optical characterization of foodstuff: A review. Journal of Spectroscopy, 2019, 5920948. https://doi.org/10.1155/2019/5920948
- Hernández-Aguilar, C., Domínguez-Pacheco, A., Cruz-Orea, A., & Zepeda-Bautista, R. (2015). Depth profiles in maize (Zea mays L.) seeds studied by photoacoustic spectroscopy. International Journal of Thermophysics, 36(5), 891–899. https://doi.org/10.1007/s10765-014-1791-1
- Lagouin, M., Magniont, C., Sénéchal, P., Moonen, P., Aubert, J.-E., & Laborel-Préneron, A. (2019). Influence of types of binder and plant aggregates on hygrothermal and mechanical properties of vegetal concretes. Construction and Building Materials, 222, 852–871. https://doi.org/10.1016/j.conbuildmat.2019.06.004
- Lara Hernandez, G., Cruz-Orea, A., Suaste Gomez, E., & Flores Cuautle, J. J. A. (2013). Comparative performance of PLZT and PVDF pyroelectric sensors used to the thermal characterization of liquid samples. Advances in Materials Science and Engineering, 2013, 5. https://doi.org/10.1155/2013/281279
- Lara-Hernández, G., Flores-Cuautle, J. J. A., Hernandez-Aguilar, C., Suaste-Gómez, E., & Cruz-Orea, A. (2017). Thermal properties of jojoba oil between 20° C and 45° C. International Journal of Thermophysics, 38(8), 115. https://doi.org/10.1007/s10765-017-2252-4
- Lara Hernandez, G., Hernández Aguilar, C., Cruz Orea, A., Arias Duque, N. P., Wilches Torres, M. A., & Flores Cuautle, J. J. A. (2020). Wheat germ, mamey seed, walnut, coconut, and linseed oil thermal characterization using photothermal techniques. Revista Mexicana de Fisica, 66(2), 5. https://doi.org/10.31349/RevMexFis.66.246
- Mandelis, A., & Zver, M. M. (1985). Theory of photopyroelectric spectroscopy of solids. Journal of Applied Physics, 57(9), 4421–4430. https://doi.org/10.1063/1.334565
- Marquezini, M. V., Cella, N., Mansanares, A. M., Vargas, H., & Miranda, L. C. M. (1991). Open photoacoustic cell spectroscopy. Measurement Science and Technology, 2(4), 396. https://doi.org/10.1088/0957-0233/2/4/020
- Masanabo, M. A., Ray, S. S., & Emmambux, M. N. (2022). Properties of thermoplastic maize starch-zein composite films prepared by extrusion process under alkaline conditions. International Journal of Biological Macromolecules, 208, 443–452. https://doi.org/10.1016/j.ijbiomac.2022.03.060
- Mayer Laigle, C., Haurie Ibarra, L., Breysse, A., Palumbo, M., Mabille, F., Lacasta Palacio, A. M., & Barron, C. (2021). Preserving the cellular tissue structure of maize pith though dry fractionation processes: A key point to use as insulating agro-materials. Materials, 14(18), 5350. https://doi.org/10.3390/ma14185350
- Molteberg, E. L., Vogt, G., Nilsson, A., & Frolich, W. (1995). Effects of storage and heat processing on the content and composition of free fatty acids in oats. Cereal Chemistry, 72(1), 88–93.
- Nuss, E. T., & Tanumihardjo, S. A. (2010). Maize: A paramount staple crop in the context of global nutrition. Comprehensive Reviews in Food Science and Food Safety, 9(4), 417–436. https://doi.org/10.1111/j.1541-4337.2010.00117.x
- Pacheco, A. D., Aguilar, C. H., & Cruz-Orea, A. (2013). Analysis of maize seed germs by photoacoustic microscopy and photopyroelectric technique. International Journal of Thermophysics, 34(5), 979–985. https://doi.org/10.1007/s10765-012-1361-3
- Perondi, L., & Miranda, L. (1987). Minimal‐volume photoacoustic cell measurement of thermal diffusivity: Effect of the thermoelastic sample bending. Journal of Applied Physics, 62(7), 2955–2959. https://doi.org/10.1063/1.339380
- Norma Oficial Mexicana Productos alimenticios no industrializados para consumo humano -Cereales, (2002). https://sitios1.dif.gob.mx/alimentacion/docs/NMX-FF-034-1-SCFI-2002_MAIZ_blanco.pdf
- Rojas-Lima, J. E., Domínguez-Pacheco, F. A., Hernández-Aguilar, C., Hernández-Simón, L. M., & Cruz-Orea, A. (2018). Kolmogorov–Smirnov test for statistical characterization of photopyroelectric signals obtained from maize seeds. International Journal of Thermophysics, 40(1), 4. https://doi.org/10.1007/s10765-018-2462-4
- Sahraoui, A. H., Longuemart, S., Dadarlat, D., Delenclos, S., Kolinsky, C., & Buisine, J. M. (2002). The application of the photopyroelectric method for measuring the thermal parameters of pyroelectric materials. Review of Scientific Instruments, 73(7), 2766–2772. https://doi.org/10.1063/1.1482151
- Saldivar, S. O. S., & Perez-Carrillo, E. (2016). Maize. In (Eds.), Encyclopedia of food and health (pp. 601–609). Academic Press. https://doi.org/10.1016/B978-0-12-384947-2.00436-0
- Santpoort, R. (2020). The drivers of maize area expansion in sub-saharan Africa. How policies to boost maize production overlook the interests of smallholder farmers. Land, 9(3), 68. https://doi.org/10.3390/land9030068
- Singh, N., Kaur, A., & Shevkani, K. (2014). Maize: Grain structure, composition, milling, and starch characteristics. In D. P. Chaudhary, S. Kumar, & S. Langyan (Eds.), Maize: Nutrition dynamics and novel uses (pp. 65–76). Springer India.
- Velasco, D. S., Baesso, M. L., Medina, A. N., Bicanic, D. D., Koehorst, R., Hooft, J. J. J. V. D., & Bento, A. C. (2011). Thermal diffusivity of periderm from tomatoes of different maturity stages as determined by the concept of the frequency-domain open photoacoustic cell. Journal of Applied Physics, 109(3), 034703. https://doi.org/10.1063/1.3530735
- Wang, L., Pu, H., Sun, D.-W., Liu, D., Wang, Q., & Xiong, Z. (2015). Application of hyperspectral imaging for prediction of textural properties of maize seeds with different storage periods. Food Analytical Methods, 8(6), 1535–1545. https://doi.org/10.1007/s12161-014-0029-y
- Wang, L., Sun, D.-W., Pu, H., & Zhu, Z. (2016). Application of hyperspectral imaging to discriminate the variety of maize seeds. Food Analytical Methods, 9(1), 225–234. https://doi.org/10.1007/s12161-015-0160-4
- Xu, X., Flores Cuautle, J. J. A., Kouyate, M., Roozen, N. B., Goossens, J., Menon, P., Malayil Kuriakose, M., Salenbien, R., Rajesh Nair, R., Glorieux, C., Griesmar, P., Martinez, L., & Serfaty, S. (2016). Evolution of elastic and thermal properties during TMOS-gel formation determined by ringing bottle acoustic resonance spectroscopy, impulsive stimulated scattering, photopyroelectric spectroscopy and the hot ball method. Journal of Physics D: Applied Physics, 49(8), 085502. https://doi.org/10.1088/0022-3727/49/8/085502
- Yıldırım-Yalçın, M., Sadıkoğlu, H., & Şeker, M. (2021). Characterization of edible film based on grape juice and cross-linked maize starch and its effects on the storage quality of chicken breast fillets. Lwt, 142, 111012. https://doi.org/10.1016/j.lwt.2021.111012
- Zhao, Y., Mao, X., Shukla, M. K., & Li, S. (2020). Modeling Soil Water–Heat Dynamic Changes in Seed-Maize Fields under Film Mulching and Deficit Irrigation Conditions. MS Binici and EAcs Water, 12(5), 1330. https://doi.org/10.3390/w12051330
- Żołek-Tryznowska, Z., & Kałuża, A. (2021). The influence of starch origin on the properties of starch films: Packaging performance. Materials, 14(5), 1146. https://doi.org/10.3390/ma14051146