
 ?Mathematical formulae have been encoded as MathML and are displayed in this HTML version using MathJax in order to improve their display. Uncheck the box to turn MathJax off. This feature requires Javascript. Click on a formula to zoom.
Abstract
Antibiotic use is an integral part of livestock farms, but their overuse or misuse may result in the occurrence of unsafe level of residues that cause deleterious health effects. A cross-sectional study was performed from December 10/2020 and January 15/2021 to detect and estimate the level of tetracycline, oxytetracycline and penicillin G residues in beef samples intended for public consumption at Dukem and Bishoftu towns, central Ethiopia. Muscle samples were randomly collected from butcheries. Residue levels were determined using liquid chromatography coupled with triple quadrupole mass spectrometer (LC- ESI-QqQ). From 100 beef samples analysed, 10 % contained detectable level of residues of oxytetracycline. It is distributed as 12 % (6/50) at Dukem and 8 % (4/50) at Bishoftu towns. Tetracycline as residue was detected only in one sample that was collected from Dukem, at 9.35 µg/kg simultaneously with oxytetracycline. However, penicillin G was not detected in any of the samples. The levels of oxytetracycline residues (in µg/kg) range from 18.9 to 26.1 at Dukem and from 7.63 to 19.73 at Bishoftu. The mean determined residue levels of oxytetracycline were 22.32 ± 2.38 µg/kg and 15.99 ± 13.2 µg/kg at the two towns, respectively. The levels were much lower than the Maximum Residue Limit (MRL) established for Tetracyclines (TCs) either by EU (100 μg/kg) or Codex (200 μg/kg) guidelines. The determined residue levels are minimum and thus minimizing health risks associated with their consumption, although their detection in few samples and their repeated ingestion might be still associated with a rising concern of antibiotic resistance. Thus, the beef in the study area was acceptable for public consumption with respect to the analyzed three antibiotics.
PUBLIC INTEREST STATEMENT
Medicines are used in animals for different purposes including treatment for different diseases, growth promoting roles as feed additives and prevention from certain diseases. Antibiotics are one class of medicines usually employed in the treatment of infections. They are highly used in livestock farms in Ethiopia and elsewhere. Thus, when humans consume meat and other animal products sourced from animals that had been exposed to antibiotics, residues will remain in the food products. As a consequence, human consumers will be exposed to them. The levels had to be monitored so that the amounts should be in non-detectable or very low levels based on safe levels as stipulated by laws and guidelines. In this study, by using a very sensitive analytical technique (LC/MS/MS), the three antibiotic medicines (oxytetracycline, tetracycline and pencillin G) were assessed from beef meat samples purchased from butcheries of Bishoftu and Dukem towns, near to the capital Addis Ababa, central Ethiopia. The positive detection rate for the presence of antibiotics residues is only 1 in 10, and the amounts are below the legal limits recommended. Hence, the consumers are assumed to be safe from the unwanted health effects associated with meat consumption in these localities with respect to the three specific drugs assessed at that particular period of time.
1. Introduction
Meat is an important component of diet in terms of providing protein. It contains essential micronutrients that are required for growth, development and tissue maintenance. Meat is an excellent source of essential amino acids and vitamins (A, B9, B12, D, and E). It is often considered as a source of highly bioavailable minerals such as iron, copper, calcium, zinc, and selenium (Ahmad et al., Citation2018; Gerber et al., Citation2015). It also constitutes a significant part of economic activities (Gerber et al., Citation2015; Henchion et al., Citation2017).
Globally, the demand for animal protein is steadily rising following the growth of the world population, increase in per-capita income, urbanization and changing standard of living (Henchion et al., Citation2017; Mirkena et al., Citation2018). This has necessitated extensive development of the livestock industry, resulting in the widespread use of antimicrobial agents to increase productivity (Lee et al., Citation2018; Van Boeckel et al., Citation2015). The most widely used classes of antimicrobial agents for this aim are antibiotics (Baynes et al., Citation2016). Generally, antibiotics are used for three main purposes, therapeutic, prophylactic, and as feed additives or growth promoters (Padol et al., Citation2015; Song et al., Citation2016).
However, the indiscriminate uses of antibiotics have been recognized as an important aspect of food safety concerns. This is because residues may persist in food of animal origin threatening the health of consumers (Singh et al., Citation2014). Because of their availability and relatively low costs, Penicillin G (Pen G) and tetracyclines (TCs) are among the most commonly used antibiotics in food animals (Agmas & Adugna, Citation2018; Albayoumi, Citation2015). A veterinary antimicrobial utilization review performed from 2015–2017 in Ethiopia indicates that oxyteracycline is the highest consumed drug, followed by pencillin G. The three years total Defined daily Dose (DDDvet) for cattle shows oxytetracycline of 112,046,087.38, penicillin G as Pen-Strep (Penciliin plus streptomycin) combinations of 43,177,501.54 doses were used over three years. This makes the two drugs that were included in this residue analysis as being the top two most consumed antibiotics in Ethiopian veterinary practice (Andualem, Citation2019). Tetracyclines and penicillin G are used for the treatment of various respiratory, urinary and gastrointestinal tract infections and for the treatment of infectious mastitis in dairy cows (Canzani & Aldeek, Citation2017; Navrátilová et al., Citation2009). Residue levels of penicillin G ingested through meat can trigger skin rashes, asthma, and anaphylactic shock in sensitive individuals even at very low concentrations (Canzani & Aldeek, Citation2017). Tetracycline residues on the other hand can result in progressive and permanent discoloration of teeth in young children (Bhavsar & Thaker, Citation2012; Lemke & Williams, Citation2012). In addition, tetracycline ingested through food residues can damage liver, kidney, and cause gastrointestinal reactions (Schwaiger, Citation2017; B. Wang et al., Citation2021). The most serious concern of antibiotic residues in food is the development and spread of antibiotic microbial resistance (AMR) strains (Forouzan et al., Citation2014; Ventola, Citation2015). Antibiotic resistance poses severe health consequences such as treatment failures, more severe form of diseases, prolonged hospitalization, higher treatment costs, and increased mortality (Canton et al., Citation2021; World Health Organization [WHO], Citation2011). As a result, several countries have restricted or banned the use of antibiotics for growth promoting purposes. This banning has affected the EU since 2006 (Ang et al., Citation2017; Diarra & Malouin, Citation2014; Peng et al., Citation2014) and very recently in China in the year 2020 (Zhang et al., Citation2021). Similarly, the USA has imposed restriction on antibiotics use since 2017 (Magnusson et al., Citation2021).
The occurrence of residues above established safe levels in edible tissues from food animals have been associated with inadequate farm management practices. These include non-observance of the withdrawal periods, the use of a drug in a manner that is inconsistent with its approved label, use of unapproved antibiotics, and prolonged drug excretion (Beyene & Tesega, Citation2014; Diarra & Malouin, Citation2014; Song et al., Citation2016). Additionally, the lack of awareness about drug usage, withdrawal times, and intentional misuse also contribute to elevated levels of drug residues in food products of animal origin (Singh et al., Citation2014).
Though Ethiopia has been a member of Codex Alimentarius commission (CAC) since 1968 (FAO/WHO, Citation2015), clear national guideline is lacking on the permissible levels of antimicrobial residues in foods of animal origin. As most developing countries adopt MRLs established by CAC or EU without requiring additional risk evaluation (Baynes et al., Citation2016), reference has been made to the EU, Codex, and US MRLs for the target antibiotics in the present study as presented in Table .
Table 1. Maximum residue limits for some common antibiotic drugs
In Ethiopia, food animals are not screened for residues before slaughtering (Bedada & Zewde, Citation2012), thus the practice may compromise public health safety due to the potential occurrences of harmful levels of residues. Therefore, the objective of this study was to detect and determine the residues of selected antibiotics (tetracycline, oxytetracycline and penicillin G) in beef muscles collected from Bishoftu and Dukem towns of the East Shewa Zone of Oromiya regional state, Ethiopia. These towns are among the major beef producer and consumer market areas of the country as they are located near the capital city Addis Ababa. Moreover, most of the export abbatoires and intensive commercial farms are also located in and/or in the vicinity of these towns.
2. Materials and methods
2.1.Chemicals and equipments
Reference standards and chemicals utilized in the experiments were of the appropriate grade. The same is true for equipments with respect to best performance and qualifications. The details are given in the supplementary file
All glassware and other apparatuses were scrupulously cleaned and dried in drying cabinet (LEEC, Limited, UK) before use.
Analysis was performed on an Agilent 1290 Infinity II UPLC system coupled to an Agilent 6470 LC/TQ/mass spectrometer (Agilent Technologies Ltd., Singapore) system with MassHunter operating software (version B.06.00). For chromatographic separation, Phenomenex® Synergi hydro-RP, (4.6 mm × 150 mm; 4 µm, 80 A◦, 00F–4375-E0) analytical column with security guard cartridge system (4×3.0 mm) (Phenomenex®, California, USA) was used. The details regarding the LC-QqMS conditions and chromatographic conditions are shown on the supplementary file.
2.1.1. Study design
A cross-sectional study was conducted to determine the level of selected tetracycline, oxytetracycline, and penicillin G residues in the meat samples for sale at butcher shops. Beef samples were collected from Dukem and Bishoftu towns of the East Shewa zone, Oromia, Ethiopia. These towns are among the major beef producer and consumer market areas of the country
2.2. Sample collection procedure and sample size
By assuming a 95% confidence interval (z = 1.96), 48 % positive rate was reported previously (Bedada & Zewde, Citation2012) and a 10% absolute precision desired; a minimum sample size estimate of 96 was obtained using the formula (Thrusfield et al., Citation2018) given below:
For a 95% confidence level, z = 1.96, d is desired absolute precision, p expected prevalence of residue in beef, and n is the sample size. Based on this estimate, the sample size was just raised to 100 for convenience. A total of 100 samples of raw beef muscle were randomly collected between December 2020 and January 2021 from butcheries in the Dukem and Bishoftu towns. An equal proportion of sample (50 each) was allocatted from both Bishoftu and Dukem butcheries, assuming similar practices of beef production and marketing channels linking producers to the terminal markets. About 500 gm per the sampling guideline mentioned in the CAC (codex alimentarius codex) CAC/GL-71, Citation2009) (Alimentarius, Citation2009) fresh muscle tissue samples were purchased at a market value randomly from the sampling points. Each sample was individually packed in properly labeled polyethylene bags, uniquely identified and indelibly labeled. Samples were shipped in icebox to Animal Product, Veterinary Drug and Feed Quality Assessment Center (APVD-FQAC), Akaki-Kality Sub city, Addis Ababa. Once received at laboratory, the fat and connective tissue parts were dissected away from each sample and minced using meat grinder. The homogenized sample was then immediately divided in to halves and kept frozen (≤ −20 °C) until the time for extraction.
2.2.1. Ethical consideration
Ethical approval to carry out this study was obtained from the School of Pharmacy Ethical Review Board (ERB) of Addis Ababa University, with reference number ERB/SOP/36/10/2018, dated May 25/2018.
2.2.2. Sample extraction and clean-up
The frozen ground beef sample was allowed to thaw overnight at 4°C for analysis. Four grams (4.00 ± 0.005 g) of the homogenized sample was weighed in to a 50 ml centrifuge tubes for extraction. The quality control samples were spiked with appropriate volumes of working standards at this stage to obtain 0.5×, 1.0×, 1.5×, 2.0×, 2.5× and 3.0× corresponding MRLs for each analyte. Extraction and cleanup of homogenized beef muscle was adopted from the procedure described by Young and Tran (Citation2015). The steps performed are detailed in the supplementary file. LC-MS operations regarding the LC-QqMS conditions and chromatographic conditions are also shown in the supplementary file.
2.3. Method validation
The method validation was performed on the basis of EU Commission Decision 2002/657/EC (EC, Citation2002) and Codex Alimentarius commission (CAC) guidelines (Alimentarius, Citation2009). The performance requirements assessed included, selectivity, linearity, precision, recovery, decision limit (CCα), detection capability (CCβ), as well as limits of detection and quantification.
The adequacy of system performance was also checked using five replicate injections of standards at concentration equivalent to respective MRLs of target analytes before analysis of actual samples (Bose, Citation2014).
2.3.1. Precision and accuracy
Precision and accuracy, in terms of recovery, were assessed for each analyte using aliquots of a blank matrix, previously shown to be free from target analytes, spiked with working standards in triplicates at concentrations corresponding to 0.5, 1, and 1.5 times the MRLs as set by EU legislation 37/2010 (EU, Citation2009). Precision of the procedure was evaluated in terms of day to day repeatability (Sr) and within-laboratory reproducibility (WR) by single-factor analysis of variance (ANOVA) for the three analysis batches. The recovery was calculated by dividing the mean measured concentration of the analyte at the respective fortification level multiplied by 100 to express the result as a percentage (EC, Citation2002).
2.3.2. Decision limit and detection capability
The decision limit (CCα) is the lowest concentration level that can be detected in a sample with 5% of false positive decision (α = 5%). The detection capability (CCβ) is the concentration at which a method is able to detect the analyte with a statistical certainty of 1 – β (β = 5%). The CCα and CCβ were determined using blank sample fortified at 0.5, 1.0, and 1.5 times the MRLs, in the same experiment as accuracy and precision according to the ISO 11,843–2 calibration curve procedure (BSI, Citation2008; Verdon et al., Citation2006). When the determined concentration is lower than CCα, the sample can be declared compliant at 95% confidence level (EC, 2002).
2.3.3. Compound identification
Commission Decision has introduced a system of identification points (IPs) for confirmation using mass spectrometric detection techniques to generate sufficient and structurally significant product ions. For such purpose, a minimum of three identification points (IPs) have to be acquired. By convention, 1 IP is assigned for the precursor ion and 1.5 IPs for each monitored product ions. Secondly, the retention time (Rt) or relative retention time (RRt) of analyte in chromatogram of sample solution should correspond to that of calibration standard within a tolerance of ±2.5 % relative according to the EU (EC, Citation2002) or within ±0.1 min absolute deviation in accordance with the revised EU guideline (EU Citation2021/808, 2021).
Furthermore, the relative intensities or ion ratio of the diagnostic ions expressed as a percentage of the intensity of the most abundant ion is yet another confirmatory requirement that have to be met. The ion ratio of the analyte have to be compared with a reference standard at designated m/z ratio. It should correspond to that of the matrix-matched standards at comparable concentrations, measured under the same conditions, within maxium permitted relative deviation indicated (Alimentarius, Citation2009; EC, Citation2002).
3. Results and discussion
3.1. Optimization of chromatographic condition
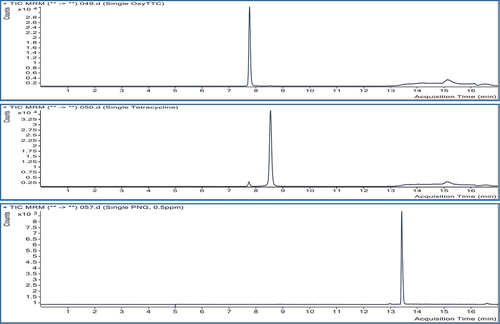
The mobile phase compostion and gradient conditions were optimized for chromatographic peak shapes, resolution, symmetry, and reproducible retention times. The target antibiotics were then eluted individually from the column, and the retention times were identified (shown as figures and also in the supplementary file).
Figure 1. Total ion chromatogram (TIC) of blank sample extract.
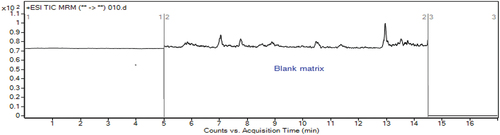
Figure 2. TIC from single injections of standard extract of each analyte.
3.2. Optimization of mass parameters
The optimized mass parameters corresponding to selected precursor ions [M+H]+ are presented in Table . For each of the target compounds, the product ion with the highest intensity was selected for the quantification. The other was used as diagnostic or qualifier ion.
Table 2. Optimum mass parameters for each monitored ions in the analytical work
3.3. Optimum extraction and cleanup procedures
Tetracyclines have a strong tendency to form complexes with metal ions in sample matrices. They can also interact with residual silanol groups in the normal SPE cartridges causing low extraction efficiencies (Bittencourt et al., Citation2012). This had been overcome by using aqueous buffers of chelating agents with organic solvents. Thus, 8 ml of 0.1% formic acid in acetonitrile (MeCN) and 2 ml of 0.1 M Na2EDTA/McIlvaine buffer was chosen as the extraction solution to improve the recovery. Addition of these extractants were made in sequence in order to facilitate efficient protein precipitation and denaturation of enzymes. The precipitated protein and other matrix debris were removed via centrifugation at 4500 rpm for 15 min. Chemical degradations of tetracyclines and pencillin G was prevented by maintaining the extraction solution at a mildly acidic condition (pH 4.00 ± 0.05) that does not favor much of the chemical transformation.
Cleaner samples offer enhanced sensitivity in the detection step, unambiguous identification and confirmation, as well as minimizing time spent on instrument maintenance (Freitas et al., Citation2013). Free silanol groups in the silica-based sorbents interact with tetracyclines, which can lead to significant losses of the analytes during the clean-up step (Khaled, Citation2020; Pena et al., Citation2007). To eliminate such limitations, polymeric sorbents such as hydrophilic-lipophilic balance (HLB) with both polar and non-polar affinities have been used as alternatives (Dasenaki, Citation2015; Khaled, Citation2020). This modified polymer is known to have a very broad selectivity and is suitable for the extraction and cleanup of multiclass antibiotics of diverse physico-chemical properties (Freitas et al., Citation2013). Subsequently, the supernatants obtained were carefully loaded on to Oasis PRiME HLB Cartridges (6 cc/200 mg, 30 µm) and passed through by gravity (Young & Tran, Citation2015), resulting in cleaner extracts. The loaded extract contained high enough acetonitrile content to cause the elution of polar analytes leaving other extraneous sample matrix behind. Furthermore, analyte concentration via solvent evaporation under stream of nitrogen gas was carried out to achieve satisfactory sensitivity (DiRocco et al., Citation2020). The extract evaporation temperature was monitored at temperature not exceeding 45 °C (FSIS, Citation2018). In addition, by gradually increasing the gas pressure from 12 to 14 PSI, the evaporation of MeCN within 90 min was achieved.
3.4. Evaluation of the analytical procedure
In each batch analysis, quality control samples which constituted blank and sample spiked with mixed standards of target analytes were run. This helps to control cross-contamination during the extraction process. It also helps to verify the overall performances of the method for each analyte. The system-suitability check was also performed with five replicate injections of mixed standard solutions at initial stages of batch analysis to monitor instrument performance with regard to analyte response and drift in retention time during the analytical run (Table ).
Table 3. System suitability parameters of the analytical method
3.5. Selectivity
The selectivity of the analytical method was checked by analyzing blank samples and samples fortified or spiked with standards. The chromatograms of the blank samples were then compared with that of spiked sample of target analytes at the expected retention time for each analyte (Bratinova et al., Citation2009; Peris‐Vicente et al., Citation2015). As can be observed from the total ion chromatograms (TIC) in figures & b, the blank samples did not show any significant interferences at the retention time windows for three target analytes, demonstrating good selectivity of the analytical procedure.
Triple LC-QqQ/MS which had been operated in the multiple-reaction monitoring (MRM) mode can significantly reduce background signals from sample matrix and LC solvent clusters. It also improves the detection limits of the analytical procedures (Chung, Citation2007; Hird et al., Citation2014). This was demonstrated in the extracted ion chromatograms of the blank and beef muscle fortified with each of the analytes (shown on figures ) for the two MRM transitions monitored.
Figure 3. TIC of (a) blank sample and (b) sample spiked with standard mix at MRLs.
Figure 4. Extracted ion chromatograms of blank sample showing no interfering peaks.
3.6. Linearity
Calibration standards were prepared by spiking matrix with a known quantity of analyte spanning in the calibration range comprising the lowest and the highest limits of quantification. Blank matrices were spiked at the levels of 0.5, 1.0, 1.5, 2.0, 2.5, and 3.0 times the corresponding MRLs for each compound to obtain a plot of the response signal versus the standard concentrations. Linearity was assessed by visual inspection of a plot of signals or residuals as a function of standard concentration and by appropriate statistical methods.
Figure 5. Positive control sample spiked with standard mix of the analytes at MRLs.
The coefficient of determination (r2), which quantifies the goodness of fit of residuals, was used to further support the linearity of data (Chung, Citation2007). The regression equation (y = ax ± b) and the determination coefficient (r2) were assessed by the least squares method. The y is the response signal or peak, and x is the concentration of standard solution in µg/kg. On the average, r2 values are all greater than 0.98, indicating that there is a good correlation over the range of the concentrations used in constructing the calibration curve (Table ).
Table 4. Calibration data for OTC, TTC and Pen G residue analysis in Beef muscle
3.7. Precision, accuracy, decision limits (CCα) and detection capabilities (CCβ)
For precision and accuracy, three sets of samples of blank muscle matrices from the same cattle were fortified with the analytes, in triplicates, to yield concentrations equivalent to 0.5, 1.0, and 1.5 times the MRLs. These were processed through the whole procedure in order to calculate repeatability, within laboratory reproducibility and percentage recovery of the analytical method.
Since certified matrix materials or incurred matrix materials containing proven amount of drug substances (Zeleny et al., Citation2006) were not available, accuracy was assessed as the percent of recovery on the basis of fortified muscle samples. The average recovery was very satisfactory, ranging from 97.52 % to 111.34 %. Whereas, the repeatability and within laboratory reproducibility range from 1.83 % to 11.14 % and 3.76 to 16.40 %, respectively. The CCα and CCβ were estimated by calibration curve procedure according to ISO11843–2 (BSI, Citation2008). The results obtained are within the limits laid down by Codex and EU guidelines; hence, the precision and recovery of the procedure were suitable to detect and quantify residues of the target antibiotics under the study. The CCα and CCβ values obtained proved to be reliable for confirmatory analysis of the target antibiotics around EU MRLs or at levels much below the codex recommended MRLVDs for the analytes (Table ).
Table 5. Precision, accuracy, decision limits (CCα) and detection capabilities (CCβ)
3.8. Detection and quantification Limits
Limits of detection (LOD) and limits of quantification (LOQ) are not the requirements for the determination of residues of authorized substances because they are monitored around the established legal limits (Nebot et al., Citation2012). However, these parameters were determined to evaluate the usefulness of the procedure to detect target analytes at concentration levels much lower than the respective MRLs.
The method detection limit is defined as the minimum determined concentration that is statistically distinguishable from a blank with 99 % confidence level. So, the methods detection and quantification limits were estimated according to US EPA procedure based on 10 spiked samples undergone through all steps of the method and computed (EPA, Citation2016) as follows:
where LOD is the method detection limit based on spiked samples, t is the single-tailed 99th percentile t statistic for the estimate with n-1 degrees of freedom, and Ss is sample standard deviation of the replicate spiked sample analyses. Thus, the LOD and LOQ (in µg/kg) were, respectively, 1.36 and 4.80 for OTC, 1.66 and 5.90 for TTC, and 2.89 and 10.25 for Pen G.
3.9. Analysis of residues in the test samples
3.9.1. Confirmation of identity
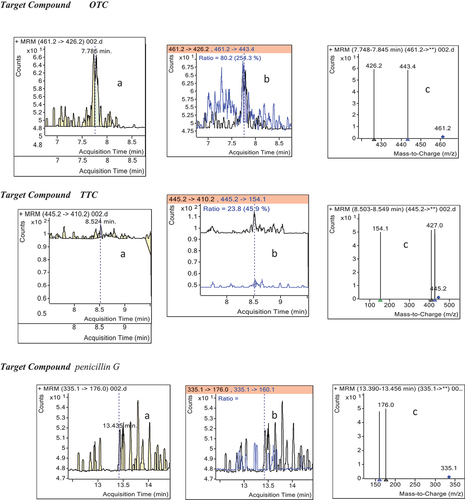
Identification based on retention time, relative ion ratio and system of IPs provides the adequate degree of confidence for confirmatory identification of compounds, limiting the chance of reporting false positive results. Thus, identification of the antibiotics was first carried out by comparing retention times of target compounds with the mean retention time of the fortified reference standards. The mean determined reference retention times (Rt), acquired from the matrix-matched calibration standards, and the corresponding acceptance limits (ALs) for the positive identification of the test samples were summarized in Table .
Table 6. Retention times acquired for OTC, TTC and Pen G reference standards
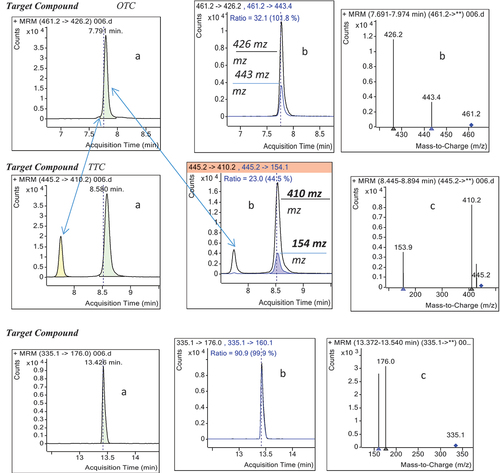
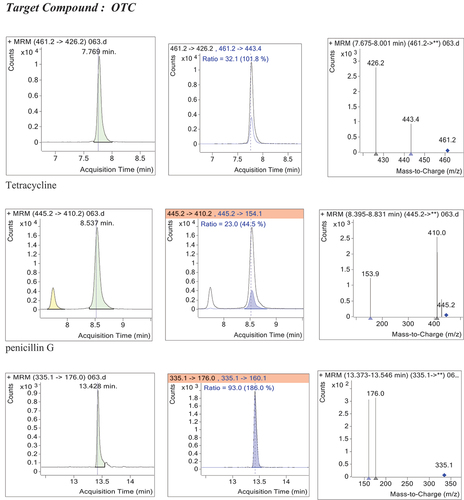
Positive identification is confirmed only for those MRM transitions that simultaneously meet both the retention time and relative ion ratio criteria. For those samples which have met the retention time requirements, the relative ion ratios of target compounds in unknown samples at designated m/z were compared with the relative ion ratio of reference mass spectrum to ensure that they were within acceptable limits as required by the EU guideline (Table ).
Table 7. Relative ion ratios (IR) recorded for OTC, TTC and Pen G reference standards
Typical extracted chromatograms for a sample that was negative (figure that can also be compared with the spiked in figure ) according to the confirmatory criterion and a positive sample (S. figure S8) were shown. These figures are also included in the supplementary file. The positive control sample was found to satisfy the confirmatory requirements. This has demonstrated that the criterion was correctly applied. It also validated the confirmatory decision.
3.9.1.1. Method sensitivity
Method sensitivity was also assessed in addition to the curve linearity. A sensitivity evaluation from the linear regression analysis showed that the slope of the calibration curves were significantly different from zero (P-value <0.05) proving a high sensitivity of the procedure.
3.10. Quantification of residues in the study samples
A total of 100 beef meat (50 samples from each location) were collected and analyzed for the beta-lactam and tetracycline antibiotic residues (tetracycline, oxytetracycline and penicillin G). The results showed that out of the total 100 beef samples that were analyzed, 10 % of the samples contained detectable level of residues of mainly oxytetracycline. The proportion of samples with detectable level of oxytetracycline residues by sample location were 12 % (6/50) at Dukem and 8% (4/50) at Bishoftu towns. Only one sample was recorded with detectable level of oxytetracycline and tetracycline residues simultaneously at Dukem, whereas penicillin G was not detected in any of the samples tested. The levels of oxytetracycline residues (µg/kg) range from 18.9 to 26.1 at Dukem and from 7.63 to 19.73 at Bishoftu butcheries. The mean determined residue concentrations were 22.32 ± 2.38 µg/kg and 15.99 ± 13.2 µg/kg at the two sample areas, respectively (Table ). All determined residue levels were much lower than the MRL established or recommended by either EU (100 μg/kg) or Codex (200 μg/kg) guidelines for tetracyclines residues in muscle samples.
Table 8. Oxytetracycline (OTC), Tetracycline (TC), and Pencillin G (PNG) residue levels in muscle samples in the study areas
Potential health risk associated with the exposure to residue through consumption of the meat by assuming it contains the mean determined concentration of 22.32 ± 2.38 µg/kg OTC residues was estimated using the hazard quotient (HQ) as the ratio of acceptable daily intake (ADI) as recommended for tetracyclines (30 µg/kg bw) by CAC. The estimated annual per-capita meat consumption data of 8 kg/person of meat in Ethiopia (Birhanu, Citation2019) translates to a daily meat consumption of 0.02192 kg/person/day. Thus, the corresponding estimated daily intake (EDI) of OTC for an average adult weight of 60 kg was found to be 0.0003 (0 r 0.03%ADI).
Therefore,
Based on much lower residue level determined as compared to an MRL established for oxytetracycline according to the aforementioned guidelines and the estimated health risk assessment made using the HQ, the examined samples of meat were safe and acceptable for human consumption with regard to the target analytes investigated in this study.
Figure 6. Extracted ion chromatograms (EIC) of blank sample.
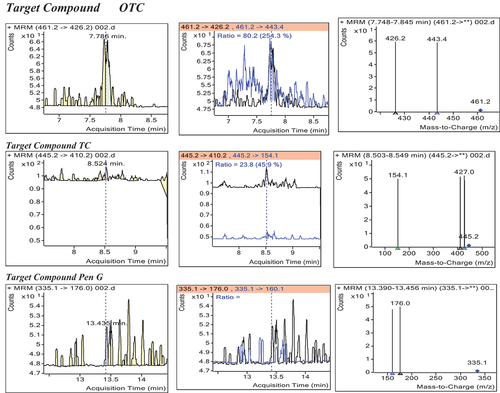
Figure 7. MRM of spiked sample with the three analytes (OTC, TTC and Pen G) at 100 μg/kg.
Analysis of variance (ANOVA) was used to test variability of the two sample areas using the Fischer-Snedecor’s F-test. The F-calculated (5.64) > F-critical (5.32) revealing significant difference in the two samples variances (df = 1, 8; 1- α = 0.95). Therefore, the two-sample t-test of unequal variances was used to test whether the difference between mean determined oxytetracycline residues at the two sample areas was statistically significant or not with 95% confidence level. The t-cal. (2.08) < t-crit (2.13), thus statistically, there was no significant difference between the mean determined oxytetracycline residue levels (df = 4, 1-α = 0.95) at the two sample areas. This is anticipated based on the vicinities of the two towns with each other. Neverthless, the comparison helps to know the difference if any between the two localities to properly advise the consumers and design possible interventions by the stake holders.
3.11. Comparison with other previous studies
The proportion of samples with detectable oxytetracycline residues in this study was lower than that reported in the beef samples from Bishoftu (37.5%), Adama (82.1%), and Addis Ababa (93.8%) slaughterhouses with mean concentrations of 15.92 µg/kg, 64.85 µg/kg, and 108.34 µg/kg, respectively (Bedada & Zewde, Citation2012). No tetracycline residues were detected in any of these samples. Location-wise, the mean determined oxytetracycline concentration in the present study is comparable with that reported by Bedada and Zewde (Citation2012) for beef samples from Bishoftu, all of which were found compliant. Paradoxically, the same authors recorded oxytetracycline residues above EU established MRL (100 μg/kg) at about 48 % in beef muscle collected from both Addis Ababa and Adama slaughterhouses. Agmas and Adugna (Citation2018) reported that out of 250 beef cattle slaughtered in and around Debre Tabor and Bahir Dar towns, 76.4 % were screened positive for the residues of various class of antimicrobials (oxytetracycline, penicillinG-dihydrostreptomycin and sulfonamides including sulfadimidine and diminazene aceturate) using Premi® test kits, a significantly higher than the present findings. However, no information was made available regarding the verification of the performance of the test kits at the point of end user. A more recent study in Eastern Ethiopia from Harar and Diredawa slaughterhouses also reported 84 % oxytetracycline detection, which is much higher than our study (Mohammed et al., Citation2022).
A similar study conducted in Cameroon on beef samples destined for public consumption, using liquid chromatographic tandem mass spectrometer (LC-MS/MS), indicated that 20.3% (41/202) of the samples contained residues of oxytetracycline and penicillin G. The mean determined residue concentrations were 17.58 μg/kg for pen G and 240 μg/kg for oxytetracycline (Ngom et al., Citation2017), which were significantly higher than the present findings. A study by Mgonja et al. (Citation2017) on 60 beef samples from Dodoma region, Tanzania using liquid chromatography-mass spectrometry (LC-MS) reported lower mean residue levels of oxytetracycline (0.69 ± 0.09 μg/kg; 35%). Similarly, a study by Adesokan et al. (Citation2013) reported low level of oxytetracycline and penicillin-G residues in all edible tissues (muscle, kidney and liver) samples from slaughtered cattle in south-western Nigeria. Furthermore, the determined concentrations and prevalences of tetracycline (at Dukem 9.35 μg/kg, 1.0%) and oxytetracycline (Bishoftu: 15.99 µg/kg; Dukem: 22.32 µg/kg) residues in the present study were comparable with the maximum concentration recorded for tetracycline (8.22 μg/kg; 3.3%) and for oxytetracycline (23.44 μg/kg; 18.26%) residues in beef cattle from Saudi Arabia (El-Ghareeb et al., Citation2019), also the incidences in the present finding were relatively lower.
Interestingly, according to surveys conducted in the USA and Europe, only low rates of non-compliant samples with regard to veterinary drug residues in live animals and animal products have been actually reported by confirmatory analysis (Delatour et al., Citation2018). For instance, the European food safety Authority, EFSA annual residue monitoring program for the 2019 in the EU member states, indicated only few non-compliant residues occurred in small proportion of animal species for various antimicrobial drugs tested. Of the 22,109 number of bovine samples analyzed for one or more substances, by 12 EU member countries in the year 2019, only a total of 56 (0.25 %) non-compliant samples were reported (European Food Safety Authority ([EFSA], Citation2021). According to the monitoring data generated in 2020 on the presence of residues of various veterinary medicinal products and certain substances in live animals and animal products in the European Union, Iceland, and Norway, overall frequency of non-compliant samples in 2020 (0.19%) was lower compared to 2019 (0.30%). Specifically, for antibacterial agents (B1 class), only 0.14% of the samples analysed were non-compliant in 2020; the same non-conformity rate was reported in 2019 (European Food Safety Authority ([EFSA], Citation2022) across the different speciesAccording to monitoring survey conducted by the Taiwan Food and Drug Administration (TFDA) over 5-year (2011–2015) period only a small portion of samples contained noncompliant levels of residues for various veterinary drugs. Of the 1487 livestock products inspected, only 7 (0.47%) samples contained residues of various class antibiotics such as β-lactams, sulfonamides and enrofloxacin (Lee et al., Citation2018) not conforming to the regulations. Consistent with above mentioned survey reports, of the 7,767 carcasses samples that were analyzed in FY 2019 in the U.S. National Residue Program (NRP) under the scheduled sampling plan, only 21 (0.27 %) chemical residues violation were found. The list of substances under the scheduled sampling plan included diverse veterinary drugs, pesticides and environmental contaminants (United States Department of Agriculture Food Safety Inspection Service, USDA FSIS, Citation2019). In general according to these data, overall violative residue levels as determined by confirmatory method such as LC-MS/MS were generally low.
4. Conclusion
Antibiotic residues pose food safety concerns because of associated adverse health effects, losses to food processing industries. Antibiotic residues (oxytetracycline presence at 10 % were detected in the present study. The levels found are all below the EU/CAC/USFDA MRLs. Thus the beef availed for market in these towns during that study time is safe for human consumption with respect to the three antibiotic (tetracycline, oxytetracycline, and penicillin G) residues. Neverthless the results of this study may not portray the overall status of antibiotic residue occurrences in the wider areas of the country. It should not also undermine the potential occurrences of residues of other veterinary drugs that are not covered in this study. Further studies are required to ensure the safe use of antibiotics in food animals because of the possibility of misuse leading to harmful levels of residues anywhere at any time point.
5. Availability of data and materials
All data supporting the conclusion in this work had been included in the manuscript and the supplementary file. However any additional detailed procedures and data if needed, upon reasonable request.the correspondent author will offer.
Authors’ contributions
Both GU and AA conceptualized the research. GU did the sample collection and the experiments. AA did the necessary supervision and guidance. GU drafted the manuscript, AA edited it meticulously. All approved the final version of the manuscript submitted.
Supplemental Material
Download MS Word (791.8 KB)Acknowledgments
The authors want to thank Addis Ababa University and Ethiopian Agricultural Authority, Animal Products, Veterinary Drug and Feed Quality Assessment Centre for the support in this research. We want also to thank the butcheries that sold us the samples. We also greatly acknowledge laboratory personnels that assist us in the experimental works.
Disclosure statement
No potential conflict of interest was reported by the author(s).
Supplementary material
Supplemental data for this article can be accessed online at https://doi.org/10.1080/23311932.2023.2242633.
Additional information
Funding
Notes on contributors
Gudeta Uma
Gudeta Uma is an analyst in the Ethiopian Agricultural authority laboratory. He holds BSc in Chemistry and MSc in Pharmaceutical Chemistry (Pharmaceutical analysis and quality assurance stream) from Addis Ababa University.
Ayenew Ashenef
Ayenew Ashenef is an Assistant Professor at the Department of Pharmaceutical Chemistry and Pharmacognosy, School of Pharmacy, College of Health Sciences, Addis Ababa University. He researches on themes that include drug quality and substandard and falsified medicines detection, food composition and quality, analytical method development for pharmaceuticals and other analyses of interest as well as on pharmaceutical policy and regulation. His research is supported by Addis Ababa University, Ministry of innovation and technology, government of Ethiopia, National Institute of Health (NIH), National cancer institute affordable technologies programme grants.
References
- Adesokan, H. K., Agada, C. A., Adetunji, V. O., & Akanbi, I. M. (2013). Oxytetracycline and penicillin-G residues in cattle slaughtered in south-western Nigeria: Implications for livestock disease management and public health. Journal of the South African Veterinary Association, 84(1), 945–20. https://doi.org/10.4102/jsava.v84i1.945
- Agmas, B., & Adugna, M. (2018). Antimicrobial residue occurrence and its public health risk of beef meat in Debre Tabor and Bahir Dar, Northwest Ethiopia. Veterinary World, 11(7), 902–908. https://doi.org/10.14202/vetworld.2018.902-908
- Ahmad, R. S., Imran, A., & Hussain, M. B. (2018). Nutritional composition of meat. Meat Science and Nutrition. InTech. https://doi.org/10.5772/intechopen.77045
- Albayoumi, M. A. (2015). Detection of antibiotic residues in broiler chickens in gaza strip [ Master’s thesis]. Islamic University-Gaza Deanship of Graduate Studies Faculty of Science Biological Sciences Master Program/Microbiology.
- Alimentarius, C. (2009). Guidelines for the design and implementation of national regulatory food safety assurance programme associated with the use of veterinary drugs in food producing animals. CAC/GL, 71(2009), 1–42.
- Alimentarius, C. (2018). Maximum residue limits (MRLs) and risk management recommendations (RMRs) for residues of veterinary drugs in foods. CAC/MRL No. 02/2018.
- Andualem, T. (2019) Veterinary antiimicrobial utilization in Ethiopia. FAO/Ethiopia unpublished report, 2019.
- Ang, J. J. D., Estaniel, S. L. S., & Guidote, L. P. (2017). Extraction and determination of tetracyclines in chicken meat by solid phase extraction and high performance liquid chromatography. Bulletin of University of Agricultural Sciences and Veterinary Medicine Cluj-Napoca-Agriculture, 63, 563–568.
- Baynes, R. E., Dedonder, K., Kissell, L., Mzyk, D., Marmulak, T., Smith, G., & Riviere, J. E. (2016). Health concerns and management of select veterinary drug residues. Food and Chemical Toxicology, 88, 112–122. https://doi.org/10.1016/j.fct.2015.12.020
- Bedada, A. H., & Zewde, B. M. (2012). Tetracycline residue levels in slaughtered beef cattle from three slaughterhouses in central Ethiopia. Global Veterinaria, 8(6), 546–554.
- Beyene, T., & Tesega, B. (2014). Rational veterinary drug use: Its significance in public health. Journal of Veterinary Medicine and Animal Health, 6(12), 302–308.
- Bhavsar, S. K., & Thaker, A. M.(2012). Pharmacokinetics of antimicrobials in food producing animals. In Readings advanced pharmacokinetics – Theory, methods and applications (pp.158–178). https://doi.org/10.5772/33787
- Birhanu, A. F. (2019). A review on ethiopian meat production trends, consumption and meat quality parameters. International Journal of Food Science and Agriculture, 3(4), 267–274. https://doi.org/10.26855/ijfsa.2019.12.002
- Bittencourt, M. S., Martins, M. T., De Albuquerque, F. G. S., Barreto, F., & Hoff, R. (2012). High-throughput multiclass screening method for antibiotic residue analysis in meat using liquid chromatography-tandem mass spectrometry: A novel minimum sample preparation procedure. Food Additives & Contaminants: Part A, 29(4), 508–516. https://doi.org/10.1080/19440049.2011.606228
- Bose, A. (2014). HPLC calibration process parameters in terms of system suitability test. Austin Chromatogr, 1(2), 1–4.
- Bratinova, S., Raffael, B., & Simoneau, C. (2009). Guidelines for performance criteria and validation procedures of analytical methods used in controls of food contact materials. JRC Scientific and Technical Reports, 24105. https://doi.org/10.2788/49046
- BSI. (2008). ISO11843-2: 2000. Capability of detection- Part 2: Methodology in the linear calibration case, 1–34.
- Canton, L., Lanusse, C., & Moreno, L. (2021). Rational pharmacotherapy in infectious diseases: Issues related to drug residues in edible animal tissues. Animals, 11(10), 2878. https://doi.org/10.3390/ani11102878
- Canzani, D., & Aldeek, F. (2017). Penicillin G’s function, metabolites, allergy, and resistance. Journal of Nutrition and Human Health, 1(1), 28–40. https://doi.org/10.35841/nutrition-human-health.1.1.28-40
- Chung, A. (2007). () []. Validation of an ultra performance liquid chromatography tandem mass spectrometry (UPLC™/MS/MS) method for forensic toxicological analysis: Confirmation and quantitation of lysergic acid diethylamide (LSD) and its congeners in forensic samples [ Doctoral dissertation]. University of saskatchewan. http://hdl.handle.net/10388/etd-04202006-102806
- Commission Decision 2002/657/EC. (2002). Implementing council directive 96/23/EC concerning the performance of analytical methods and the interpretation of results. Official Journal European Communities, L221, 8–36.
- Commission Regulation (EU) No 37/2010. (2009, December 22). On pharmacologically active substances and their classification regarding maximum residue limits in foodstuffs of animal origin. (OJL 15/1, 20.1.2010, pp. 1–72).
- Dasenaki, M. (2015). Development of methods for the determination of veterinary drugs in food matrices by liquid chromatography–mass spectrometry [ Doctoral dissertation].
- Delatour, T., Racault, L., Bessaire, T., & Desmarchelier, A. (2018). Screening of veterinary drug residues in food by LC-MS/MS. Background and challenges. Food Additives & Contaminants: Part A, 35(4), 633–646. https://doi.org/10.1080/19440049.2018.1426890
- Diarra, M. S., & Malouin, F. (2014). Antibiotics in canadian poultry productions and anticipated alternatives. Frontiers in Microbiology, 5, 282. https://doi.org/10.3389/fmicb.2014.00282
- DiRocco, M., Moloney, M., Haren, D., Gutierrez, M., Earley, S., Berendsen, B., Furey, A., & Danaher, M. (2020). Improving the chromatographic selectivity of β-lactam residue analysis in milk using phenyl-column chemistry prior to detection by tandem mass spectrometry. Analytical and Bioanalytical Chemistry, 412(18), 4461–4475. https://doi.org/10.1007/s00216-020-02688-4
- El-Ghareeb, W. R., Mulla, Z. S., Meligy, A. M. A., Darwish, W. S., & Edris, A. M. (2019). Antibiotic residue levels in camel, cattle and sheep tis sues using LC-MS/MS method. Journal of Animal and Plant Sciences, 29(4), 943–952.
- EPA. (2016). Definition and procedure for the determination of the method detection limit, Revision 2. Environmental Protection Agency EPA.
- European Food Safety Authority. (2021). Report for 2019 on the results from the monitoring of veterinary medicinal product residues. https://doi.org/10.2903/sp.efsa.2021.EN-1997
- European Food Safety Authority. (2022). Report for 2020 on the results from the monitoring of veterinary medicinal product residues and other substances in live animals and animal products. https://doi.org/10.2903/sp.efsa.2022.EN-7143.
- European Union. (2021). /808/EC. Commission implementing Regulation (EU) 2021/808 of 22 March 2021 on the performance of analytical methods for residues of pharmacologically active substances used in food-producing animals and on the interpretation of results as well as on the methods to be used for sampling and repealing decisions 2002/657/EC and 98/179/EC. Offical Journal of the European Union, 2021(L180), 84–109.
- FAO/WHO. (2015). Codex alimentarius commission, procedural manual (24th ed). http://www.codexalimentarius.org
- Forouzan, S., Rahimirad, A., Seyedkhoei, R., Asadzadeh, J., & Bahmani, M. (2014). Determination of antibiotic residues in the pasteurized milk produced in West Azerbaijan province, North West of Iran. Journal of Coastal Life Medicine, 2(4), 297–301.
- Freitas, A., Leston, S., Barbosa, J., & Ramos, F. (2013). Liquid chromatography: Review on the last developments on the detection of antibiotics in food-producing animals. In Liquid chromatography – principles, technology and applications (pp. 99–139).
- FSIS, U. (2018). Screening and confirmation of animal drug residues by UHPLC-MS-MS. 1–53. CLG-MRM1.08.
- Gerber, P. J., Mottet, A., Opio, K. I., Falcucci, A., & Teillard, F. (2015). Environmental impacts of beef production: An overview of sustainability challenges and prospects. Meat Science, 109, 2–12. https://doi.org/10.1016/j.meatsci.2015.05.013
- Henchion, M., Hayes, M., Mullen, A. M., Fenelon, M., & Tiwari, B. (2017). Future protein supply and demand: Strategies and factors influencing a sustainable equilibrium. Foods, 6(7), 53. https://doi.org/10.3390/foods6070053
- Hird, S. J., Lau, B. P. Y., Schuhmacher, R., & Krska, R. (2014). Liquid chromatography-mass spectrometry for the determination of chemical contaminants in food. Trends in Analytical Chemistry, 59, 59–72. https://doi.org/10.1016/j.trac.2014.04.005
- Khaled, A. (2020). Automated high-throughput analysis of multi-class multi-residue pharmaceutical drugs in animal tissue using solid phase microextraction [ Doctoral dissertation]. University of Waterloo.
- Lee, H. C., Chen, C. M., Wei, J. T., & Chiu, H. Y. (2018). Analysis of veterinary drug residue monitoring results for commercial livestock products in Taiwan between 2011 and 2015. Journal of Food and Drug Analysis, 26(2), 565–571. https://doi.org/10.1016/j.jfda.2017.06.008
- Lemke, T. L., & Williams, D. A. (Eds.). (2012). Foye’s principles of medicinal chemistry (7th ed.). Lippincott Williams & Wilkins.
- Magnusson, U., Moodley, A., & Osbjer, K. (2021). Antimicrobial resistance at the livestock-human interface: Implications for veterinary services. Revue Scientifique et Technique de l’OIE, 40(2), 1–19. https://doi.org/10.20506/rst.40.2.3241
- Mgonja, F., Mosha, R., Mabiki, F., & Choongo, K. (2017). Oxytetracycline residue levels in beef in Dodoma region, Tanzania. African Journal of Food Science, 11(2), 40–43. https://doi.org/10.5897/AJFS2016.1532
- Mirkena, T., Mikecz, O., & Pica-Ciamarra, U. (2018). An integrated snapshot: Ethiopia, cattle sector. Africa sustainable livestock 2050. Food and Agriculture Organization of the United Nations.
- Mohammed, N., Adare Mengistu, D., Abdurehman, A., Belina, D., & Mengistu, S. (2022). Determination of tetracycline residues in kidney and muscle of beef cattle slaughtered in Dire Dawa and Harar municipal abattoirs, Eastern Ethiopia. Environmental Health Insights, 16, 11786302221109720. https://doi.org/10.1177/11786302221109720
- Navrátilová, P., Borkovcová, I., Dračková, M., Janštová, B., & Vorlová, L. (2009). Occurrence of tetracycline, chlortetracycline, and oxytetracycline residues in raw cow’s milk. Czech Journal of Food Sciences, 27, 379–385.
- Nebot, C., Regal, P., Miranda, J., Cepeda, A., & Fente, C. (2012). Simultaneous determination of sulfonamides, penicillins and coccidiostats in pork by high-performance liquid chromatography–tandem mass spectrometry. Journal of Chromatographic Science, 50(5), 414–425. https://doi.org/10.1093/chromsci/bms021
- Ngom, R. R. B. V., Garabed, R. B., Rumbeiha, W. K., Foyet, H. S., Schrunk, D. E., Shao, D., & Pagnah, A. Z. (2017). Penicillin-G and oxytetracycline residues in beef sold for human consumption in Maroua, Cameroon. International Journal of Food Contamination, 4(1), 17–27. https://doi.org/10.1186/s40550-017-0062-x
- Padol, A. R., Malapure, C. D., Domple, V. D., & Kamdi, B. P. (2015). Occurrence, public health implications and detection of antibacterial drug residues in cow milk. Environmental We International Journal Science Technology, 10(2015), 7–28.
- Pena, A., Lino, C. M., Alonso, R., & Barcelo, D. (2007). Determination of tetracycline antibiotic residues in edible swine tissues by liquid chromatography with spectrofluorometric detection and confirmation by mass spectrometry. Journal of Agricultural and Food Chemistry, 55(13), 4973–4979. https://doi.org/10.1021/jf070398j
- Peng, M., Salaheen, S., & Biswas, D. (2014). Animal health: Global antibiotic issues. In Encyclopedia of agriculture and food systems (pp. 346–357). Elsevier Inc.
- Peris‐Vicente, J., Esteve‐Romero, J., & Carda‐Broch, S. (2015). Validation of analytical methods based on chromatographic techniques: An overview. Analytical Separation Science, 1757–1808.
- Schwaiger, B. (2017). Development and validation of a routine UHPLC-MS/MS method for determination of veterinary drug residues in animal derived food stuff [ Doctoral dissertation]. uniwien. https://youtu.be/woWUkVX34Q0
- Singh, S., Shukla, S., Tandia, N., Kumar, N., & Paliwal, R. (2014). Antibiotic residues: A global challenge. Pharma Science Monitor, 5(3), 184–197.
- Song, C., Zhang, C., Fan, L., Qiu, L., Wu, W., Meng, S., Hu, G., Kamira, B., & Chen, J. (2016). Occurrence of antibiotics and their impacts to primary productivity in fishponds around Tai Lake, China. Chemosphere, 161, 127–135. https://doi.org/10.1016/j.chemosphere.2016.07.009
- Thrusfield, M. V., Christley, R., Brown, H., Diggle, P. J., French, N., Howe, K., Kelly, A., Sargeant, J., & Wood, H. (2018). Veterinary epidemiology (4th ed.). John Wiley & Sons Ltd.
- U.S. Department of Agriculture Food Safety Inspection Service, USDA FSIS. (2019) . National residue program for meat, poultry, and egg products FY 2019 residue sample results. Food Safety and Inspection Service Office of Public Health Science.
- Van Boeckel, T. P., Brower, C., Gilbert, M., Grenfell, B. T., Levin, S. A., Robinson, T. P., Teillant, A., & Laxminarayan, R. (2015). Global trends in antimicrobial use in food animals. Proceedings of the National Academy of Sciences, 112(18), 5649–5654. https://doi.org/10.1073/pnas.1503141112
- Ventola, C. L. (2015). The antibiotic resistance crisis: Part 1: Causes and threats. Pharmacy and Therapeutics, 40(4), 277–283.
- Verdon, E., Hurtaud-Pessel, D., Sanders, P., & Sanders, P. (2006). Proficiency study for the determination of nitrofuran metabolites in shrimps. Food Additives & Contaminants, 23(6), 569–578. https://doi.org/10.1080/02652030500460534
- Wang, B., Xie, K., & Lee, K. (2021). Veterinary drug residues in animal-derived foods: Sample preparation and analytical methods. Foods, 10(3), 555–586. https://doi.org/10.3390/foods10030555
- World Health Organization. (2011) . Tackling antibiotic resistance from a food safety perspective in Europe. World Health Organization. Regional Office for Europe.
- Young, M. S., & Tran, K. (2015). Oasis PRiME HLB cartridge for effective cleanup of meat extracts prior to multi-residue veterinary drug UPLC-MS analysis. Waters Application, 1–3.
- Zeleny, R., Ulberth, F., Gowik, P., Polzer, J., van Ginkel, L. A., & Emons, H. (2006). Developing new reference materials for effective veterinary drug-residue testing in food-producing animals. TrAc Trends in Analytical Chemistry, 25(9), 927–936. https://doi.org/10.1016/j.trac.2006.04.011
- Zhang, Y., Lu, J., Yan, Y., Liu, J., & Wang, M. (2021). Antibiotic residues in cattle and sheep meat and human exposure assessment in southern Xinjiang, China. Food Science & Nutrition, 9(11), 6152–6161. https://doi.org/10.1002/fsn3.2568