
 ?Mathematical formulae have been encoded as MathML and are displayed in this HTML version using MathJax in order to improve their display. Uncheck the box to turn MathJax off. This feature requires Javascript. Click on a formula to zoom.
Abstract
Knowledge of genetic diversity is essential for the effective planning of breeding experiments and successful development of an improved variety. Therefore, this study was aimed at assessing the genetic diversity of 196 sugarcane genotypes. The experiment was conducted in a parietal-balanced lattice design with two replications. Data on 13 agromorphological and five biochemical traits were collected and analyzed using both univariate and multivariate statistical methods. Cluster analysis grouped the entire sugarcane genotypes into five, two, and six distinct clusters, respectively, based on agro-morphological, and biochemical traits, and their combinations. The highest intercluster distances were found in clusters three and five from a study of agro-morphological traits and clusters four and five from a combination of agro-morphological, and biochemical traits. The highest intercluster distance values indicate the presence of substantial genetic variability between the genotypes of the pairing clusters, due to highly contrasting and complementing traits as demonstrated by cluster mean analysis, notably for cane and sugar yields. This suggests that cultivars with greater cane and sugar yields can be created by hybridization between the genotypes of the two divergent clusters. Cluster mean analysis based on agro-morphological and biochemical traits revealed that Cluster One genotypes have the highest average sugar yield, suggesting that these genotypes are ideal for selection and hybridization to enhance this particular trait. Generally, the evaluated genotypes have potential diversity in their agro-morphological and biochemical traits, which could be exploited. Additionally, a study of the molecular genetic diversity of these genotypes is required to complement the results of this study.
1. Introduction
Sugarcane (Saccharum spp.) is a tall perennial tropical and subtropical grass that belongs to the tribe Andropogoneae of the family Gramineae and the genus Saccharum (Amalraj & Balasundaram, Citation2006). It is one of the most efficient converters of solar energy and converts about 2% of the available solar energy into chemical energy, sugar (Birru, Citation2016; Naturland, Citation2001); with exceptionally high sucrose accumulation features (Wang et al., Citation2013). It produces several tillers with high ratooning ability, high photosynthesis, and fast growth rates and so has one of the highest biomass production potential among cultivated plant species, followed by Miscanthus, Maize, and Switchgrass (Heaton et al., Citation2008; Kandel et al., Citation2018; Racedo et al., Citation2016). These outstanding characteristics make sugarcane the most preferred crop for sugar, and bioenergy production (Yang et al., Citation2020).
Of the 5 billion hectares of land worldwide suitable for farming, which is about 38% of the total land area, about one-third is used as cropland (FAO, Citation2020). Of these, sugarcane is grown on about 26.8 million hectares (FAOSTAT, Citation2019). It is one of the 10 most widely cultivated crop species in the world in terms of production volume and acreage (Selman-Housein & Miranda, Citation2000). With a total annual sugar production of 1.9 million tons in 2020 (FAO, Citation2021; Katia et al., Citation2019), it covers 21% of the total world crop production, followed by maize (12%, with 1.2 million tons), rice, and wheat (8%, with 0.8 million tons each) (FAO, Citation2021).
It is grown as commercial crop in more than 100 countries across all populated continents (Afghan et al., Citation2023; DaCosta et al., Citation2011; Fernandes & Griffin, Citation2016; Ruggeri & Corsi, Citation2019), with an average yield of 70.9 tons of cane per hectare (FAOSTAT, Citation2019). It is an important global food and energy crop that accounts for the world’s 80% of sugar and 60% of bioethanol production (Yang et al., Citation2020), while the remainder is almost entirely from sugar beets (Plaza-Diaz & Gil, Citation2016).
In Ethiopia, sugarcane is cultivated on more than 100 thousand hectares (Melaku et al., Citation2022). Each year, the Ethiopian Sugar Industry produces 25,388 m3 of bioethanol in addition to 400,000 tons of sugar (Esayas et al., Citation2018). Ethiopia’s sugar industry, which is solely dependent on sugarcane, also contributes in a number of other ways to the socio-economic growth of the nation. The production of sugar for domestic and industrial use, income generation from bioethanol, electric power generation and other by-products, and creation of jobs are only a few of its contributions (Esayas et al., Citation2016b; Kebede et al., Citation2013; Teklemariam, Citation1991).
Besides the proven suitability of Ethiopia’s climate and soils for sugarcane production (Anonymous, Citation2014; Semiea et al., Citation2019), the country has an identified suitable land area of 1.39 ha (Rezene, Citation2009).
The annual production of sugar in Ethiopia, however, is insufficient to meet the domestic demand, thus sugar imports from abroad were used to fill the gap. Additionally, the production of cane and sugar is decreasing drastically. Cane productivity per hectare per year in the major sugar mills falls from 166 to 84, 140 to 101, and 165 to 157 t/ha, respectively, for Finchaa, Wonji, and Metahara sugar estates from 1998 to 2019 harvesting years (Belay et al., Citation2023). From 1997 to 2008, 1969 to 2008, and 1954 to 2008, the average decline in cane yield per hectare for Finchaa, Wonji-shoa, and Metahara sugar estates was 26.63%, 48.63%, and 49.03%, respectively (Tesfaye, Citation2021). This led to an even wider disparity between supply (400,000 t/year) and demand (about 600,000 t/ha). One of the primary reasons for the decline in cane, and sugar productivity was the shortage of high-yielding improved sugarcane varieties (Esayas et al., Citation2016a; Kebede et al., Citation2013).
So far, over 10,000 varieties have been collected; however, the majority of the cultivars tested were unable to adapt to the diverse agro-ecological conditions of Ethiopia. Thus, only a small number of (6–7) cultivars are currently grown extensively throughout the Ethiopian Sugar Estates (Esayas et al., Citation2016a).
Thus, the development of own high yielding improved sugarcane varieties adaptable to the various agro-ecologies of the sugarcane plantations, to offset the productivity decline and bridge the gap between demand, and supply is imperative. To develop an improved sugarcane variety through breeding, availability of genetic diversity is a pre-requisite. The development of an improved variety capable of producing better yield under diverse agro-climatic conditions depends on the amount of genetic variability present in the germplasm for the trait (Mondini et al., Citation2009). Even though morphological, and biochemical markers have some limitations as compared to molecular markers, they are reflections of the true genetic potential of the genotypes under real field conditions, and thus, represent the variation in the genic region of the genome resulting in phenotypic expression. Agro-morphological and biochemical markers are the most direct and the strongest predictors of a crop’s agronomic value. With the aid of quantitative and qualitative traits, it is possible to distinguish genetic variation from phenotypic variation (Govindaraj et al., Citation2015). Therefore, they remain to be important techniques for identification, selection, and utilization in sugarcane crop improvement.
The extent and distribution of genetic diversity in germplasm collections are essential for their proper maintenance and use in plant breeding (Esayas et al., Citation2016). The study of genetic diversity helps to understand the genetic relationships among study materials, associations among traits, and attributes that contribute most to diversity, and thus identify genotypes and traits that are candidates for selection and hybridization.
The use of improved sugarcane varieties is essential for increasing productivity. The annual productivity gain from plant breeding is about 1% (Berding et al., Citation2004; Hogarth, Citation1976). The release of superior sugarcane clones resulted in productivity increases of 0.64% in Barbados (Simmonds, Citation1979); 1.1% in Hawaii (Plucknett & Smith, Citation1986); 20% in central and southern Queensland (Cox & Hansen, Citation1995); and 31% in Australia (Berding & Skinner, Citation1987). Most productivity increases resulted from increased biomass or agromorphological traits rather than increases in sugar content or biochemical traits (Simmonds, Citation1979).
Studies on sugarcane genetic diversity based on agro-morphological and biochemical traits have been conducted in Ethiopia (Esayas et al., Citation2016; Mebrahtom et al., Citation2016). However, the nature of the genetic material and the environmental conditions to which the material is exposed determine the extent of variability (Dabholkar, Citation1992; Falconer & Mackay, Citation1996). In addition, 178 (90.82%) of the test materials were F1 crosses germinated from recently introduced hybrid seeds and their performances were unknown. Of the remaining genotypes (18), 15 were uncharacterized old collections, while three were standard check varieties.
Thus, the current study aimed to generate scientific information on the extent and pattern of genetic diversity for these materials that could be used together with the previous study results for further planning of selection and hybridization experiments.
2. Materials and methods
2.1. Test environment
Metahara Sugar Estate in Ethiopia hosted the field trial during May 2021 to November 2022 growing season. The Metahara sugar plantation is situated in the Fantale Woreda area of the Oromia Regional Government State, Eastern Shewa Zone, some 210 km from Addis Ababa and 10 km south of Metahara town. Its coordinates are 8°51’N and 39°52’E, and its elevation is 950 m above sea level. With a mean annual rainfall of 554 mm and minimum and highest annual temperatures of 17.5°C and 32.6°C, respectively, the region has a semi-arid climate (ESDA Ethiopian Sugar Development Agency, Citation2009). The area’s average relative humidity, sunshine hours, and wind speed are 77.44%, 8:46 AM, and 4.12 m/s, respectively (Abera et al., Citation2016).
3. Plant materials
The plant materials consisted of 196 sugarcane genotypes from different countries. Among these, 184 sugarcane genotypes were exotic, while 12 were local collections, landraces. Among the exotic materials, 179 (178 genotypes germinated at Wonji Research Center from hybrid seed and one standard check) were imported from Barbados by Sugarcane Variety Improvement Research Program of the Ethiopian Sugar Industry Group. The remaining four were imported from Mexico, and one from South Africa (Supplemental Table S1). The 178 genotypes were selected for the study as they were not yet evaluated for their yield potential in the designed experiment and thus their performances were unknown. Among the remaining 18, three genotypes (one local, and two exotic) were standard check varieties, while information for the four old collections from Mexico and 11 local collections were scant.
4. Experimental design and management
The experiment was arranged in a partially balanced lattice design with two replications, each having 14 incomplete blocks. Each incomplete block nested under a replication comprised 14 plots, each with three rows of 5 m in length and 1.45 m between rows, with a plot area of 21.75 m2. Following an end-to-end planting method, each row was planted with cane that was 7 months old and had 17 three bud setts. Plot, adjacent incomplete block, and border spacing were all separated by 1.5, 2.9, and 5 m, respectively. Genotypes of sugarcane were planted in an irrigated (furrow irrigation) area with well-prepared, light soil (Cambisol). The Metahara sugar estate’s standards were followed in the execution of all agronomic management practices. The commercial standards NCo-334 and B52–298, as well as the recently released sugarcane variety Kay Shenkora, were used as controls.
5. Data collection
5.1. Agro-morphological traits’ data collection
The study made use of the USDA-ARS’ (GRIN, Citation2004) descriptors for quantitative agro-morphological and biochemical parameters of Saccharum species. A total of 18 quantitative traits, including 13 agro-morphological and five biochemical traits, were scored at the relevant plant growth stages. A list of the quantitative traits used in the analysis, along with their descriptors and codes, was provided (Supplemental Table S2).
For each genotype, data were collected on the number of sprouted buds, number of tillers, number of stalks, plant height (m), stalk length (cm), stalk diameter (cm), single cane weight (kg), number of internodes, internode length (cm), and cane yield (qt/ha). Data for the number of sprouted buds were collected 30 and 45 days after planting, while data for the number of tillers were collected three, four, and five months after planting. However, for plant height and number of stalks, data were collected 10 months after planting. For the number of sprouted buds, number of tillers, and number of stalks, data were taken from the middle row and calculated on a plot basis.
For stalk length (m), stalk diameter (cm), single cane weight (kg), number of internodes per stalk, internode length (cm), and cane yield (t/ha), data were taken from 10 randomly chosen tagged middle plants from the middle row at harvest or 18 months after planting. Cane yield per hectare was calculated from [(Cane yield per plot/Net Plot Area) × 10,000 m2]. Where cane yield per plot is computed as a product of single cane weight and the number of millable stalks per plot [Average single cane weight × total number of millable stalks per plot].
6. Biochemical traits data collection
Data for Brix percent, Pol percent, and Purity percent in juice were measured from the composite juice of 10 cane stalk samples at 18 months after planting or at harvest.
7. Brix or total soluble solids content in juice (Brix %)
At the Metahara Research Station, the juice was extracted from 10 stalks for each genotype using a Jeffco cane crusher (Wm M’KINNON E. Co. LTD, ABREDEEN, SCOTLAND, Model: 7908). Then, the method outlined by Meade and Chen (Citation1977) was used to determine the Brix percent in juice from a composite juice sample of 10 stalks representative of each genotype. A 150 ml sample of the extracted composite juice was taken, and it was filtered using Whatman No. 91 filter paper and filter aid (kieselguhr). The Brix percent was then calculated using the juice filter (clear juice) and a precision refractometer set at 20°C, which provides a direct reading of the refractometric dry substance (Brix or soluble solids) from the refraction angle in juice. The refractometer reading is equivalent to the Brix percentage of the juice.
8. Pol (polarization percent in juice) (pol %)
The concentration of Pol in juice was determined using Horne’s dry lead acetate method described (Meade & Chen, Citation1977). The composite juice sample at 300 ml was mixed with lead acetate (1 g/100 mL) before being allowed to flocculate for around 30 s.
The flocculated sample was filtered via filter paper from which 200 ml clear juice was polarized at 20°C in order to obtain the pol reading using a precision polarimeter. Then, the Polarimeter reading was multiplied by the corresponding Brix and pol reading values from Table.
9. Purity percent in juice (Purity %)
Purity percent in juice was derived from ratio of pol percent to Brix percent.
Purity percent (Purity %)
10. Estimable recoverable sucrose percent (ERS %)
According to Kassa’s (Citation2010) description for the indirect method of cane juice analysis, the estimated recoverable sucrose percent was computed using the Winter Carp formula. The estimated recoverable sugar percentage (ERS %) is equal to ((Pol% - (Brix % - Pol %))*0.7)*0.75. Where 0.75 represents the correlation factor between theoretical yields of molasses mixed juice as established by milling test for Metahara sugar estate, and 0.7 represents the quantity of sucrose lost in the final processing.
10.1. Sugar yield
Data for sugar yield per hectare was obtained from the product of cane yield per hectare and estimable sucrose percent.
11. Statistical analysis
Prior to conducting univariate and multivariate analysis, the data collected were checked for the validity of the ANOVA assumptions. Tukey’s multiple-range test (HSD) was used at a probability level of 1% to test the effects of replication, block (replication), and genotype on the mean performance of the traits of the test material, while the t-test was used at a probability level of 5% to test the degree of difference between the mean performances of the exotic and local landraces and between the genotypes from hybrid seed and other genotypes considered. Prior to principal component and cluster analysis, the means of quantitative agromorphological and biochemical variables were standardised using the R programming language to a mean of zero and variance of one in order to prevent variations resulting from discrepancies in data scale. The average linkage approach with the unweighted pair group method based on arithmetic average (UPGMA) was used in cluster analysis to perform agglomerative hierarchical cluster analysis based on Euclidean distance (UPGMA).
Estimates of the genetic distance between genotypes were carried out based on the mean performance of agro morphological and biochemical traits using the Euclidean distance formula given as:
D(x, y) = [2]1/2 (Gan et al., Citation2007), where D(x, y) represents the Euclidean distance between genotype x and y.
Following the Euclidean distance matrix, agglomerative hierarchical cluster analysis was computed using the method described by Lance and Williams (Citation1967), which specifies that when clusters i and j agglomerated into a new cluster, the dissimilarity between their union and another cluster k was computed using the formula:)
. Where the four coefficients: αi, αj, β, and ϒ are specified by the agglomerative criterion. In the UPGMA method,
;
, β = 0, and ϒ = 0. Where
and
are the number of genotypes in cluster i and j, respectively. Then, the distance between two clusters based on Euclidean distance was computed as:
, where Tij is the sum of all pairwise distances between cluster i and cluster j. At each stage of hierarchical clustering, the clusters i and j, for which d (i, j) were the minimum, are merged. At each stage of hierarchical clustering, the clusters i and j, for which d (i, j) were the minimum, are merged. Then, for each trait inside each cluster, inter- and intra-cluster distances as well as cluster means were calculated. R Studio (2020) with different statistical packages was used for both univariate and multivariate analysis.
12. Results and discussion
Genetic variability is a building block for genetic diversity, always measured in individuals, and can only be estimated for selection of individuals from a population. Thus, variability based on analysis of variance, means, summary of the ranges between maximum and minimum mean performance values, and range units for the 13 quantitative agro-morphological, and five biochemical traits computed is presented in Table .
Table 1. Results of variability analysis of 13 agro-morphological and five biochemical traits of 196 sugarcane genotypes evaluated on light soil (Cambisol) at Metahara sugar estate during May 2021 to November 2022
13. Variability based on analysis of variance (ANOVA)
In Table , the findings of the analysis of variance for 13 agromorphological and five biochemical traits are shown. Analysis of variance for 13 agromorphological and five biochemical traits elucidated that the mean square values for all the 18 variables had a very highly significant variation across the assessed sugarcane genotypes (p < 0.001, using 1% Tukey multiple-range test). This indicates that there was adequate variation among the materials chosen for this investigation and implies the suitability of selection for the enhancement of the sugarcane crop.
For the number of stalks and stalk diameter, similar findings to those of the current study were reported by Alam et al. (Citation2017), Esayas et al. (Citation2018), Feyissa et al. (Citation2014), and Gowda et al. (Citation2016). In addition, the results of previous studies on cane yield, recoverable sucrose percentage, and sugar yield (Esayas et al., Citation2018; Feyissa et al., Citation2014), as well as internode length, stalk length, brix, and single cane weight (Alam et al., Citation2017; Esayas et al., Citation2018; Gowda et al., Citation2016), are consistent with those of the current study. The findings of this study are also consistent with the reports of Alam et al. (Citation2017) and Esayas et al. (Citation2018) for plant height; Esayas et al. (Citation2018), and Gowda et al. (Citation2016) for brix, pol, and purity percent; and Esayas et al. (Citation2018) for the number of sprouted buds per plot. The presence of variability in these traits suggests that improved sugarcane varieties of these traits could be developed via selection and hybridization.
All of the traits considered in the study had a very highly significant variation for replication, with the exception of internode length (IL), stalk diameter (SD), Brix, Pol, Purity, and estimable sucrose percent. However, the mean squares of blocks within replication showed non-significant variation for all other traits except for the number of sprouted buds 45 days after planting (SPN45), number of tillers 3 months after planting (TL3MAP), plant height 10 months after planting (PH10MAP), cane yield (CY) (t/ha), and sugar yield (SY) (t/ha). The significant mean square values for replication indicate that the replication of the experiment was effective in overcoming the confounding effects of field variability. This implies that the experiment’s data accurately reflect genotype performance, with few environmental impacts arising from confounding effects of field variability.
Similarly, little field variability existed between blocks within a replication, as seen by the non-significant differences of blocks’ mean square values. This implies that the variability between blocks within the replication had little variability. The coefficient of determination values ranged from 63.80% to 84.57%. The number of sprouted buds 30 days after planting (SPN30) had the highest value (R2; 84.57%), while the lowest was in purity percent (R2; 84.57%). The coefficients of variation (CV) values ranged from 2.30% to 29.20%, and thus, appeared to be moderate and within the permissible range. Similarly, higher CV values for data derived from other data sets like cane and sugar yield were reported in sugarcane (Esayas et al., Citation2016).
14. Agro-morphological and biochemical traits’ variability based on range
For the sugarcane genotypes considered in the current study, most of the quantitative agro-morphological traits considered showed relatively large range unit values or wide ranges between the maximum and minimum mean performance values. Among all the agro-morphological traits evaluated, the number of tillers per plot at 3 months after planting (TL3MAP) had the largest range (8.44–170.420 tillers per plot), extending to a range of units of 161.97 tillers per plot, with a mean performance value of 59.49 tillers per plot. Similarly, there were 12.69–162.34 tillers per plot (range units: 149.65) with a mean value of 70.46 tillers per plot 4 months after planting (TL4MAP). Tillers per plot ranged from 24.93 to 160.5 (range unit: 135.57) 5 months after planting (TL5MAP), with a mean performance value of 73.99 tillers. Ten months after planting, the number of stalks per plot (SC10MAP) showed a range of 28.13 to 115.77 stalks per plot (range unit: 87.64), with a mean performance value of 64.96 stalks per plot. TL4MAP, TL5MAP, and SC10MAP were thus ranked second, third, and fourth, respectively.
The sugarcane genotypes under the current study displayed a significant degree of variability for these traits, as seen by the larger range of unit values between the genotypes for the number of tillers and stalks per plot.
Accordingly, it is possible to develop sugarcane genotypes with increased numbers of tillers and stalks by choosing the particular genotypes from the investigated materials that produced the most tillers and stalks. Esayas et al. (Citation2018) and Pandey et al. (Citation2018) reported high variability in the number of tillers in sugarcane, which is consistent with the present result.
In addition, large ranges of mean performances were found for four traits: the number of sprouted buds per plot at 30 days after planting (range unit; 43.85), the number of sprouted buds per plot 45 days after planting (range unit; 45.52), cane yield in tons per hectare (CY) (t/ha) (range unit; 28.75), and the number of internodes per stalk (NI) (range unit; 17.75). A large range of values for these traits indicate large variability that should be exploited to further enhance these traits through selection of genotypes with these superior traits. High variability in cane yield, number of internodes, and sprouted buds were observed in studies by Esayas et al. (Citation2018), Gowda et al. (Citation2016), and Kumar et al. (Citation2018).
The other five agro-morphological variables, including internode length (mean: 9.42 cm; range: 5.58–13.83 cm; range unit: 7.98 cm), plant height (mean: 1.91 m; range: 1.10–2.63 m, range unit: 1.53 m), stalk diameter (mean: 2.65 cm; range: 1.93–3.42 cm, range unit: 1.49 cm), stalk length (mean: 2.82 m; range: 1.76–3.99 m, range unit: 2.23 m), and single cane weight (mean: 1.67 kg; range: 0.95–2.86 kg, range unit: 1.91 kg), showed quite modest ranges in mean performances. The moderate value in range units indicates presence of modest variability between the genotypes for these traits, suggesting that acceptable improvements to these traits could be attained through selection of genotypes with the best traits. Variability in single cane weight (Esayas et al., Citation2018; Gowda et al., Citation2016), stalk length (Gowda et al., Citation2016), plant height (Abdul et al., Citation2017; Esayas et al., Citation2018; Gowda et al., Citation2016), internode length, and stalk diameter (Esayas et al., Citation2018) were reported, which agrees with the current result.
One of the biochemical traits, sugar yield (SY) (t/ha), had the largest range (2.39–56.21 t/ha), extending to 53.82 range units, with a mean performance value of 29.24 t/ha. This indicates that the genotypes tested for this attribute have a large range of variability. This suggests that by choosing the top genotypes of this attribute from the examined genotypes, sugarcane genotypes with improved sugar production potential can be produced. The variability of sugar yield among test materials could be attributed due to the differences in sucrose content among genotypes emanating from the differences in the genic region of the genome responsible for sucrose synthesis and accumulation. Genotypic differences in sugar yield may be due to inherent developmental and structural variations, as well as variations in gene networks for sugar signalling (Chen et al., Citation2019). The heterogeneity in sugar production or content was also noted by Esayas et al. (Citation2018), which is consistent with the present finding.
Purity percent and pol percent maximum and minimum trait mean values ranged from 87.61% to 97.70% (range unit; 10.09) and 14.30% to 21.33% (range unit; 7.03), respectively, with mean performance values of 93.03 and 18.33. With range units of 6.10% and 5.68%, respectively, the two remaining biochemical traits: brix percent and estimable sucrose percent (ERS %) displayed fair variability. The reported results for sugarcane biochemical characteristics were similar (Kumar et al., Citation2018).
14.1. Number of genotypes with greater mean performance values than the mean of the population
Among the 196 sugarcane genotypes evaluated, 79 (40.3%) to 105 (53.6%) of them had greater agro-morphological and biochemical traits mean performance values than the population average (Table ). In terms of the agro-morphological traits, 101 (51.5%) of the tested genotypes had longer stalks than the population average. Similarly, 99, 96, 94, 94, 93, 88, 79, 93, 81, 91, 90 and 88 genotypes exhibited greater mean performance values for plant height, internode length, single cane weight, number of millable stalks, stalk diameter, number of tillers at three, four and five months after planting, number of sprouted buds at 30 and 45 days after planting, number of internodes, and cane yield, respectively, than the respective average population.
Furthermore, in terms of biochemical traits, 105, 103, and 84 of the sugarcane genotypes, respectively, had superior purity percent, recoverable sucrose percent and sugar yield, while 101 genotypes showed greater mean performance values for both brix and purity percent than the average population.
14.2. Comparison of the local landraces against the introduced genotypes
The local landraces outperformed the introduced genotypes in terms of the number of sprouted buds 30 days after planting, the number of tillers 5 months after planting, and stalk diameter. However, the superior performance of these traits did not result in greater performance of the key yield traits: cane yield and sugar yield. Likewise, there was no statistically significant difference between them for the other traits taken into account (Table ).
Table 2. Comparison of means of 12 local landraces against 184 introduced sugarcane genotypes based on 13 agro-morphological and five biochemical traits tested at Metahara sugar estate from May 2021-November 2022
14.3. Comparison of genotypes germinated from hybrid seeds against the other collections
In comparison to the other 18 collections (12 landraces, six old collections: four Mexican, and two standard checks), the sugarcane genotypes germinated from introduced hybrid seeds (178) had significantly more tillers at 5 months after planting and shorter intermodal lengths. However, both groups of genotypes had no significant variation in the rest of the traits considered (Table ).
Table 3. Comparison of means of 178 genotypes germinated from hybrid seeds against 12 local and six old collections based on 13 agro-morphological and five biochemical traits tested at Metahara sugar estate from May 2021-November 2022
14.4. Comparison of the best 5% sugarcane genotypes against the mean of the population and standard check varieties
A list of the best genotypes for each of the agro-morphological and biochemical traits and their advantages over the mean of the population and mean of standard check varieties were presented in supplemental Table S3. A comparison of the best 10 (5%) genotypes revealed that except for single cane weight, all the studied traits showed greater mean performance values over the means of the population and standard check varieties.
Accordingly, a selection based on the number of sprouted buds 30 and 45 days after planting revealed that the top 10 genotypes, respectively, had 64.17–132.95% & 15.12–58.52%; and 84.24–102.46% & 74.39–91.64% more sprouted buds over the mean of the population, and standard check varieties, in that order. The best 10 genotypes for the number of tillers at three, four and five months after planting, respectively, had 78.51–186.47% & 63.42–162.26%; 61.72–130.40% & 49.91–113.58%; and 58.86–116.93% & 67.01–128.05% more number of tillers than the mean of the population and standard check varieties, in that order. Among the best 5% of the genotypes of this trait, 80% of them were genotypes from the hybrid seed, indicating the greater tillering potential of genotypes from hybrid seeds that could be exploited.
In addition, the top 10 genotypes for millable stalk number had 43.18–78.22% and 47.43–83.5% more advantage over the population and standard check varieties means. Similarly, the top 10 genotypes had greater mean values for various traits. For instance, they had a height that was 24.83–37.87% greater than the population mean and 29.58–43.12% higher than the mean of standard checks. Also, they had more internodes, with an increase of 18.74–30.54% over the population mean and 23.90–36.20% over the mean of standard checks. Furthermore, the plants had longer internodal length, larger stalk diameter and length, and greater cane yield, with increases ranging from 23.90–46.78% & 36.19–61.34%; 15.58–29.12% & 10.58–23.53%; 17.40–41.77% & 13.42–60.56%; and 72.76–100.64% & 81.42–110.70%, respectively, over the mean of the test population and standard check varieties.
Furthermore, the top 5% of the genotypes had a brix percentage that ranged from 8.28% to 13.32% higher than the population average and 15.06% to 20.41% higher than the standard checks average. The pol percentage ranged from 16.41% to 16.36% higher than the population mean and 17.87% to 24.22% higher than the check varieties. Purity percentage was 2.99% to 5.02% higher than the population mean and 3.25% to 5.28% higher than the standard checks mean. Recoverable sucrose percentage was 12.12% to 18.47% higher than the population mean and 20.07% to 26.87% higher than the standard check varieties mean.
All the top 5% sugarcane genotype for number of millable stalks, stalk height, number of internodes per stalk, internode length, brix percent, pol percent, purity percent, and estimable recoverable sucrose percent were from hybrid seeds. Similarly, greater brix, pol, purity, and estimable recoverable sucrose percent in exotic genotypes of sugarcane were also reported (Esayas et al., Citation2016). Among the top 10 genotypes for the number of sprouted bud, cane yield, and sugar yield, genotypes from local landraces constituted only 10%, while 20% and 40 of the genotypes, respectively, for stalk diameter and single cane weight were from local collection. Conversely, Esayas et al. (Citation2016) found larger proportion of local collections had greater stalk diameter and single cane weight than the introduced genotypes of sugarcane.
Considering sugar yield as a selection criterion, the top 5% genotypes namely 163, 120, 169, 111, 140, 178, 121, 22, 56, and 170 exhibited 63.28%−92.23% and 82.29%−114.61% more sugar yield, respectively, over the mean of the test population and the standard check varieties. The greater sugar yield values for these genotypes indicate the greater genetic potential of the genotypes for this trait, suggesting evaluating them over seasons for commercial use at Metahara Sugar Estate.
Generally, among the top 5% genotypes selected for different traits, larger numbers of them were genotypes from hybrid seeds, indicating the potential merit of the genotypes from hybrid seeds that could be exploited to develop sugarcane genotypes with improved agro-morphological and biochemical traits via selection and hybridization.
15. Multivariate principal components, and cluster analysis
15.1. Multivariate principal component analysis (PCA)
Principal component analysis (PCA) method can be used to divide test genotypes into discrete clusters based on multi-traits and pinpoint the traits that are most responsible for the observed variations among a set of test genotypes. Thus, it provides a variety of options for choosing suitable parental lines from a pool of test materials for hybridization.
It is easier to understand the direction and extent of a trait’s contribution to the variability of test materials scattered throughout the principal component axis using contributing factor loading plots. The contributing factor loading plot also aids in determining how traits are related to one another. The values of the contributing factor loading plot range from −1 to 1. High absolute values indicate a significant influence of the trait on the variability of the test materials grouped along the component axis, whilst values close to zero suggest a limited contribution of the trait to the variation. The direction of the loading plot indicates whether the correlation between a trait and a main component is positive or negative.
With this view, multivariate principal component analysis was performed utilizing standardized data on quantitative agromorphological and biochemical traits both individually and in combination. Based on agro-morphological trait data, and considering eigenvalue ≥ 1, as a criterion of significance, the top five major axes in PCA that can give meaningful interpretation (eigenvalues ≥1.132) explained 81.74% of the total variation (Table & Figure ). The findings of the current study differed slightly from those of Esayas et al. (Citation2016a) and Sumbele et al. (Citation2021), who identified six and four principal components in sugarcane, respectively, which accounted for 79.26% and 75.90% of the total variation.
Figure 1. Contributing factor loading plot (a; left hand side) and score plot (b; right hand side) of the 196 sugarcane genotypes based on 13 agro-morphological traits.
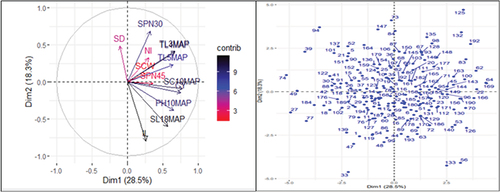
Table 4. Eigen values and vectors; and extent of variation for agro-morphological traits
The first principal component (PC1) accounted for 28.49% of the total variation. With a contributing factor loading of 0.404, the number of stalks 10 months after planting (SC10MAP) is the major contributor to the variation in this PC axis, followed by cane yield (CY; 0.392), and the number of tillers 3 months after planting (TL3MAP; 0.348).
In addition, the number of tillers 4 months after planting (TL4MAP; 0.347), plant height 10 months after planting (PH10MAP; 0.339), and the number of tillers 5 months after planting (TL5MAP; 0.336) all considerably contributed to the variability in this PC axis. This indicates that these traits are accountable for the variability of the sugarcane genotypes clustered along this PC axis. This suggests that these traits could be improved by utilizing genotypes from this group as significant sources of genetic variability for these traits. In a finding similar to the current one, Esayas et al. (Citation2016a) discovered that cane yield and stalk number were significant contributors to the diversity in sugarcane genotypes categorized under the first PCs axis. Conversely, Ittah and Obok (Citation2019) found that among the agro-morphological traits, the number of sprouted buds had the greatest contributing factor loading on the first PC axis.
The second PC axis contributed 18.25% of the overall variation. Esayas et al. (Citation2016a) and Sumbele et al. (Citation2021) discovered 16.06% and 20.09%, respectively, of the total variation in the second PCs axis in sugarcane, which is similar to the current findings. The second PC axis distinguished the sugarcane genotypes on the bases of internode length (IL; −0.517), the number of sprouted buds 30 days after planting (SPN30; 0.443), stalk length (SL18MAP; −0.390), and stalk diameter (SD; 0.313). The results of the current study differed from earlier findings for single cane weight and stalk diameter by Esayas et al. (Citation2016a); and plant height, and stalk length by Sumbele et al. (Citation2021). This might be due to the difference in genotypes, and study environment, and their interactions.
The third PC axis explained 16.74% of the total variation, with significant contributing factor loadings from single cane weight (SCW; −0.576), stalk diameter (SD; −0.469), and internode number (NI; −0.321). On the other hand, the fourth (9.55%) and fifth (8.71%) PCs axes had a negligible (less than 10%) contribution to the overall variability. Significant contributing factor loadings on the fourth PC axis were found for the number of sprouted buds 45 days after planting (SPN45; 0.677), cane yield (CY; 0.321), and single cane weight (SCW; −0.311). However, as shown by their significant contributing factor loadings, the number of internodes (NI; 0.675), number of sprouted buds 45 days after planting (SPN45; −0.378), internode length (IL; −0.345), and stalk diameter (SD; −0.329) were the contributors to the variability in the fifth PC axis. The significant contributing factor loadings of the traits in the third, fourth, and fifth PCs axis indicate that these traits were used as criteria for clustering of the sugarcane genotypes along these PCs axis. This implies that because of their agro-morphological trait mean performance similarity arising from genetic resemblance, the sugarcane genotypes were clustered together along the same PC axis. This implies that crossing among these genotypes could be avoided as it could lead to inbreeding depression.
A principal component loading plot based on 13 agro-morphological traits is presented in Figure . The variables stalk length (SL18MAP), plant height (PH10MAP), millable stalk number (SC10MAP), and the number of tillers at 3 months (TL3MAP) and 5 months (TL5MAP) after planting were clustered closely together with cane yield (CY). This indicates that these pairs of variables are positively correlated (angles between them are acute), suggesting improvement in these traits leads to enhance cane yield. A strong positive association between plant height and cane yield was reported (Rewati & Joshi, Citation2005), which agrees with this result.
Conversely, the trait stalk diameter (SD) and internode length (IL) formed 180° angle, indicating that these two variables are negatively correlated and thus antagonistic. Furthermore, the shorter arrows for single cane weight (SCW) and number of sprouted buds 45 days after planting (SPN45) indicates their little contribution to the variability of genotypes grouped along the second PC axis. Conversely, the longer arrows of number of sprouted buds 30 days after planting (SPN30) and stalk length (SL18MAP) indicate their greater contribution to the variability of genotypes grouped along this PC axis.
15.2. Principal component analysis based on biochemical traits
Based on the principal component analysis of biochemical traits, the first two principal components together accounted for 91.32% of the total variations (Table & Figure ). The first principal component (PC1) alone was responsible for 71.58% of the total variances. Estimatable sucrose percent (ERS; −0.53) was the major contributor to the variability in this plot, followed by pol percent (−0.52), brix percent (−0.49), and purity percent (−0.44).
Figure 2. Contributing factor loading plot (a; left hand side) and score plot (b; right hand side) of the 196 sugarcane genotypes based on five biochemical traits.
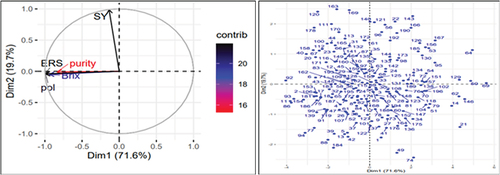
Table 5. Eigen values and vectors; and extent of variation for biochemical traits
Sugar yield (SY), which had a contributing factor loading of 0.99, contributed the most to the overall variation (19.74%) on the second PC axis. Additionally, the PCA loading plot revealed a substantial positive association between brix, pol, purity, and estimable sucrose percent (Figure ). This indicates that improvement in one of them leads to improvement in the other traits. Furthermore, the angle between the vectors of these biochemical traits and sugar yield was acute (<90°), indicating positive correlation between these traits and sugar yields. This suggests that selection based on these traits or improvement in these traits increases sugar yield.
Principal component analysis based on both agro-morphological and biochemical traits: The quantitative agro-morphological, and biochemical traits of 196 sugarcane genotypes were investigated using principal component analysis. With eigenvalues larger than or equal to 1.151, the first six PCA axes explained 84.13% of the total variation (Table and Figure ). 25.21% of the overall variation was accounted for by the first principal component (PC1).
Figure 3. Contributing factor loading plot (a; left hand side) and score plot (b; right hand side) of the 196 sugarcane genotypes based on combinations of 13 agro-morphological and five biochemical traits.
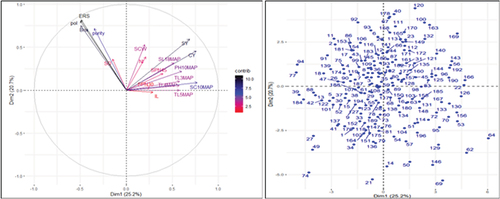
Table 6. Eigen values and vectors; and extent of variation of agro-morphological and biochemical traits
With contributing factor loadings of 0.77, 0.76, and 0.69, the number of millable stalks 10 months after planting (SC10MAP) was the most important contributor to the variability of genotypes clustered along this PC axis, followed by cane yield (CY), and sugar yield (SY). Additionally, tiller number three, four, and five months after planting (TL3MAP; 0.58, TL4MAP; 0.58, and TL5MAP; 0.58, respectively), as well as stalk length 18 months after planting (SL18MAP; 0.52), made a significant contribution to the variability in this PC axis. Furthermore, Pol percent (−0.49), Brix percent (−0.49), estimable recoverable sucrose percent (ERS; 0.49), number of sprouted buds 45 days after planting (SPN45; 0.39), and purity percent (Purity; −0.35) all had significant contributing factor loadings to the variability of genotypes grouped along this PC axis. Esayas et al. (Citation2016a) found similar results for the number of stalks, cane yield, and sugar yield as major contributors to the variations of sugarcane genotypes grouped along the first PC axis.
The second PC axis explained about 20.69% of the total variations. Estimable sucrose percent (ERS: 0.82), pol percent (Pol: 0.81), brix percent (Brix: 0.75), and purity percent (Purity; 0.72) all had a significant impact on this PC axis’ variability. Significant loadings for contributing factors were also found for the sugar yield (SY; 0.59), single cane weight (SCW; 0.53), cane yield (CY; 0.46), number of internodes (NI; 0.39), stalk diameter (SD; 0.36), and stalk length 18 months after planting (SL18MAP; 0.32). This indicates that these traits served as the basis for the second PC axis’ differentiation of the sugarcane genotypes. Similar results were found for the single cane weight, stalk diameter, Brix, Pol, purity, and estimable sucrose percentage (Esayas et al., Citation2016a).
The third PCs axis contributed 13.36% of the total variations. Internode length (IL; −0.73) and number of sprouted buds 30 days after planting (SPN30; 0.72) had the highest contributing factor loading on this PC axis. Significant factor loadings were also observed for stalk length 18 months after planting (SL18MAP; −0.58), number of tillers three, four, and five months after planting (TL3MAP; 0.51; TL4MAP; 0.52; and TL5MAP; 0.36, respectively), plant height 10 months after planting (PH10MAP; −0.33), and stalk diameter (SD; 0.33).
Single cane weight (SCW; 0.64) and stalk diameter (SD; 0.67) were the two most significant traits with the highest contributing factor loading on the fourth PC axis, which contributed 11.16% of the total variations. In addition, the number of tillers four, and five months after planting (TL4MAP; −0.31; and TL5MAP; −0.45), and the number of stalks 10 months after planting (SC10MAP; 0.36) all had significant contributing factor loadings on this PC axis.
The fifth and the sixth PC axes, respectively, were responsible for 7.32% and 6.40% of the overall variations. High contributing factor loadings were present on the fifth PC axis for the number of sprouted buds 45 days after planting (SPN45; 0.72), single cane weight (SCW; −0.43), and stalk length 18 months after planting (SL18MAP; −0.36); while the sixth PC axis exhibited significant contributing factor loading for the number of internodes (NI; −0.77), internode length (IL; 0.41), and stalk diameter (SD; 0.36).
The results of PCA loading plot based on combinations of agro-morphological and biochemical traits are presented in . Except for the stalk diameter that clustered closely with the biochemical traits, and sugar yield, which grouped with the agro-morphological traits, the PCA loading plot was able to separate the agro-morphological traits from the biochemical traits. The clustering together of the stalk diameter (SD) and the biochemical traits pol, brix, purity, and estimable recoverable sucrose percent (ERS) indicates the presence of positive association between them.
Likewise, the vectors for estimable recoverable sucrose percent (ERS) and plant height (PH10MAP) were almost right angle (90°), indicating that they are uncorrelated or have weak association. The association between sugar yield (SY) and the agro-morphological traits cane yield (CY) and number of millable stalks (SC10MAP), as well as sugar yield (SY) and biochemical traits recoverable sucrose percent, pol percent, brix percent, and purity percent was positive as demonstrated by the acute angle between their vectors. This indicates that improvement in these traits enhances sugar yield.
Estimable sucrose percent (ERS), pol percent (pol), cane yield (CY), and sugar yield (SY) had longer arrows, indicating the greater contribution of these variables for the diversity of the sugarcane genotypes grouped along their respective principal component axes. This suggests that genotypes with greater mean values of these traits could be targeted for selection breeding. However, the shorter arrows for internode length (IL), number of sprouted buds 30 (SPN30) and 45 (SPN45) days after planting and number of internodes (NI) indicate their little contribution to the variability of the genotypes and hence their less importance for selection.
Generally, recoverable sucrose percent (ERS; 0.817), pol percent (0.805), the number of millable stalks (SC10MAP; 0.771), and cane yield (CY; 0.760) were the greatest contributors to the diversity of the sugarcane genotypes evaluated. Thus, genotypes with greater mean values of these traits could be targeted for selection breeding.
16. Cluster analysis
Multivariate cluster analysis classified all the 196 sugarcane genotypes into five clusters based on standardized data for 13 quantitative agro-morphological variables (Figure ). Cluster one (C1) had the most genotypes (154), and cluster two (C2) had three. Three genotypes, namely 125, 33, and 56, respectively, formed their own separate clusters viz., clusters three, four, and five. These clusters are designated C3, C4, and C5. A total of 154 genotypes made up cluster 1 (C1), of which 139 genotypes were imported from Barbados, four from Mexico, 10 from Ethiopia, and one from South Africa (Figure ).
Figure 4. Dendrogram of 196 sugarcane genotypes based on 13 agro-morphological traits.
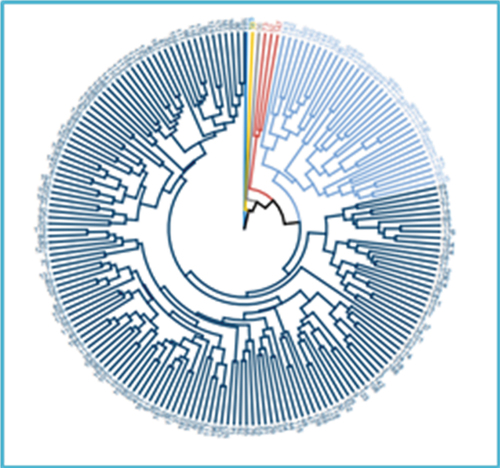
Figure 5. Dendrogram of 196 sugarcane genotypes based on five biochemical traits.
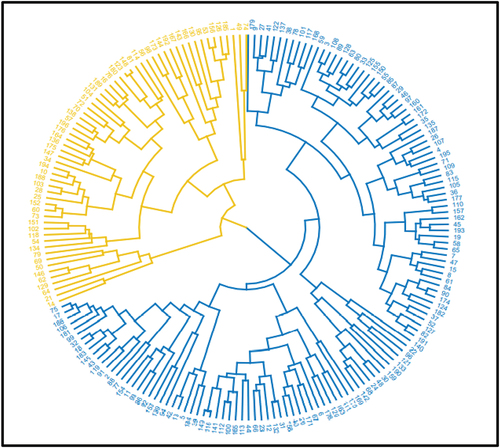
The second cluster consisted of three genotypes: two Ethiopian and one Barbados origin. This indicates that the pattern of agro-morphological diversity is not in accordance with their geographical diversity, implying diversity in the test materials is dictated by genetic relationship rather than geographical location. Weak association between agro-morphological diversity and geographical diversity in sugarcane (Esayas et al., Citation2016a; Sumbele et al., Citation2021), and Barley (Gaddisa et al., Citation2021) were reported, which agrees with the current result.
Additionally, grouping genotypes of various geographic origins into a single cluster demonstrates the presence of agro-morphological similarity among the genotypes, and hence, genetic similarity. This might be attributed by gene flow in the form of germplasm exchange between the countries, and/or historically common parentage of the sugarcane genotypes. The separation of genotypes from the same origin into distinct clusters also suggests the existence of agro-morphological diversity brought on by genetic variation among the genotypes, attributed by variations in their ancestry and/or genetic recombination (meiosis) in hybridization.
Genetic distance analysis based on agro-morphological traits revealed a range of intercluster distances of 6.06 to 11.73 (Table ). The highest genetic distance was found between clusters three and five (C3 vs C5; 11.73), followed by between two and four (C2 vs C4; 10.018), and four and five (C4 vs C5; 9.83). Due to the presence of highly contrasting and complementary agro-morphological traits between the genotypes of the two clusters, a relatively substantial intercluster distance suggests that there is a significant genetic divergence between the two clusters’ genotypes. This suggests that there will be significant heterosis when these groups’ genotypes cross. The genetic difference between clusters one, and two was the smallest (C1 vs. C2; 6.06), followed by clusters one, and four (C1 vs. C4; 6.43), and clusters three, and four (C3 vs C4; 6.63). Limited agro-morphological variation between the genotypes of the two pairings of clusters is indicated by small intercluster genetic distance. This suggests that there may be difficulties in successful hybridization between the genotypes of these clusters.
Table 7. Intercluster, intracluster, and mean distance based on 13 agro-morphological traits
Additionally, the genotypes in cluster one (C1) showed a higher intra-cluster genetic distance (4.79) than the genotypes in cluster two (C2; 3.9). This indicates that the genotypes of cluster one are more divergent than those of the genotypes of cluster two. The average distance of all the clusters is less than the average distance of cluster one, according to calculations of the clusters’ average distance (C1). This shows that genotypes in cluster one (C1) are the furthest away from genotypes in any other cluster. Sugarcane genotypes belonging to cluster one (C1) had genotypes with the longest internode length (IL; 10.44 cm) and stalk length 18 months after planting (SL18MAP; 2.99 m) compared to genotypes belonging to all other clusters, according to a cluster mean analysis.
The genotypes of cluster one (C1) had the longest internodal and stalk lengths, according to a cluster mean study (Table ). This demonstrates the significance of these sugarcane genotypes in the development of hybrid sugarcane varieties with increased plant height and, consequently, longer stalks. However, the genotypes of cluster two (C2) had the highest numbers of sprouted buds per plot 30 days after planting (SPN30; 25.92), tillers per plot 3, 4, and 5 months after planting (TL3MAP; 87.81, TL4MAP; 100.89, and TL5MAP; 80.87, respectively), and plant height 10 months after planting (PH10MAP; 80.87).
Table 8. Clusters means based on 13 agro-morphological traits of 196 sugarcane genotypes evaluated at Metahara sugar estate during May 2021-November 2022 growing season
This shows that the genotypes of sugarcane in this cluster have a higher genetic potential for these traits, which should be utilized to further improve these traits in sugarcane. Cluster five (C5) (Genotype 56) produced the highest cane yield (CY; 19.91 t/ha) because it had the most sprouted buds 45 days after planting (SPN45; 33.36), the most internodes per stalk (NI; 33.76), the thickest stalk diameter (SD; 2.81 cm), and the heaviest single cane weight (SCW; 1.91 kg). This suggests that this genotype could be used to further improve these traits because it had a high genetic potential for them. In addition, the sugarcane genotype 56 had 30.80% and 40.51% more cane yielding potential, respectively, than the mean of the test population (14.88 t/ha) and the mean of the standard check varieties (14.17 t/ha). Thus, to release for commercial production for Metahara Sugar Estate, this genotype could also be evaluated across seasons.
However, cluster three (C3) had the lowest number of sprouted buds 45 days after planting (SPN45; 16.67), the lowest number of tillers per plot 3, 4, and 5 months after planting (TL3MAP; 46.36, TL4MAP; 57.80, and TL5MAP; 61.80, respectively), and the lowest number of stalks per plot 10 months after planting (SC10MAP; 52.09). Similarly, the genotypes in cluster four (C4) had the smallest cane yield (CY; 8.37 t/ha), the least number of internodes per stalk (NI; 28.55), the shortest internodal and stalk lengths (IL; 7.99 cm, and SL18MAP; 2.27 m, respectively), and the shortest plant height (PH10MAP; 1.51 m).
17. Cluster analysis based on biochemical traits
Cluster analysis based on biochemical traits grouped the 196 sugarcane genotypes into two distinct groups (). The first cluster contained 62 genotypes, 52 of which were from Barbados, one from South Africa, and nine from Ethiopia. Three genotypes from Ethiopia, four from Mexico, and 127 from Barbados made up the second cluster. The results from both clusters indicate a tenuous relationship between the patterns of biochemical diversity and geographic diversity. In contrast to the current findings, Tai and Miller (Citation2001) discovered 11 groupings based on the biochemical traits of 147 sugarcane genotypes from four different species, while Ekpelikpeze et al. (Citation2016) categorized 42 sugarcane genotypes into three clusters. The distance between the two clusters (C1 & C2) was 3.19 units, whilst the distances within each cluster: cluster one (C1), and cluster two (C2) were 1.51, and 1.53 units, respectively (Table ). Additionally, genotypes belonging to cluster one (C1) displayed lower mean values for all the examined biochemical traits than genotypes belonging to cluster two (C2) (Table ).
Table 9. Intercluster, intracluster, and mean distance based on five biochemical traits of 196 sugarcane genotypes evaluated at Metahara sugar estate during May 2021-November 2022 growing season
Table 10. Cluster means of 196 sugarcane genotypes based on five biochemical traits of 196 sugarcane genotypes evaluated at Metahara sugar estate during May 2021-November 2022 growing season
Thus, cluster analysis based on the biochemical composition clustered the sugarcane genotypes into low sugared, and high sugared sugarcane genotypes. The sugarcane genotypes of the second cluster (C2) that had 30.39 t/ha of sugar exhibited 3.92% and 16.05% more sugar yield than the mean performance of the population (29.24 t/ha) and standard check varieties (26.19 t/ha), respectively. This indicates the greater sugar yield potential of these genotypes that could be exploited.
18. Cluster analysis based on both agro-morphological and biochemical traits
The results of the multivariate cluster analysis are shown in Figure , Table , respectively, for the dendrogram, genetic distances, and cluster means. Multivariate cluster analysis grouped the 196 sugarcane genotypes into six clusters. In contrast to the current findings, Ram and Hemaprabha (Citation2005) classified 153 sugarcane genotypes into five clusters, while Esayas et al. (Citation2016a) categorized 400 sugarcane genotypes into 20 clusters. Cluster one (C1) contained a total of 161 genotypes, while cluster two (C2) had 31 genotypes (C2). Individual clusters were generated by the four genotypes: 143, 125, 133, and 56, which correspond to clusters three (C3), four (C4), five (C5), and six (C6), respectively.
Figure 6. Dendrogram of 196 sugarcane genotypes based on combinations of 13 agro-morphological and five biochemical traits.
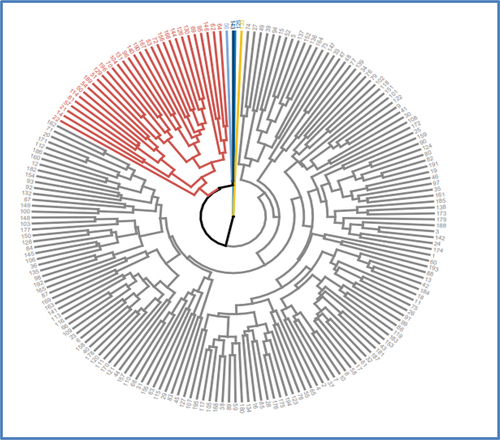
Table 11. Intercluster and intracluster genetic distances of 196 sugarcane genotypes based on 13 agro-morphological and five biochemical traits
Table 12. Cluster means of 196 sugarcane genotypes based on 13 agro-morphological and five biochemical traits
The results of the genetic distance analysis elucidated that clusters four and five had the largest (C4 vs. C5; 10.914) intercluster genetic distance, followed by clusters three and four (C3 vs. C4; 10.031); and clusters five and six (C5 vs. C6; 10.031). The large genetic distance between the clusters indicates the presence of genetic divergence between the genotypes of the pairs of clusters. This suggests that there is a good chance that genetic recombination between the genotypes of the divergent clusters will result in the development of a hybrid vigor. However, in similar studies, Mebrahtom et al. (Citation2016) discovered the largest genetic distance (Euclidean) between clusters 9 and 10.
On the other hand, shorter intercluster genetic distances were discovered between clusters three and cluster five (C3 vs C5; 6.45), and between clusters three and cluster six (C3 vs C5; 6.54). This indicates that the genotypes of the studied clusters have little genetic divergence. This implies that it is worthless to use genotypes of these clusters as parents for hybridization. In terms of intracluster genetic distance, genotypes grouped in cluster one (C1) had greater (C1; 6.64) intracluster genetic distance than the genotypes grouped in cluster two (C2; 5.85). This shows that cluster one (C1) sugarcane genotypes are typically more divergent than genotypes within cluster two (C2). This suggests that there are less distinct agro-morphological and biochemical traits among sugarcane genotypes belonging to cluster two (C2) than among genotypes of cluster one (C1).
Cluster one (C1) had the highest mean values for the number of sprouted buds per plot 30, and 45 days after planting (SPN30:28.82 sprouted buds per plot, and SPN45:30.98 sprouted buds per plot, respectively), as well as the number of tillers per plot three and four months after planting (TL3MAP: 78.04 tillers per plot, and TL4MAP: 86.34 tillers per plot, respectively). In addition, this cluster had the highest mean values for the number of internodes per stalk (NI: 32.97), purity percent (94.21%), and sugar yield (SY: 38.39t/ha). The genotypes of this cluster (C1) had 31.29% and 46.58% more sugar yield over the mean of the population (29.24t/ha) and the mean of the standard check varieties (26.19 t/ha), respectively. The higher mean values for these traits’ genotypes in cluster one (C1) demonstrate their high genetic potential and point to the significance of enhancing these phenotypes through hybridization. Conversely, cluster three (C3) had the lowest mean values for the number of sprouted buds per plot 30 and 45 days after planting, the number of tillers at three and four months after planting, the number of internodes per stalk, purity percent, and sugar yield.
Cluster two (C2) had the highest mean values for the numbers of tillers per plot 5 months after planting (TL5MAP), number of stalks per plot, and plant height 10 months after planting (SC10MAP and PH10MAP, respectively), as well as for internode length (IL). In contrast, clusters three (C3), and four had the lowest mean values for the number of tillers per plot 5 months after planting (TL5MAP), number of stalks per plot, and plant height 10 months after planting (SC10MAP, and PH10MAP, respectively), as well as for internode length (IL). With respect to stalk diameter (SD; 2.82 cm), stalk length at 18 months after planting (SL18MAP; 3.07 m), single cane weight (SCW; 2.06 kg), and cane yield (19.84 t/ha), cluster five (C5) had the greatest mean values. The genotypes of this cluster had 33.33% and 40.0% more cane yield, respectively, over the mean of the population (14.88 t/ha) and the standard check varieties (14.17 t/ha).
Cluster six (C6) had the highest mean values for Brix (20.52%), pol (19.32%), and estimable sucrose percent (ERS; 13.94%). Compared to the mean of the test population (19.68%) and standard check varieties (17.17), the genotypes of cluster six had 4.25% and 10.77% more brix% than the mean of the population standard check varieties, respectively. In terms of purity percent, cluster six genotypes had 5.41% and 12.53% more than the mean of the population (93.03%) and standard checks (92.80%), respectively. In addition, the genotypes of this cluster had 6.19% and 13.73% more recoverable sucrose percent than the mean of the test population and standard check varieties, respectively.
The high mean values of the genotypes grouped in cluster six (C6) for the corresponding traits indicate that these genotypes could be exploited to enhance these traits in sugarcane through hybridization.
The number of tillers at three, four, and five months after planting (TL3MAP; 38.12, TL4MAP; 49.12, and TL5MAP; 54.18, respectively), the number of sprouted buds at 30, and 45 days after planting (SPN30; 15.28, and SPN45; 17.47, respectively), and the number of stalks 10 months after planting (SC10MAP; 46.63) were all lowest in cluster three (C3). Similarly, genotypes in cluster 4 (C4) had the lowest mean values for single cane weight (SCW; 1.37 kg), internode length (IL; 7.94 cm), internode number per stalk (NI; 28.14), stalk length 18 months after planting (SL18MAP; 2.22 m), cane yield (CY; 8.54 t/ha), and sugar yield (SY; 17.06 t/ha).
19. Conclusions and recommendations
The results of variability analysis revealed the existence of a wide range of agro-morphological and biochemical trait differences across the genotypes studied, indicating a great potential for genetic improvement. Except for single cane weight, the top 5% of the sugarcane genotypes outperformed the means of both the test population and the standard control varieties. Out of the sugarcane genotypes tested, the top 10 best sugar yield genotypes were 163, 120, 169, 111, 140, 178, 121, 22, 56, and 170. These genotypes outperformed the means of both the population and the standard check varieties by a significant margin, ranging from 63.28% to 92.23% and 82.29% to 114.61%, respectively. These particular genotypes have a higher potential for sugar yield and thus could be further evaluated over multiple seasons for commercial use at Metahara.
Based on agro-morphological and biochemical traits and their combinations, the first five, two, and six components explained 81.74%, 91.32%, and 84.13% of the total variations, respectively. Principal component analysis based on agro-morphological traits identified that the number of sprouted buds 45 days after planting and the number of internodes per stalk were the most important contributors to agro-morphological diversity of the test materials, while sugar yield was the greatest contributor to the genetic diversity of the sugarcane genotypes based on biochemical traits. Based on combinations of agro-morphological and biochemical traits, the number of millable stalks, recoverable sucrose percentage, internode length, stalk diameter, number of sprouted buds 30 days after planting, and number of internodes per stalk contributed the most to the variation explained by PC1, PC2, PC3, PC4, PC5, and PC6, respectively.
Cluster analysis revealed that clusters three and five based on agro-morphological features alone, as well as clusters four and five based on a combination of agro-morphological and biochemical traits, had the greatest inter-cluster distance values.
The results of principal component and cluster analysis demonstrate that the sugarcane genotypes found in distant clusters and the traits that contribute the most to existing variation could be targeted for selection and hybridization in order to develop improved sugarcane varieties for the desired attributes. Cluster analysis-based agro-morphological and biochemical traits revealed that sugarcane genotype 133, which formed its cluster (C5), produced 43.60% more sugar yield than the mean of the standard check varieties (26.19 t/ha). This demonstrates the genotype’s higher potential for sugar yield, which could be assessed over seasons for commercial use at Metahara Sugar Estate.
It can be inferred that the study found significant agro-morphological and biochemical trait diversity among the tested sugarcane genotypes and identified key contributing traits as well as potential genotypes that could be used to develop higher sugar-yielding sugarcane genotypes.
Authors’ contributions
The study’s planning and conception involved input from all of the writers. [Belay Tolera] was in charge of carrying out the field experiment and gathering and analysing the data. [Belay Tolera] written the manuscript’s initial draft, and all of the other authors offered feedback on earlier drafts. The final manuscript was read by each contributor and was then approved.
Supplemental Material
Download MS Word (54 KB)Acknowledgments
The authors gratefully acknowledge Hawassa University's NORAD project for providing financial support, and the Metahara Research Center of the Ethiopian Sugar Industry Group for its material and technical support.
Disclosure statement
No potential conflict of interest was reported by the author(s).
Data availability statement
The dataset collected and analyzed in the course of the present study is available from the corresponding author on reasonable request.
Supplemental data
Supplemental data for this article can be accessed online at https://doi.org/10.1080/23311932.2023.2254141
Additional information
Funding
References
- Abdul, Q. K., Kiya, A. T., & Berhanu, L. R. (2017). A study on morphological characters of introduced sugarcane varieties (Saccharum spp., hybrid) in Ethiopia. International Journal of Plant Breeding and Genetics, 11(1), 1–26. https://doi.org/10.3923/ijpbg.2017.1.12
- Abera, D., Mengistu, B., Yohannes, M., Endris, Y., & Zeleke, T. (2016). Determination of crop Water Requirements of sugarcane and Soybean Intercropping at Metahara sugar estate. Advances in Crop Science and Technology, 4(5), 1–4. https://doi.org/10.4172/2329-8863.1000241
- Afghan, S., Ehsan Khan, M., Raza Arshad, W., Bukhsh Malik, K., & Nikpay, A. (2023). Economic Importance and Yield Potential of Sugarcane in Pakistan. Sugarcane-its products and sustainability, 1–134. https://doi.org/10.5772/intechopen.105517
- Alam, M. N., Ujjal, K. N., Karim, K. M. R., Ahmed, M. M., & Mitul, R. Y. (2017). Genetic variability of exotic sugarcane genotypes. Hindawi Scientifica, 2017, 1–10. https://doi.org/10.1155/2017/5202913
- Amalraj, V. A., & Balasundaram, N. (2006). On the taxonomy of the members of ‘Saccharum complex.’ Genetic Resources and Crop Evolution, 53(1), 31–41. https://doi.org/10.1007/s10722-004-1581-1
- Anonymous. (2014). Investment opportunity in sugarcane plantation in Ethiopia. Embasy of the Federal Democratic Republic of Ethiopia, New Dehli, India.
- Belay, T., Gedebo, A., & Tena, E. (2023). Variability, heritability and genetic advance in sugarcane (Saccharum spp. hybrid) genotypes. Cogent Food & Agriculture, 9(1), 1–16. https://doi.org/10.1080/23311932.2023.2194482
- Berding, N., Hogarth, M., & Cox, M. (2004). Plant improvement of sugarcane. In James, G. (Ed.), Sugarcane: World agricultural series, (2nd ed) (pp. 1–224). Blackwell Science Ltd.
- Berding, N., & Skinner, J. C. (1987). Traditional breeding methods. In Copersucar International Sugarcane Breeding Workshop (pp. 269–320). Copersucar.
- Birru, E. (2016). Sugarcane Industry Overview and energy Efficiency Considerations. Literature Survey document (Report no. 01/2016), (01). KTH School of Industrial Engineering and Management Department of Energy Technology Division of Heat and Power Technology SE-100 44 STOCKHOLM. https://www.diva-portal.org.
- Chen, Z., Qin, C., Wang, M., Liao, F., Liao, Q., Liu, X., Yangrui, L., Lakshmanan, P., Long, M., & Huang, D. (2019). Ethylene-mediated improvement in sucrose accumulation in ripening sugarcane involves increased sink strength. BMC Plant Biology, 2019(19), 285. https://doi.org/10.1186/s12870-019-1882-z
- Cox, M. C., & Hansen, P. B. (1995) Productivity trends in southern and central regions and the impact of new varieties. In Proceedings of the Australian Society of Sugar Cane Technologists 17 (pp. 1–7).
- Dabholkar, A. R. (1992). Estimates of biometrical genetics. Concept Publishing Company.
- DaCosta, M. L. M., Amorim, L. L. B., Onofre, A. V., deMelo LJT, deOliveira MBM, deCarvalho, R., & Benko-Iseppon, A. M. (2011). Assessment of genetic diversity in contrasting sugarcane varieties using inter-simple sequence repeat (ISSR) markers. American Journal of Plant Sciences, 2(3), 425–432. https://doi.org/10.4236/ajps.2011.23048
- Ekpelikpeze, O. S., Dansi, A., Agbangla, C., Akoegninou, A., & Sanni, A. (2016). Biochemical Characterization of sugarcane varieties cultivated in Benin.Int. International Journal of Current Microbiology and Applied Sciences, 5(2), 368–379. https://doi.org/10.20546/ijcmas.2016.502.042
- Esayas, T. G., Firew, M., & Amsalu, A. (2018). Sugarcane landraces of Ethiopia: Germplasm collection and analysis of Regional diversity and Distribution. Hindawi, Advances in Agriculture, 2018, 1–10. https://doi.org/10.1155/2018/7920724
- Esayas, E., Mekbib, F., & Ayana, A. (2016). Genetic diversity of quantitative traits of sugarcane genotypes in Ethiopia. American Journal of Plant Sciences, 2016(7), 1498–1520. https://dx.doi.org/10.4236/ajps.2016.710142
- Esayas, T., Mekbib, F., & Ayana, A. (2016a). Correlation and Path Coefficient Analyses in sugarcane genotypes of Ethiopia. American Journal of Plant Sciences, 7(10), 1490–1497. https://doi.org/10.4236/ajps.2016.710141
- Esayas, T., Mekbib, F., & Ayana, A. (2016b). Heritability and correlation among sugarcane (Saccharum spp.) yield and some agronomic and sugar Quality traits in Ethiopia. American Journal of Plant Sciences, 7(10), 1453–1477. https://doi.org/10.4236/ajps.2016.710139
- ESDA (Ethiopian Sugar Development Agency). (2009) Performance Report. In Proceedings of Ethiopian Sugar Industry Biennial Conference 1, (pp. 186–197).
- Falconer, D. S., & Mackay, T. F. C. (1996). Introduction to quantitative genetics (4th ed.). Addison Wesley Longma, Harlow.
- FAO. (2020) . Sustainable food and agriculture.Fao.org/faostat. FAO Statistics Division website.
- FAO. (2021). Production: Crops & livestock products. https://www.fao.org/faostat/en/#data/QCL.
- FAOSTAT. (2019). Food and Agriculture Organization of the United States of America. World sugarcane production statistics. https://www.fao.org/faostat/en/#dataFAOSTAT.
- Fernandes, T. G., & Griffin. (2016). Introduction and uses, Safety Assessment of Transgenic Organisms in the environment: OECD Consensus Documents, pp. 69–154. https://www.oecd-ilibrary.org/docserver/9789264253421-5.
- Feyissa, T., Tadesse, N., Abiy, G., Zinaw, D., Netsanet, A., & Yeshimebet, T. (2014). Genetic variability and heritability of ten exotic sugarcane genotypes at Wonji sugar estate of Ethiopia Global Advanced. Research Journal of Physical and Applied Sciences, 3(4), 1–4. https://www.garj.org/garjpas/index.htm
- Gaddisa, F., Abebe, M., & Bekele, T. (2021). Agro-morphological traits-based genetic diversity assessment in Ethiopian barley (Hordeum vulgare L.) landrace collections from Bale highlands, Southeast Ethiopia. Agric & Food Secure, 10(58), 1–14. https://doi.org/10.1186/s40066-021-00335-4
- Gan, G., Ma, C., & Wu, J. (2007). Data clustering Theory, Algorithms, and Applications. In ASA SIAM series on Statistics and Applied Probability. https://doi.org/10.1137/1.9780898718348
- Govindaraj, M., Vetriventhan, M., & Srinivasan, M. (2015). Importance of genetic diversity Assessment in crop plants and its Recent Advances: An Overview of its Analytical Perspectives. Genetics Research International, 2015, 1–14. https://doi.org/10.1155/2015/431487
- Gowda, S. N. S., Saravanan, K., & Ravishankar, C. R. (2016). Genetic variability, heritability and genetic advance in selected clones of sugarcane. Plant Archives, 2(16), 700–704.
- GRIN. (2004). The germplasm Resources information Network (GRIN), http://www.ars-grin.gov.
- Heaton, E. A., Dohleman, F. G., & Long, S. P. (2008). Meeting US biofuel goals with less land: The potential of Miscanthus. Global Change Biology, 14(9), 2000–2014. https://doi.org/10.1111/j.1365-2486.2008.01662.x
- Hogarth, D. M. (1976). New varieties lift sugar production. Producers Review, 66(10), 21–22.
- Ittah, M. A., & Obok, E. E. (2019). Breeding potential and Multivariate Analyses of morphological and yield traits in Industrial sugarcane (Saccharum officinarum L.) Accessions in a Humid Tropical Agroecology. International Journal of Plant & Soil Science, 27(5), 1–10. https://doi.org/10.9734/IJPSS/2019/v27i530087
- Kandel, A., Yang, X., Song, J., & Wang, J. (2018). Potentials, challenges, and genetic and genomic resources for sugarcane biomass improvement. Frontiers in Plant Science, 9, 1–14. https://doi.org/10.3389/fpls.2018.00151
- Kassa, H. (2010). Analytical methods for routine anaysis of factory products. In Handbook of laboratory methods and chemical control of Ethiopian sugar factories (pp. 1–341). ESDAR- Ethiopian Sugar Development Agencysearch and Development.
- Katia, A. F.-R., Hernández-Rosas, F., Figueroa-Sandoval, B., Velasco-Velasco, J., & Aguilar Rivera, N. (2019). What has been the Focus of sugarcane Research? A Bibliometric Overview. International Journal of Environmental Research and Public Health, 16(18), 1–15. https://doi.org/10.3390/ijerph16183326
- Kebede, S., Ambachew, D., & Firehun, G. (2013). Trends of sugar industry development in Ethiopia: Challenges and prospects. Ethiopian Science Academy.
- Kumar, P., Pandey, S. S., Kumar, B., Kamat, D. N., & Kumar, M. (2018). Genetic variability, heritability and genetic advance of quantitative traits in sugarcane. International Journal of Chemical Studies, 6(3), 3569–3572.
- Lance, G. N., & Williams, W. T. (1967). A general theory of classificatory sorting strategies ii. Clustering Systems the Computer Journal, 10(3), 271–277. https://doi.org/10.1093/comjnl/10.3.271
- Meade, G., & Chen, J. (1977). Cane sugar handbook. Cane Sugar Handbook.
- Mebrahtom, F., Mekbib, F., & Abraha, E. (2016). Multivariate analysis of sugar yield contributing traits in sugarcane (Saccharum officinarum.L), in Ethiopia. African Journal of Plant Science, 10(8), 145–156. https://doi.org/10.5897/AJPS2016.1419
- Melaku, T., Esayas, T., & Mulugeta, K. (2022). Characterization and Estimation of diversity of sugarcane (Saccharum officinarum) genotypes based on Qualitative morphological traits. A Pre-Print on Research Square, 1–17. https://doi.org/10.21203/rs.3.rs-1905952/v1
- Mondini, L., Noorani, A., & Pagnotta, M. A. (2009). Assessing plant genetic diversity by molecular tools. Diversity, 1(1), 19–35. https://doi.org/10.3390/d1010019
- Naturland, E. V. (2001). Organic Farming in the Tropics and Subtropics. Pineapple. Special section: Organic Cultivation of sugar cane. Kleinhaderner Weg. 1 82166 Gräfelfing, Germany website: www.naturland.de.
- Pandey, D., Singh, S. P., Jeena, A. S., Khan, K. A., Negi, T. A., & Koujalagi, D. (2018). Study of genetic variability, heritability and genetic advance for various yield and Quality traits in sugarcane genotypes (Saccharum officinarum). International Journal of Current Microbiology and Applied Sciences, 7(4), 1464–1472. https://doi.org/10.20546/ijcmas.2018.704.165
- Plaza-Diaz, J., & Gil, A. (2016). Encyclopedia of Food and Health. Dietary Importance. https://doi.org/10.1016/B978-0-12-384947-2.00668-1
- Plucknett, D. L., & Smith, N. J. H. (1986). Sustaining agricultural yields. BioScience, 36(1), 40–45. https://doi.org/10.2307/1309796
- Racedo, J., Gutiérrez, L., Francisca Perera, M., Ostengo, S., Mariano Pardo, E., Cuenya, M. I., Bjorn, W., & Castagnaro, A. P. (2016). Genome-wide association mapping of quantitative traits in a breeding population of sugarcane. BMC Plant Biology, 16(1), 1–17. https://doi.org/10.1186/s12870-016-0829-x
- Ram, B., & Hemaprabha, G. (2005). Genetic divergence of sugar yield and its components in flowering type Saccharum officinarum clones. Agricultural Science Digest, 25(2), 118–120.
- Rewati, R. C., & Joshi, D. K. (2005). Correlation and Path Coefficient Analyses in sugarcane. Sugarcane Research Programme-NARC, Jitpur-Bara-Nepal. Journal of Nepal Agricultural Research Council, 6, 25–26. https://doi.org/10.3126/narj/.v6i0.3340
- Rezene, F. (2009). The Status of Biofuels in Ethiopia: Opportunities and Challenges. In IUCN Regional Workshop on Bio-fuel Production and Invasive Species 20-22 April 2009
- Ruggeri, G., & Corsi, S. (2019). An analysis of the Fairtrade cane sugar small producer organizations network. Journal of Cleaner Production, 240(3), 118191. https://doi.org/10.1016/j.jclepro.2019.118191
- Selman-Housein, G., & Miranda, F. (2000). Developments in plant Genetics and breeding: Plant genetic Engineering towards the third Millennium. In Proceedings of the International Symposium on Plant Genetic Engineering 5 (pp. 1–272). 6-10 December 1999
- Semiea, T. K., Thapat, S., & Shabbir, H. G. (2019). The impact of sugarcane production on biodiversity related to land use change in Ethiopia. Global Ecology and Conservation, 18, e00650. https://doi.org/10.1016/j.gecco.2019.e00650
- Simmonds, N. W. (1979). Principles of crop improvement. Longman.
- Sumbele, S. A., Eteckji Fonkeng, E., Akongte, P., Nkumbe Ndille, C., & Henry, A. (2021). Characterization of sugarcane germplasm collection and its potential utilization for evaluation of quantitative traits. African Journal of Agricultural Research, 17(2), 273–282. https://doi.org/10.5897/AJAR2020.14799
- Tai, P. Y. P., & Miller, J. D. (2001). A core collection for Saccharum spontaneum L. from the world collection of sugarcane. Crop Science Society of America, 41(3), 879–885. https://doi.org/10.2135/cropsci2001.413879x
- Teklemariam, M. (1991). Sugar industry development in Ethiopia & its economic impact. ActaHortic, 270(270), 49–56. 5. https://doi.org/10.17660/ActaHortic.1991.270.5
- Tesfaye, W. (2021). Long term sugarcane cultivation effect on selected physical and hydraulic properties of soils at three Ethiopian sugarcane estates. Advances in Crop Science and Technology, 9, 479. http://doi.org/10.11648/j.ajpb.20210603.14
- Wang, J., Nayak, S., Karen Koch, K., & Ray Ming, R. (2013). Carbon partitioning in sugarcane (Saccharum species). Frontiers in Plant Science, 4, 18 June 2013. https://doi.org/10.3389/fpls.2013.00201
- Yang, X., Luo, Z., Todd, J., Sood, S., & Wang, J. (2020). Genome-wide association study of multiple yield traits in a diversity panel of polyploid sugarcane (Saccharum spp.). The Plant Genome, 13(1), 1–1. https://doi.org/10.1002/tpg2.20006