
 ?Mathematical formulae have been encoded as MathML and are displayed in this HTML version using MathJax in order to improve their display. Uncheck the box to turn MathJax off. This feature requires Javascript. Click on a formula to zoom.
Abstract
This paper assessed the smoked marine fish markets along the Central-Ashanti region trade corridor of Ghana by adopting the structure-conduct-performance framework. Through a multi-stage sampling technique, 158 fish smokers, 100 wholesalers, and 120 retailers were sampled for primary data collection. Using the market concentration ratio and Herfindahl-Hirschman Index, the smoked marine fish market was found to be very competitive during the major season and weakly oligopolistic during the minor season, regardless of the fish type traded. The conduct of key market players was done in an open environment devoid of interference or collusion, with minimal entry barriers, if any. Consistent with a priori expectations, the smoked marine fish market performed much better at the retail node than at the processing and wholesale nodes of the chain. However, the most popular marketing channel through which smoked marine fish flows from fish smokers to final consumers via wholesalers and retailers was identified as the least efficient in terms of performance, irrespective of the fish type traded and the season within which the trading occurred.
1. Introduction
Fish is the most preferred and cheapest source of animal protein, particularly in West Africa (Bennett et al., Citation2021; Osei et al., Citation2023). In Ghana, the per capita annual fish consumption is presently estimated to be 28 kg, which exceeds the African and global estimates by 17.5 kg and 7.8 kg respectively (FAO, Citation2022). About 75% of the total annual fish production in West Africa as a whole is locally consumed (FAO, Citation2016). In 2018, the national fish consumption was approximately 775,000 MT, accounting for about 60% of the animal protein requirements of Ghanaians (USDA Foreign Agricultural Service, Citation2019). According to FAO (Citation2016), a typical household in Ghana and other West African countries allocates between 22.4% and 25.7% of their food budget to fish consumption. The increase in fish consumption has been attributed to its availability, perceived health benefits compared to other animal products, and growth in population and income (Afoley, Citation2018; Erdoğan et al., Citation2011). The domestic supply of fish mainly comes from marine, inland (rivers, lakes, and lagoons), and farm operations or aquaculture. Nonetheless, marine remains the key source of local fish production and accounts for about 80% of the total annual fish supply in Ghana, with an estimated average catch of 326,000 MT per annum (Quagrainie & Chu, Citation2019).
It is estimated that about 2.6 million Ghanaians (about 10% of the population) are either directly or indirectly engaged in the activities generated along the fish value chain, resulting in US$ 1 billion annual revenue generation and contributing 5% to annual Gross Domestic Product (Onumah et al., Citation2020; Quagrainie & Chu, Citation2019; USDA Foreign Agricultural Service, Citation2019). As expected, most of the activities along the value chain are linked to the fish processing method adopted. Quagrainie et al. (Citation2009) identified smoking, sun-drying, fermentation, deep-frying, and salting as the common traditional fish processing techniques employed in Ghana. However, smoking is considered the most widely practiced method (Nunoo et al., Citation2015). According to FAO (Citation2016), about 70% – 80% of domestic marine and freshwater catch is consumed in smoked form. The preference for smoked fish is mainly attributed to its prolonged shelf-life (i.e. 6–9 months), which permits storage for the minor season and minimizes waste in periods of bumper catches (Quagrainie et al., Citation2009; Nonoo et al., 2015). Though market prices are determined by the interplay between the forces of demand and supply, with an efficient market functioning, smoked fish could be available all year round (Osei et al., Citation2023). This could render smoked fish more affordable and minimize price fluctuations that characterize the fish markets in Ghana.
Nonetheless, recent studies (see FAO, 2022; Onumah et al., Citation2020; USDA Foreign Agricultural Service, Citation2019) have confirmed that, though smoked marine fish remains the most affordable source of protein compared to meat and meat products, it is increasingly becoming expensive in the Ghanaian market, particularly during the minor season. This could be attributed to seasonal supply deficits, high transportation costs due to fuel price increases, post-harvest losses, and monopolistic or oligopolistic tendencies of a few actors to collude and fix prices as a way of making excessive profits, among others (USDA Foreign Agricultural Service, Citation2019). Thus, the structure of the smoked marine fish market and the conduct of key actors could eventually determine the performance of the market in terms of prevailing prices, costs, margins, and efficiency (Phuu, Citation2016).
A study by USDA Foreign Agricultural Service (Citation2019) projected that population growth could further drive fish consumption or demand upward resulting in higher prices. To guarantee a rise in the country’s yearly fish production, enhance the effectiveness of fish marketing, and augment the overall contribution of the fishery sector to Ghana’s economic development, the government launched the Ghana National Aquaculture Development Plan (GNADP) in 2012. In Citation2014, the Ministry of Fisheries and Aquaculture Development (MOFAD) unveiled the Sector Medium Term Development Plan (SMTDP) to close the enormous disparity between the country’s supply and demand for fish and guarantee a relatively steady price over the medium term (MOFAD, 2014). Besides, the industry received about US$54 million through the West Africa Regional Fisheries Programme (WARFP), with the ultimate goal of bolstering the governance of the use of marine fish resources and tackling issues like overexploitation and the depletion of marine fish stocks, high prices, among other things, to ensure a sustained increase in the industry’s net economic benefits (SRFC, Citation2016). In 2021, MOFAD presented a comprehensive Medium Term Expenditure Framework (MTEF) to conserve marine areas while promoting sustainable development and management of fisheries resources to reduce fish supply deficits (MOFAD, Citation2021).
Despite the sector interventions, localized scarcities and gluts persist in the Ghanaian fish markets (Osei et al., Citation2023). As a result, a holistic assessment of the smoked marine fish market in terms of structure, conduct, and performance is a necessary first step in an attempt to ensure consistent supply, stabilize prices, increase protein intake, and develop the fishery sector at large. Existing studies have focused mainly on identifying the marketing channels of smoked and frozen fish (Alhassan et al., Citation2013), determining the consumption behaviour of low-income households (Afoley, Citation2018), profit efficiency of artisanal fishing (Setsoafia et al., Citation2017), and contribution of microcredit to artisanal fishing (see, Okyere et al., Citation2016; Twumasi et al., Citation2020). The purpose of this paper was to examine the structural organisation of the smoked fish market, the interactive strategic behaviour of different market actors, and the eventual effect on the performance of the market. Specifically, the paper makes the following contributions to the literature. First, it empirically examines how the smoked marine fish market is structured and organised along the value chain. Second, this paper examines the conduct of key market players as well as market performance in terms of margins and efficiency along the smoked marine fish value chain in Ghana. The paper provides policymakers and other stakeholders with empirical data on the perceived informal or unregulated nature of the smoked fish market, the extent of (backward-forward) linkages, and the returns of traders to guide future policy decisions on how competitiveness along the smoked fish value chain could be improved.
2. Overview of the fishery industry in Ghana
The fishery sector in Ghana can be divided into three major components: marine (sea), inland (i.e. rivers, lakes, and lagoons), and aquaculture. The marine fishery sub-sector is made up of small-scale/artisanal fisheries, semi-industrial/inshore, industrial/deep-sea, and tuna fisheries (Failler et al., Citation2014). The Artisanal fishery sub-sector is made up of over 20,000 wooden dug-out canoes mainly motorized with 40HP outboard engines (USDA Foreign Agricultural Service, Citation2019). These canoes operate in 334 landing beaches and 195 fishing communities along the coast. The common fishing gear employed are beach seine, set net, drift gillnet, and hook and line (Failler et al., Citation2014). Electronic fish-finding devices such as echo-sounders have been used by a few artisanal operators in recent years. Over 140,000 Ghanaians, mostly along the coast, are engaged in this sub-sector (USDA Foreign Agricultural Service, Citation2019). Sardinella, anchovy, and mackerel are the common small pelagic fish species exploited by artisanal fishers in Ghana (Nunoo et al., Citation2015). On the other hand, the semi-industrial or inshore fleets comprise about 560 locally built wooden vessels with inboard engines of up to 400 Horsepower (HP) (Nunoo et al., Citation2015). The length of the vessels ranges between 8 and 37 meters. Vessels that are less than 12 meters in length are considered to be small-sized with those between 12 and 22 meters as medium-sized vessels (Failler et al., Citation2014). These vessels operate from four landing centres along the coast and serve the dual purpose of purse seining and bottom trawling (USDA Foreign Agricultural Service, Citation2019). The main species exploited are the small pelagic and demersal fish species such as Sparidae, Sciaenidae, or croakers (e.g. cassava fish), Haemulidae, or grunts, Lutjanidae or snappers, etc.
The industrial fishery sub-sector consists of large steel-hulled foreign-built vessels. They are mainly trawlers, shrimpers, and purse seiners (USDA Foreign Agricultural Service, Citation2019). By law, industrial trawlers are required to operate in waters deeper than 30 meters (Fisheries Act, Citation2002; Fisheries (Amendment) Act, Citation2014). Thus, these vessels are supposed to operate in deep seas and, hence, they are often found in Tema and Takoradi where there are deep-water ports (Failler et al., Citation2014). More than 70 industrial vessels are operating in Ghanaian waters (USDA Foreign Agricultural Service, Citation2019). The vessels target fish species such as groupers, cuttlefish, sparids, and snappers. Besides, there are currently about 20 tuna fishing vessels operating in Ghanaian waters using fishing gear such as poles and lines. The tuna vessels mainly capture yellowfin tuna (Thunnus albacares), skipjack tuna (Katsuwonus pelamis), and bigeye tuna (Thunnus obesus) (Afoley, Citation2018). However, the recent assessment of tuna resources in the Atlantic by the International Commission for the Conservation of Atlantic Tunas (ICCAT) concluded that skipjack tuna is underexploited (Failler et al., Citation2014). As required by law (i.e. Fisheries Act 625 of 2002), most tuna vessels operate on a joint-venture basis with Ghanaian counterparts having at least 50 percent shares (USDA Foreign Agricultural Service, Citation2019). Ghana’s fish export has mainly been in the form of processed tuna. Technically, all inland fisheries are artisanally operating in rivers, lagoons, and lakes. The Volta Lake accounts for 70 percent of the total inland fish catch in Ghana. According to Failler et al. (Citation2014), 17500 canoes are operating in Volta Lake with about 80,000 fishermen and 20,000 fish processors. Cast and gillnets, hook and line, traps, spears, and atidja (brush park) are the popular fishing gears used (USDA Foreign Agricultural Service, Citation2019). The common fish species from the inland sub-sector are tilapia, catfish, mudskipper, grey mullets, crabs, shrimps, and oysters. Overall annual fish catch from the inland sub-sector was estimated to be 77,000MT in 2017 (USDA Foreign Agricultural Service, Citation2019). The aquaculture sub-sector remains under-exploited in Ghana. There are about 4,800 fish ponds in Ghana covering about 705 hectares of land (Afoley, Citation2018). The aquaculture facilities practice both extensive and semi-intensive fish farming systems. The extensive system is practised using dams, dug-outs and small reservoirs whereas the intensive/semi-intensive systems use earthen and concrete ponds, cage/pen cultures usually practiced on water bodies such as rivers, lakes, and lagoons (USDA Foreign Agricultural Service, Citation2019). The target fish species for aquaculture are tilapia, catfish, and heterosis (Afoley, Citation2018). Tilapia accounts for about 88% of the total aquaculture output in Ghana. Catfish and other fish species contribute 10% and 2% respectively to total aquaculture output (Onumah et al., Citation2010).
Marine fishing remains the most important source of domestic fish supply and accounts for about 80% of the total fish catch in Ghana. Aquaculture and the inland sector contribute about 20% to Ghana’s fish production (Quagrainie & Chu, Citation2019). The most important marine resources in Ghana are sardinella, anchovy, mackerel (salmon), chub mackerel, horse mackerel, and tuna, which are sold in markets throughout the country (Ministry of Fisheries and Acquaculture Development (MoFAD), Citation2015; Lazar et al., Citation2017). These fish species (without tuna) constitute over 80% of the total small pelagic fish stocks in Ghana (USDA Foreign Agricultural Service, Citation2019). The annual average fish production from the aforementioned domestic sources (i.e. marine, inland, and aquaculture) from 2008 to 2017 was reported to be 433,500 MT. The annual income from this production was over US$1 billion (USDA Foreign Agricultural Service, Citation2019). However, domestic fish production has not been able to keep pace with the ever-increasing demand. This has resulted in the importation of fish and seafood products mainly from Mauritania, China, Morocco, Netherlands, Spain, and the European Union to augment domestic supplies (Afoley, Citation2018; Failler et al., Citation2014; USDA Foreign Agricultural Service, Citation2019). The volume of fish imports tends to increase during the minor season (November to June) when domestic production is low and decreases in the major or bumper season (July to October). In 2016, though approximately 720,000 MT of fish was required for consumption in Ghana, domestic production was about half (50%) of the demand resulting in a deficit of about 320,000 MT (FAO, Citation2016). In Ghana, fish is consumed in multiple forms such as smoked, sun-dried, fried, and salted (Quagrainie et al., Citation2009). However, smoked fish remains the most widely consumed. The main domestic consumption centres for marine smoked fish are Kumasi and Accra. Other important consumption centres such as Sunyani, Koforidua, and Obuasi receive supplies from smokers along the coastal belt (Quagrainie et al., Citation2009).
2.1. Marketing and distribution of fish in Ghana
Marine fish from both local and imported sources dominate the Ghanaian fish markets. As shown in , fresh fish from fishermen or local inland producers and imports are mostly sold to fish processors (Nunoo et al., Citation2015). The fresh fish is then processed into smoked, sun-dried, fermented, deep-fried, or salted fish for the market. Aside from the fresh fish, imported processed fish are available in the Ghanaian markets. However, as indicated earlier, up to 80% of marine fish in Ghana are consumed in smoked form. The fish smokers or processors or importers usually sell the processed fish in the local/producer markets throughout the country to wholesalers and retailers (USDA Foreign Agricultural Service, Citation2019). The wholesalers buy the processed fish in large quantities from the processors/importers and transport it to the consumer markets in Kumasi, Obuasi, and Tamale by trucks, buses, and taxis. The retailers then purchase the processed fish from either the wholesalers or processors or importers and sell in the local consumer markets or the surrounding communities/villages. In some instances, the consumers buy the fish directly from the processors or processed fish importers.
Figure 1. A typical fish marketing chain in Ghana.
Source: Modified from Nunoo et al. (Citation2015).
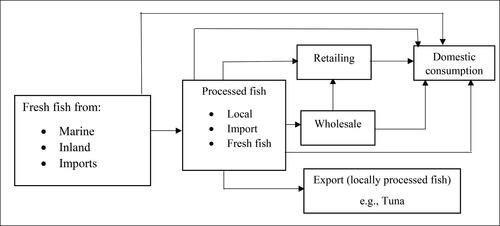
In the markets, fish products are displayed on wooden table tops, flat metal plates, or mats spread on the ground. The common fish species processed and sold in markets throughout the country are mackerel (salmon), sardinella (herrings), anchovies, cassava fish, seabreams, and bonito (Nunoo et al., Citation2015). These fish species are mainly consumed domestically and are less sought after on the global market. There are instances where domestic consumers, mostly along the coastal belt, buy fresh fish directly from the fishermen (Cobbina, Citation2010). Imported fresh fish species such as redfish, mackerel, sardinella, cassava fish, and seabreams are often packed in refrigerated trucks and distributed throughout the country (Quagrainie et al., Citation2009). On the other hand, Ghana operates roughly 32 registered tuna vessels, producing an average of 74,000 tonnes of tuna annually for export due to its high economic value (Ghana Export Promotions Authority, Citation2017). The majority of tuna boats are run as joint ventures, as mandated by the Fisheries Act 625 of 2002, with at least 50% of the shares owned by Ghanaians. Most of the domestic tuna catches are processed into canned tuna or tuna fish meal and exported mainly to European countries (Italy, Spain, France, Turkey, etc.). Canned tuna remains the most important export product for the fisheries sector in Ghana (Nunoo et al., Citation2015).
3. Sampling and data collection
The actors along the smoked marine fish value chain were smokers, wholesalers, and retailers. Multi-stage sampling technique was employed in selecting the respondents. The first stage involved the clustering of Ghana into coastal and forest/savanna belts. In the second stage, the fish landing town of Elmina in the Central region of Ghana was purposively selected out of the coastal belt due to the preponderance of marine fish smokers in the area. Similarly, Kumasi was purposively selected from the forest/savanna belt since it is the hub for the wholesale and retail of smoked marine fish in the country. During the third stage, a simple random sampling technique was employed to select 158 fish smokers from the population of 260 in Elmina based on the Yamane (1967) sample size computation formula to participate in the studyFootnote1. In the Kumasi central market, the wholesalers were identified and 100 of them were selected through a simple random sampling approach. Bantama/Ayigya markets (in Kumasi) were selected as the key retail markets for the study. Since the number of smoked marine fish retailers in these markets was not the same, a quota sampling approach was adopted. Thus, the number of retailers included in each market was determined using their proportional representation in the combined population for the two markets. The individual retailers were then selected through a simple random sampling approach. At the end of the sampling exercise, 120 smoked marine fish retailers (i.e. 40 and 80 retailers from the Ayigya and Bantama markets respectively), 100 wholesalers, and 158 fish smokers were selected: making a total of 378 market players for the study. The quantitative data (e.g. demographic characteristics of actors, prices, volumes of products sold, production and marketing costs, etc.) were collected through personal interviews with the use of validated questionnaires for the different categories of actors along the smoked fish value chain. The qualitative data on the conduct of the market were obtained through key informant interviews with smoked fish market queens and focus group discussions with other association leaders (where applicable).
4. Analytical methods
4.1. Assessing market structure
The structure of the smoked fish market can be assessed using the concentration ratio (CR), Herfindahl-Hirschman Index (HHI), or the Gini-Coefficient. Each of these methodological approaches has its strengths and weaknesses (see Lee, Citation2008 for details). The concentration ratio remains the most widely used measure of market structure. However, this approach has been criticized for relying on the shares of a few arbitrarily selected ‘large firms’ (Molyneux & Forbes, Citation1995). This implies that the conclusion about the structure of the market will be subject to the number of ‘large firms’ selected (usually four or eight large firms). However, the Herfindahl-Hirschman Index (HHI) is specially designed to address the drawbacks of the concentration ratio since it takes into account the distribution of market shares across all firms in the industry. The strength of the HHI lies in its ability to combine information on both the number and size distribution of firms (Smit & Trigeorgis, Citation2004). This attribute makes HHI superior to both the concentration ratio and the Gini-Coefficient since the Gini coefficient reflects only share distribution but not the number of firms in the market. According to Lee (Citation2008), CR and HHI are the two most commonly used concentration indices in empirical studies. For robustness checks, this study employs both the concentration ratio (CR) and Herfindahl-Hirschman Index (HHI).
4.1.1. Computing the concentration ratio (CR)
The most common concentration ratios are CR4 and CR8, which indicate the percentage of market share owned by the largest four firms and the largest eight firms respectively in an industry (Lee, Citation2008: Phuu, Citation2016). Following Lee (Citation2008), the eight-firm concentration ratio (CR8) was adopted. The degree of concentration is computed using the formula below:
(1)
(1)
where
is the market share of the i-th largest firm in the j-th market or industryFootnote2. The j-th market could be smoker/producer, wholesale or retail smoked marine fish market. The value from Equationequation (1)
(1)
(1) is then multiplied by 100 and interpreted as follows. The concentration ratio ranges from 0% to 100%. A concentration ratio that ranges from 0% to 50% is considered a low degree of concentration and it indicates a perfectly competitive market. A concentration ratio above 60% is an indication of oligopoly. If the concentration ratio of one firm is equal to 100%, it is an indication of a monopoly.
4.1.2. Computing the Herfindahl-Hirschman Index (HHI)
The HHI was computed using the formula below
(2)
(2)
where, i = 1, 2, 3… nn = number of firms or respondents,
S = share of the firm in the j-th market.
HHI below 0.01 (or 100) indicates a highly competitive industry; HHI below 0.15 (or 1,500) indicates an unconcentrated industry; HHI between 0.15 to 0.25 (or 1,500 to 2,500) indicates moderate concentration; HHI above 0.25 (above 2,500) indicates high concentration.
4.2. Assessing market conduct
The conduct of the market is generally assessed using a descriptive approach. However, the description of the organization or conduct of the market actors should be based on some established indicators. It is argued that a good market conduct analysis must be able to detect unfair price-setting behaviours of the actors and reveal the conditions under which they prevail (Smit & Trigeorgis, Citation2004). Following Scherer & Ross (Citation1990) and Phuu (Citation2016), the conduct of market actors or participants was assessed using five indicators: (i) extent of price collusion, (ii) buying and selling practices, (iii) product differentiation, (iv) sales promotion strategies, and (v) availability of price and product information (communication approach employed). The extent of collusion was assessed by identifying and examining the existing coordinated restrictions on smoked marine fish that had the potential to raise market prices. The existence of trade associations could also create collusion if they decide to control the market price in a way that could wade off new entrants (Phuu, Citation2016). As emphasized earlier, different buying and selling behaviours of the actors could either render the market competitive or noncompetitive. In a non-competitive market, the law of one price does not hold because of a lack of transparency among actors concerning prices that are charged for their products. Thus, it is not uncommon to have different prices charged to different buyers for the same product in the same market. These buying and selling behaviours were, therefore, observed and examined accordingly. Product differentiation was assessed by examining ways or techniques employed by the actors to make their products unique and more attractive to the buyers. Sales promotion focused on identifying the marketing methods used to attract and maintain customers. Price and product information considered the actors’ means of communication and access to information, particularly on prices from different markets or locations.
4.3. Assessing market performance
The performance of the marine smoked fish market is assessed using both the marketing margin and the market efficiency analyses. The margins alone are not sufficient to describe the performance of the market. In most instances, the profit margin is hugely influenced by the efficiency of the firm (Haruna et al., Citation2012). Thus, efficiency improvements necessarily translate into an increased profit. It is, therefore, assumed that using the two indicators will lead to a better description of the performance of the smoked marine fish market.
4.3.1. Marketing margin analysis
The gross marketing margin (GMM) of the actors along the smoked fish value chain can be computed using the formula:
(3)
(3)
Where is the selling price per 1 kg of smoked marine fish in the j-th market measured in Ghana Cedis (Gh₵);
is the purchase price per 1 kg of smoked marine fish in the j-th market measured in Ghana Cedis (Gh₵). The net marketing margin (NMM) can then be computed as
(4)
(4)
where
is the marketing cost per 1 kg of smoked marine fish in the j-th market (in Ghana Cedis-Gh₵).
4.3.2. Marketing efficiency analysis
Following Acharya & Agarwal (Citation2016), the marketing efficiency along the smoked marine fish value chain (i.e., smokers, wholesalers, and retailers) was assessed using the mathematical formula below:
(5)
(5)
where
is the marketing efficiency;
is the net selling price of fish smokers (selling price – marketing cost);
is the total marketing cost of intermediaries;
is the total net marketing margin of intermediaries; TML is the total marketing loss. The higher the ME ratio, the higher the efficiency, and vice versa. The study considered the efficiency of four main marketing channels in the areaFootnote3.
Channel I: Fish smokers → Wholesalers → Retailers → Consumers
Channel II: Fish smokers → Retailers → Consumers
Channel III: Fish smokers → Wholesalers → Consumers
Channel IV: Fish smokers → Consumers
5. Results and discussion
The demographic characteristics of the actors along the smoked marine fish value chain are presented in . A typical fish smoker or retailer in the smoked marine fish industry was in her mid-forties. The wholesalers appeared to be older (i.e. the late forties) than their counterparts along the value chain. Generally, the age distribution gave an indication that the aforementioned industry was dominated by middle-aged and active individuals. About 71% of the fish smokers and retailers were married. The percentage of married respondents was relatively high (i.e. about 17% more) for the wholesalers. This was expected because an average wholesaler was older than a typical retailer or fish smoker along the value chain. Both the wholesalers and retailers had an average household size of six (6) persons. The fish smokers appeared to have relatively large household members (i.e. 7 members).
Table 1. Demographic characteristics of the respondents.
This could be beneficial if most of the household members were of legal working age and could assist as family labour during the fish smoking activities. However, the relatively high dependency ratio of 90.5% for fish smokers was an indication that most of the household members were not economically active. Specifically, the ratio implied that there were about 91 dependents for every 100 adults who were actively working (possibly as smokers). For the retailers, there was an average of 61 dependents for every 100 adults in active work. The wholesalers recorded the lowest dependency ratio of 57.1%, indicating that 57 dependents for every 100 adults engaged in active economic activities. It is evident from that 15.5% of fish smokers, 14.0% of wholesalers, and 35.6% of retailers had received some form of formal education. This presupposes that the majority of the actors along the smoked marine fish value chain were illiterate or unable to read or write. Fish smokers and wholesalers had approximately 20 years and 15 years of marketing experience respectively. However, the sampled retailers were less experienced in the smoked marine fish industry.
5.1. The market structure
presents the structure of the smoked marine fish markets for each actor in the value chain using indices such as the concentration ratio (CR8) and the Herfindahl-Hirschman index (HHI). The fish smokers recorded CR8 of less than 50% for all the fish types during the major season, indicating a low degree of concentration. However, in the minor season, the anchovies and salmon recorded CR8 above 50% but less than 100% which signified a weak oligopolistic market for the fish smokers. The HHI largely confirmed the conclusions drawn based on the CR8. Specifically, the fish smokers recorded HHI of less than 0.15 in the major season, indicating an unconcentrated industry or market. In the minor season, the index (HHI) experienced marginal increases but remained below the threshold of 0.15 for all fish types. Generally, the market for fish smokers was perfectly competitive in the major season and weakly oligopolistic in the minor season. This finding is consistent with the report from Ojo (2016) concerning the structure of the smoked fish market in Nigeria. The wholesale market for smoked marine fish appeared to have a similar structure to that of the smokers as shown in . The concentration ratios for all fish types were below 50% in the major season but above 50% in the minor season for anchovies and salmon. This presupposed that the wholesale market was generally more competitive in the major season than in the minor season. This could be attributed to the reduction in the supply of smoked fish in the minor season and the attendant decrease in the number of wholesalers who had access to the product, thereby reducing competition in the market. The structure of the retail market introduced an interesting dimension to the discussion that similar products could have different levels of competitiveness in the same market within the same season. Both the CR8 and HHI indicated that the retail market was perfectly competitive in both seasons for herrings but less competitive in the minor season for anchovies. Interestingly, the retail market was less competitive or oligopolistic for salmon in both the major and the minor seasons possibly due to high imports. Overall, the market for fish smokers was the most competitive in the major season compared to the other actors along the chain.
Table 2. Structure of the smoked fish markets.
5.2. The market conduct
All respondents acknowledged the role of supply and demand in price determination and returns to investment in the smoked marine fish industry. Demand mostly exceeded supply in the minor season whilst the reverse happened in the major season. The wholesale markets had fish associations but there was no noticeable barrier to market entry. This might result in pricing disparities for the same fish type at different locations within the market, resulting in a more competitive market. However, the leader of the association, known as the market queen or commodity queen (e.g. ‘Amane Hemaa’), had to be notified before the entry of a new wholesaler. The queens were chosen based on their ethics, expertise, trading success, and leadership abilities (Asomani-Boateng, Citation2016). The market/commodity queens and executives conducted background checks on new entrants to make sure they were trustworthy and had a clean record. Though the said investigation was not meant to prevent market entry, it informed the queens on how a particular newcomer should be advised. Newcomers were welcomed by the market/commodity queens, who also educated them about the regulations and trading conventions in the market. This is consistent with the findings of Erdoğan et al. (Citation2011) that entry in some of the smoked marine fish markets in Ghana is somewhat regulated by the so-called ‘fish mothers’ or ‘queens’. Even though membership in the association was voluntary, it became evident that being a member was necessary for validating one’s position in the market. Though members of the association were not paying monthly dues, they made contributions to support members who were bereaved or in serious difficulties when deemed necessary by executives. Such associations did not exist in the fish smokers and retail markets. Fish smokers and wholesalers could differentiate their products from others using the colour of the fish. The colour of the fish was influenced by the type of firewood used for smoking. On the other hand, there was low product differentiation among the retailers. The market actors generally employed strategies such as credit sales, add-ons/discounts, and other persuasive efforts to attract customers and remain competitive. For credit sales, the terms of the agreement were subjective to specific buyers and sellers. The common one was the buyer paying previous debt when ordering new products on credit without interest. Most of the respondents (at least 90%) confirmed that there was no available information on prices from the markets in other parts of the country. However, they communicated with their customers on the availability or otherwise of their products through mobile phones. For instance, the fish smokers confirmed that they had contacts and lists of regular buyers (wholesalers) whom they alerted through a mobile phone call when the fish was smoked and ready for the market. There were no legal and institutional barriers to market entry. Moreover, no market actor reported any collusion in price setting. The fact that most market participants did not belong to cooperatives and trade associations, where group buying and selling usually takes place, was an indication of the absence of collusion among market actors. According to Porter (2004), when firms collude in an industry, they act in unison and usually set prices high and limit the amount of produce in the market to gain more profit.
5.3. Smoked fish marketing channels
Marketing channels are the sequence of intermediaries through which goods pass from the producers to consumers. The fish smokers (from Elmina) processed the fresh marine fish into the smoked form that was demanded by the market. As shown in , the fish smokers either sold to the wholesalers or retailers or both depending on the quantity of product available and the quantity demanded by the regular customers. A typical marine fish smoker in the study area sold 70%, 20%, and 10% of the smoked fish to wholesalers, retailers, and consumers respectively. Thus, after satisfying the customers such as the wholesalers/retailers from Kumasi and other parts of the country, the rest of the product (about 10%) was sold to household consumers in Elmina and its environs.
Figure 2. The smoked marine fish marketing channel.
Source: Authors’ construct based on Survey data (2019).
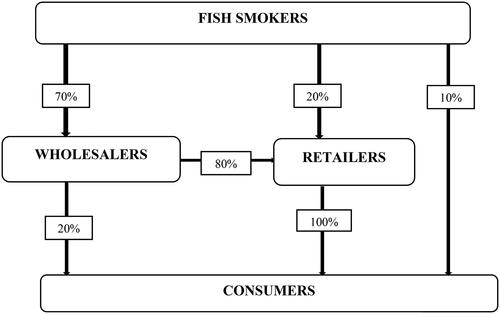
The wholesalers in Kumasi then sold about 80% of the smoked fish mainly to retailers and 20% to household consumers. The retailers who visited the Kumasi markets also bought the smoked marine fish from the wholesalers and transported it to the markets in their communities or villages to be sold to consumers. The consumers comprised restaurants/hotels, chop bar operators, street food vendors, and households.
5.4. The market performance
As emphasized earlier, the actors’ performance along the smoked marine fish value chain was assessed using cost, marketing margins, and marketing efficiency. The gross margin or profit could be the outcome of the efficiency of the actors in terms of cost management among others.
5.5. Costs and marketing margins
presents the average cost and margins per 1 kg of smoked marine fish sold by smokers. The total processing/marketing cost per 1 kg of smoked herrings increased from Gh₵0.50 in the major season to Gh₵0.89 in the minor season (i.e. a difference of Gh₵0.39), probably due to economies of scale resulting from an increased supply of fresh fish for processing or smoking in the major season. Similarly, the total processing/marketing cost per 1 kg of anchovies and salmon increased by Gh₵0.64 and Gh₵0.18 respectively in the minor season. In both seasons, the cost of firewood was the major contributor (over 30%) to the total processing/marketing cost. Labour cost was the second most important item, accounting for almost 22% of the overall marketing cost irrespective of the fish type. This is consistent with a report by Shepherd (Citation2007) that processing is the most important marketing cost along the food value chain. In general, the minor season was marked by higher marketing and processing expenses owing to the smaller amount of fish processed with the same manpower, transportation, and so on, impacting the cost per unit. The corresponding gross margins for herrings were Gh₵5.34 and Gh₵8 .70 for the major and minor seasons respectively. This increase in margin in the minor season could be attributed to the better prices received per 1 kg of herrings during the period. The gross marketing margin per 1 kg of anchovies for smokers was Gh₵1.62 in the major season due to the lower prices received. However, with the supply deficit and the resultant increase in prices, the gross marketing margin per 1 kg of anchovies increased by Gh₵5.8 in the minor season. Salmon followed a similar pattern with a Gh₵3.34 increase in gross marketing margin per 1 kg during the minor season. In the same vein, the corresponding net marketing margins (i.e. gross marketing margin less the marketing cost) increased significantly particularly in the minor season regardless of the fish type. Based on the margins computed, smoked marine fish appeared to be more profitable during the minor season irrespective of the fish type. This finding is consistent with a study by Adedeji et al. (Citation2019) that the smoked marine fish industry is profitable despite the high marketing cost. Overall, the marketing margins calculated for fish smokers showed that herrings were the most profitable, followed by salmon and anchovies.
Table 3. Cost and margins per 1 kg of fish sold by smokers.
The average cost and marketing margins per 1 kg of smoked marine fish sold by the wholesalers are presented in . The total marketing costs per kg of herrings, anchovies, and salmon in the major season were computed to be Gh₵0.59, Gh₵0.60, and Gh₵0.58 respectively, with the cost of transportation accounting for over 50% of the said cost followed by loading/off-loading (at least 30%). Since wholesalers transported smoked fish from the coastal belt (Elmina) to Kumasi, it was not surprising that transportation and its related costs were key cost elements in their operations. The marketing costs increased in the minor season by Gh₵0.27, Gh₵0.41, and Gh₵0.49 for herrings, anchovies, and salmon respectively. A typical wholesaler recorded gross marketing margins of Gh₵4.90, Gh₵8.08, and Gh₵2.28 for a kg of herrings, anchovies, and salmon, respectively sold in the major season. The relatively high margin for anchovies could be attributed to its lower cost price since the remaining fish types had better prices. Besides, the significant margin for anchovy might be an indication that it was the most consumed fish possibly as a cheaper substitute during the minor season where selling prices of the other fish types were relatively high. For the minor season, the wholesalers recorded increases of Gh₵2.01, and Gh₵3.98 in gross marketing margins for herrings and salmon respectively. The gross marketing margin for anchovies, however, dropped by Gh₵4.02 during the period due to the Gh₵8.26 increase in the cost price of smoked fishFootnote4. Based on both the gross and net marketing margins, anchovies were most profitable in the major season whereas herrings became most profitable in the minor season. This result is in line with the findings of Bukenya et al. (Citation2012) that the wholesale of smoked fish appears to be a lucrative enterprise, particularly in West Africa. However, the findings of this study are at variance with the conclusion by Bukenya et al. (Citation2012) that the wholesale of smoked fish in Uganda is more profitable than the retail. This could be attributed to the differences in the cost structure of the wholesaling and retailing of smoked fish in Uganda compared to Ghana. For instance, unlike the wholesale smoked fish markets in Ghana, the wholesalers in Uganda considered transportation as the lowest marketing cost item.
Table 4. Marketing cost and margins per 1 kg of smoked fish for wholesalers.
The average marketing cost and margins per 1 kg of smoked marine fish sold by the retailers are presented in . The total marketing costs per kg of herrings, anchovies, and salmon were computed to be Gh₵1.22, Gh₵1.30, and Gh₵1.31 respectively during the major season. These costs were much higher than those stated by the other players, suggesting that the fish smokers’ close proximity to the market and the wholesalers’ large purchases contributed to a lower cost per kg of fish sold. As expected, the total marketing cost increased by Gh₵0.49, Gh₵0.46, and Gh₵1.67 for herrings, anchovies, and salmon during the minor season. Similarly, the gross marketing margins for herrings increased marginally from Gh₵9.26 in the major season to Gh₵10.04 in the minor season. The margins for anchovies, however, almost doubled during the minor season possibly due to better prices. Besides, the gross marketing margins for salmon increased from Gh₵3.18 during the major season to Gh₵7.12 in the minor season. But for herrings, there were significant increases in marketing margins during the minor seasons as shown in . Based on both the gross and net marketing margins, herrings were the most profitable smoked fish among the retailers in the major season followed by anchovies. The reverse was true in the minor season.
Table 5. Marketing cost and margins per 1 kg of fish for retailers.
5.6. Comparing net marketing margins among actors (using the Kruskal-Wallis H test)
The average net marketing margins for the three actors (i.e. fish smokers, wholesalers, and retailers) along the smoked marine fish value chain could be compared using either the Analysis of Variance (ANOVA) or the Kruskal-Wallis H test. The Kruskal-Wallis H test is non-parametric and can be relied upon when the parametric assumptions of ANOVA such as normality and homogeneity of variances were not satisfied by the data. From (in ), the null hypotheses of the Shapiro-Wilk test that the net marketing margins were normally distributed were rejected for all fish types for the various actors in both seasons. Again, the null hypothesis of Leven’s test that variance was homogeneous was rejected for all fish types for the various actors for the two seasons. Since the normality and homogeneity of variances assumptions were not satisfied by the data, the non-parametric Kruskal-Wallis H test was employed instead of the parametric ANOVA. As shown in , the null hypothesis of the Kruskal-Wallis H test that there were no statistically significant differences in net marketing margins for all the actors along the smoked marine fish value chain was rejected for herrings and anchovies but not salmon for the two seasons.
Table 6. Comparing net marketing margins (NMM) actors per 1 kg of fish sold.
To determine the sources of the differences, there was the need for a Post Hoc test. The outputs of the Post Hoc tests are presented in . The test results indicated statistically significant differences in net marketing margins between smoker – retailer, and wholesaler – retailer pairs but not a smoker –wholesaler pair for herrings in the major season. This suggests that the wholesalers (Gh₵4.31) and the fish smokers (Gh₵4.31) made less profit per kg of herrings compared to the retailers (Gh₵8.04). However, only wholesaler – retailer pair observed a significant difference in the margins during the minor season for herrings. Thus, the retailers made more profit (Gh₵2.28) than the wholesalers for herrings in the minor season. Though the retailers incurred highest transportation costs per unit of product sold, they brought the product closer to the consumers which was a form of value addition and attracted better prices. This explains why their profit margin per unit of product sold was relatively high compared to the other actors. As emphasized earlier, the retail markets were located in residential areas of the town and, hence, the proximity to the consumers attracted a premium price. But for smoker–wholesaler pairs, all pairings recorded significant differences for anchovies regardless of the season. Specifically, the wholesalers made more profit (Gh₵ 7.48) than the fish smokers (Gh₵ 1.11) and the retailers (Gh₵ 4.71) per 1 kg of anchovies in the major season. According to the retailers interviewed, the demand for smoked anchovies was generally low during the major season due to the availability of other high-valued fish types (e.g. salmon, herrings, etc) at affordable prices. As a result, attempts to obtain better prices due to proximity to consumers proved futile. In the minor season where there was a supply deficit, the net marketing margin of the retailers (Gh₵ 8.74) was significantly higher than that of fish smokers (Gh₵ 6.27) and the wholesalers (Gh₵ 5.43).
Table 7. Post Hoc tests for the Kruskal-Wallis H statistic.
5.7. Marketing efficiency
The marketing efficiency estimates of the smoked marine fish value chain are presented in . The value chain actors found it extremely difficult to quantify the marketing losses since none of the smoked fish was thrown away due to spoilage. However, it was discovered that quality losses in the form of breakages and discoloration occurred, leading to lower prices in some instances. This finding is consistent with the reports by Dapaah & Samey (Citation2015) and Kaminski et al. (Citation2020) that marketing losses in the smoked fish industry are mainly economic or value reduction. The actors were, therefore, asked to report the money they would have received if there were no quality losses. The difference between the actual price or money received by the intermediaries and the expected amount (in the absence of quality losses) was interpreted as a marketing loss.
Table 8. Marketing efficiency estimates.
The total marketing losses of the intermediaries per kg of smoked fish sold ranged from Gh₵0.29 - Gh₵0.47, Gh₵0.22 - Gh₵0.38, and Gh₵0.26 - Gh₵0.41 for herrings, anchovies, and salmon respectively depending on the season and the marketing channel used. Besides, the fish smokers who sold directly to consumers (i.e. channel IV) recorded higher net prices and net marketing margins (). The efficiency estimates for all the channels were above 0.5 which was an indication of quite a profitable marketing system. Thus, smokers, wholesale, and retail markets were generally performing well. Marketing channel IV (i.e. smokers → consumers) appeared to be the most efficient marketing system or channel in both seasons irrespective of the fish type. Channel III (i.e. smokers →wholesalers →consumers) was the second most efficient marketing system in the area studied. Interestingly, the most popular marketing channel (Channel I) in the study area which comprised the flow of fish from the smokers to the wholesalers through to the retailers (as indicated by the volumes of smoked fish traded in ), appeared to be the least efficient channel compared to the other three channels irrespective of the fish type and the season. Generally, the marketing of salmon was the most efficient followed by anchovies.
6. Conclusions and recommendations
Using cross-sectional data from 158 fish smokers, 100 wholesalers, and 120 retailers in Ghana, this study analysed the structure, conduct, and performance of actors along the smoked marine fish value chain. It was discovered that the smoked marine fish market was very competitive in the major season but weakly oligopolistic during the minor season regardless of the fish type or the actors. The market was conducted in an open environment devoid of interference or collusion with no entry barriers. The retailers recorded a relatively high marketing margin compared to the wholesalers and fish smokers. Though all three marketing channels were efficient, channel I (flow of fish from the smokers to the wholesalers through to the retailers), which was the most popular channel in the study area, was the least efficient compared to the other three channels irrespective of the fish type and the season. Overall, the smoked marine fish market was efficient and functioning or performing well. To reduce the supply deficits and increase the competitiveness of the smoked marine fish markets throughout the year, the government should institute policies such as banning small-meshed beach seine nets for fishing and closing off important breeding areas of the sea from fishing to achieve the long-term benefit of increased fish population and adequate fish supplies to the market. The road conditions, particularly those linking the fishing communities to the market centres, should be upgraded to lower transportation costs and, as a result, minimize the marketing cost for the intermediaries in the smoked fish sector. Fish smokers should be sensitized and encouraged by government agencies to consider affordable sources of fire for smoking such as organic charcoal briquettes and sawdust instead of depending hugely on traditional firewood, which is considered the most expensive cost element aside from the cost price of fresh fish, to reduce processing cost and become more profitable.
Disclosure statement
The authors declare that there is no competing interest.
Additional information
Notes on contributors
Awura-Abena Amoah Osei
Awura-Abena Amoah Osei is a Lecturer at the Department of Agricultural Economics and Extension Education, Akenten Appiah-Menka University of Skills Training and Entrepreneurial Development, Ghana. She holds PhD, MPhil and BSc in Agribusiness Management from the Kwame Nkrumah University of Science and Technology (KNUST), Ghana. Her research focuses on performance of agricultural markets, consumer perception and wiliness to pay, volatility in staple food prices, and project evaluation.
Seth Etuah
Seth Etuah is a Senior Lecturer at the Department of Agricultural Economics, Agribusiness, and Extension of KNUST. He holds a PhD in Agricultural Economics from KNUST. His research focuses on food and consumer economics, efficiency and productivity analysis, true pricing, impact assessment, market integration/price transmission and price volatility.
Isaac Abunyuwah
Isaac Abunyuwah is an Associate Professor at the Department of Agricultural Economics and Extension Education, Akenten Appiah-Menka University of Skills Training and Entrepreneurial Development, Ghana. He holds a PhD in Agricultural Economics from the Georg-August-Universität Göttingen, Germany. His research focuses on Applied Statistics/Econometrics and Market Integration Analysis.
Nicholas Oppong Mensah
Nicholas Oppong Mensah is a senior lecturer at the Department of Agribusiness Management and Consumer Studies (DAMCS), University of Energy and Natural Resources, Sunyani-Ghana. His research interests include but not restricted to: Agricultural tax, Financial Resilience and Investment, Pensions and social protection for Agribusiness sector, agricultural risk management, enterprise risk management, agricultural insurance, food banking, food marketing and agribusiness value and supply chains.
Robert Aidoo
Robert Aidoo is an Associate Professor of Agricultural Economics at the Department of Agricultural Economics, Agribusiness Extension in the Faculty of Agriculture, KNUST-Kumasi. He has conducted various studies in the agricultural/agribusiness sector over the past 20 years. He has led different research teams to conduct research for reputable organizations such as UNHCR (Ghana office), International Labour Organization (ILO-Ghana office), World Food Program (WFP-Ghana office), Danida, International Institute of Tropical Agriculture (IITA-Ibadan, Nigeria), USAID ASSESS Project, Overseas Development Institute (ODI-UK), , among others.
Simon Cudjoe Fialor
Simon Cudjoe Fialor is an Associate Professor at the Department of Agricultural Economics, Agribusiness and Extension of the Kwame Nkrumah University of Science and Technology (KNUST), Kumasi. He holds a PhD in Agricultural Economics from the University of Newcastle Upon Tyne in England. His teaching and research works focus on the major topics in agricultural economics, with emphasis on agricultural marketing and policy, agribusiness and development economics issues.
Notes
1 Yamane (1967) sample size computation formula was employed in determining the respective samples for the actors. Thus, ; where n is the sample size, N is the population, and e is the margin of error. For the population of fish smokers (260), wholesalers (134), and retailers (171), samples of 158, 100, and 120 were respectively selected for the study.
2 Share is computed as the ratio of quantity of product sold or produced by the i-th largest firms in the j-th market to the quantity of product sold or produced by all the firms in the j-th market.
3 The channel from fish smokers to consumers was unpopular because most of the traders were unable to satisfy the recent stringent standards of the HACCP (Hazard Analysis Critical Control Points) to enter the international markets (Bomfeh et al., Citation2017; Antwi, Citation2019).
4 US$1 = GH₵5.53 (Bank of Ghana, Citation2019).
Refernces
- Acharya, S. S., & Agarwal, N. L. (2016). Agricultural marketing in India (pp.1). 6th ed., Oxford and IBH, New Delhi.
- Adedeji, T., Osundare, F., & Ajiboye, A. (2019). Profitability and Market efficiency of smoked fish: An empirical evidence from Ondo State. Nigeria. International Journal of Agricultural Extension and Rural Development Studies, 6, 26–16.
- Afoley, Q. E. (2018). Fish consumption behavior of low-income households in urban areas of Greater Accra and Northern regions of Ghana [Masters thesis]. Department of agricultural economics and agribusiness, University of Ghana.
- Alhassan, E. H., Boateng, V. F., & Ndaigo, C. (2013). Smoked and Frozen fish consumption and marketing channels in the Tamale Metropolis of Ghana. Ghana Journal of Development Studies, 9(1), 21–28. https://doi.org/10.4314/gjds.v9i1.2
- Antwi, H. (2019). Demand-driven value chain of smoked fish among small-scale fish processors in Ghana. United Nations University Fisheries Training Programme, Iceland. Final project. http://www.unuftp.is/static/fellows/document/Hannah18prf.pdf
- Asomani-Boateng, R. (2016). Local networks: Commodity queens and the management of organic solid waste in indigenous open-air markets in Accra, Ghana. Journal of Planning Education and Research, 36(2), 182–194. https://doi.org/10.1177/0739456X15604445
- Bank of Ghana. (2019). Monthly exchange rates indicators. Towards Blue Transformation. https://www.bog.gov.gh/economic-data/exchange-rate/
- Bennett, A., Basurto, X., Virdin, J., Lin, X., Betances, S. J., Smith, M. D., Allison, E. H., Best, B. A., Brownell, K. D., Campbell, L. M., Golden, C. D., Havice, E., Hicks, C. C., Jacques, P. J., Kleisner, K., Lindquist, N., Lobo, R., Murray, G. D., Nowlin, M., … Zoubek, S. (2021). Recognize fish as food in policy discourse and development funding. Ambio, 50(5), 981–989. https://doi.org/10.1007/s13280-020-01451-4
- Bomfeh, K., DeMeulenaer, B., Jacxsens, L., Amoa-Awua, W. K., Tandoh, I., Afoakwa, E. O., DieiOuadi, Y., & GarridoGamarro, E. (2017). Improving the safety of smoked fish through kiln design the case of FAO-Thiaroye technique in Ghana. FAO.
- Bukenya, J. O., Hyuha, T., Twinimasiko, J., & Moinar, J. (2012). Economics of fish marketing in Central Uganda: A preliminary analysis [Paper presentation]. The Southern Agricultural Economics Association Annual Meeting, Birmingham, AL. Selected paper prepared for presentation at.
- Cobbina, R. (2010). Aquaculture in Ghana: Economic perspective of ghanaian aquaculture for policy development. Final Project. The United Nations University. Fisheries Training Programme.
- Dapaah, G., & Samey, B. (2015). Post harvesting loss reduction study report. In The USAID/Ghana Sustainable Fisheries Management Project (SFMP) (pp. 90). Coastal Resources Center, Graduate School of Oceanography, University of Rhode Island and SNV Netherlands Development Organization.
- Erdoğan, B. E., Mol, S., & Coşansu, S. (2011). Factors influencing the consumption of seafood in Istanbul, Turkey. Turkish Journal of Fisheries and Aquatic Sciences, 11, 631–639. https://doi.org/10.4194/1303-2712-v11_4_18
- Failler, P., Beyens, Y., & Asiedu, B. (2014). Value chain analysis of the fishery sector in Ghana with focus on quality, environmental, social, sustainable, food safety, organic requirements and its compliance infrastructure Value chain analysis of the fishery sector in Ghana with focus on quality. Trade Capacity Building Programme Ghana, (November 2015), 1–98. https://doi.org/10.13140/RG.2.1.2421.5201
- FAO. (2022). The state of world fisheries and aquaculture 2022. Towards Blue Transformation. https://doi.org/10.4060/cc0461en
- FAO. (2016). Fishery and aquaculture country profiles – The republic of Ghana. FAO Fisheries and Aquaculture Department.
- Fisheries (Amendment) Act. (2014). (ACT 880). http://extwprlegs1.fao.org/docs/pdf/gha151988.pdf
- Fisheries Act. (2002). (ACT 625). https://www.ilo.org/dyn/natlex/docs/ELECTRONIC/88535/101263/F583967126/GHA88535.pdf
- Ghana Export Promotion Authority. (2017). Potential markets-tuna. https://www.gepaghana.org/cms/wp-content/uploads/2017/05/Tuna-Potential-markets-Ghana.pdf
- Haruna, I., Nkegbe, P., & Ustarz, Y. (2012). Structure, conduct and performance of tomato marketing in Ghana. Journal of Economics and Sustainable Development, 10(3), 2222–2855.
- Kaminski, A. M., Cole, S. M., Al Haddad, R. E., Kefi, A. S., Chilala, A. D., Chisule, G., Mukuka, K. N., Teoh, C., Ward, S. J., & A. R., Longley. (2020). Fish losses for whom? A gendered assessment of post-harvest losses in the Barotse Floodplain Fishery, Zambia. Sustainability, 12(23), 10091. https://doi.org/10.3390/su122310091
- Lazar, N., Yankson, K., Blay, J., Ofori-Danson, P., Markwei, P., Agbogah, K., Bannerman, P., Sotor, M., Yamoa, K. K., & Bilisini, W. B. (2017).Status of the small pelagic stocks in Ghana (2015). Scientific and Technical Working Group of USAID/Ghana Sustainable Fisheries Management Project (SFMP). Coastal Resources Center, Graduate School of Oceanography, University of Rhode Island. GH2014_ACT093_CRC 28. pp.
- Lee, C. (2008). SCP NEIO and Beyond. https://www.ifn.se/BinaryLoader.axd?OwnerID=8b3118ed41044869aa60973d85526fbb&OwnerTye=0&PropertyName=File1&FileName=Chapter%202%20SCP%20NEIO% 20and%20Beyond.pdf
- Ministry of Fisheries and Acquaculture Development (MoFAD). (2015). National fisheries management plan, Government of Ghana.
- Ministry of Fisheries and Aquaculture Development -MoFAD. (2014). Sector medium-term development plan (2014-2017). Accra: Ministry of Fisheries and Aquaculture Development and Fisheries Commission. https://www.mofad.gov.gh/wp-content/uploads/2016/09/MOFAD-AT-GLANCE.pdf
- Ministry of Fisheries and Aquaculture Development -MoFAD. (2021). Medium term expenditure framework (MTEF) for 2021-2024. Accra. https://mofep.gov.gh/sites/default/files/pbb-estimates/2021/2021-PBB-MoF.pdf
- Molyneux, P., & Forbes, W. (1995). Market structure and performance in European banking. Applied Economics, 27(2), 155–159. https://doi.org/10.1080/00036849500000018
- Nunoo, F. K. E., Asiedu, B., Kombat, E. O., & Samey, B. (2015). Sardinella and other small pelagic value and supply chain of the fishery secotor, Ghana. In The USAID/Ghana Sustainable Fisheries Management Project (SFMP); Narrangansett RI, Coastal Resources Center, Graduate School of Oceanography. University of Rhode Island, Kingston, USA and Netherlands Development Organisation. 2015.
- Okyere, O. D., Coleman, M., & Amoateng, E. (2016). Contribution of microcredit of artisanal fishing in sekondi-takoradi metropolis western region of Ghana. Journal of Social Science Studies, 3, 205–216.
- Onumah, E. E., Brümmer, B., & Hörstgen-Schwark, G. (2010). Elements which delimitate technical efficiency of fish farms in Ghana. Journal of the World Aquaculture Society, 41(4), 506–518. https://doi.org/10.1111/j.1749-7345.2010.00391.x
- Onumah, E. E., Quaye, E. A., Ahwireng, A. K., & Campion, B. B. (2020). Fish consumption behaviour and perception of food security of low-income households in urban areas of Ghana. Sustainability, 12(19), 7932. https://doi.org/10.3390/su12197932
- Osei, A. A. A., Etuah, S., Aidoo, R., Fialor, S. C., & Adams, F. (2023). Drivers of smoked marine fish prices and challenges along the value chain. International Journal of Social Economics, 50(2), 242–259. https://doi.org/10.1108/IJSE-09-2021-0566
- Phuu, Z. (2016). Analysis of structure, conduct and performance of cabbage market in central district of Botswana [An unpublished Master of Science thesis]. University ofNairobi].
- Quagrainie, K. K., & Chu, J. (2019). Determinants of catch sales in Ghanaian artisanal fisheries. Sustainability, MDPI, Open Access Journal, 11, 1-10, 11(2), 298. https://doi.org/10.3390/su11020298
- Quagrainie, K. K., Dennis, J., Coulibaly, J., Ngugi, C., & Amisah, S. (2009). Developing Supply Chain and Group Marketing Systems for Fish Farmers in Ghana and Kenya, Marketing, Economic Risk Assessment & Trade/Study &Activity/07MER02PU. TechnicalReports: Investigations2007-2009.
- Scherer, F., & Ross, D. (1990). Industrial market structure and economic performance (3rd ed.).
- Setsoafia, D. E., Owusu, P., & Danso-Abbeam, G. (2017). Estimating profit efficiency of artisanal fishing in the Pru district of the Brong-Ahafo Region, Ghana. Advances in agriculture. https://doi.org/10.1155/2017/5878725
- Shepherd, A. W. (2007). A guide to marketing costs and how to calculate them. In Agricultural management, marketing and finance service rural infrastructure and agro-industries division. Food and agriculture organization of the United Nations.
- Smit, H., & Trigeorgis, L. (2004). Strategic investment: Real options and games. Princeton University Press.
- Sub Regional Fisheries Commission- SRFC. (2016). West Africa regional fisheries program (WARFP). http://spcsrp.org/en/west-africa-regional-fisheries-program-warfp
- Twumasi, A. M., Yuansheng, J., Danquah, O. F., Chandio, A. A., & Asiamah, K. B. (2020). Determinant of credit constraint of artisanal fishermen in Ghana. Ciencia Rural, Santa.
- USDA Foreign Agricultural Service. (2019). Ghana: Fish and seafood report.
Appendix
Table A1. Normality and homogeneity of variance tests prior to the Kruskal-Wallis H test.