
 ?Mathematical formulae have been encoded as MathML and are displayed in this HTML version using MathJax in order to improve their display. Uncheck the box to turn MathJax off. This feature requires Javascript. Click on a formula to zoom.
Abstract
Improper mechanical threshing can lead to fissuring and breakage of rice grains, resulting in lower milling quality and increased quantity losses, especially in locally produced rice in Africa due to poor post-harvest practices. This study examined the effects of moisture content (MC), drum peripheral speed (DS) and spike spacing (SS) on grain damage during threshing of three locally grown rice varieties: Shaga, Ediget and Nerica-4. Hand threshing served as the control group. Fissured and broken grain varied significantly by variety, MC, DS, SS and interaction effects. Ediget variety had the highest percentage of fissured grain, while Nerica-4 had the highest percentage of broken grain. As MC increased from 11.44% to 24.01%, fissured and broken grains decreased significantly for all varieties. As DS increased from 17.3 to 24.6 m/s, fissured and broken grain also increased. As SS decreased from 80 to 60 mm, fissured and broken grain increased. Furthermore, the interaction effects also affect grain fissuring and breakage significantly. In general, lower grain fissuring and breakage was observed at highest MC (23.43–24%), lower tip DS (17.3 m/s) and wider SS (80 mm) for all studied varieties. Pre-threshing grain fissuring and breakage had a greater contribution to overall grain damage at lower MC levels. Harvest MC was found to be the most influential factor affecting fissured and broken grain, followed by DS and SS. Overall, these results highlight the importance of proper threshing techniques and highlight areas where improvements can be made to reduce post-harvest losses and improve rice quality.
1. Introduction
Rice, Oryza sativa L., is the most important food crop in developing countries and the staple food for more than half of the world population. It is the most rapidly growing food source in Africa. This rapid growth has made rice the fastest emerging cereal crop in sub-Saharan Africa (SSA) and the second most important source of energy in the continent (Arouna et al., Citation2021). Rice production is increasing from 26.8 million MT in 2011 to 37.2 million MT in 2021 in Africa (FAOSTAT, Citation2023). Despite these trends, total demand for rice in Africa exceeds local production, and 40% of the rice consumed is imported (Riaz et al., Citation2017).
Although rice production in Africa is increasing every year, little attention is given for postharvest handling practice. According to Seck et al. (Citation2012), current postharvest rice handling practices in Africa cause a physical loss of about 15–25%, and due to poor quality an additional financial loss of 20–30% would occur at the market. In addition, the local rice is cheaper in price than the imported one in the domestic market. This is because the locally produced rice in Africa tend to be poor quality due to high percentage of broken rice (Nahemiah et al., Citation2021). Threshing practice is one of the most important factors affecting postharvest rice quality and quantity losses. In most African countries, such as Ethiopia, threshing is commonly conducted in a traditional way by trampling the grain with a team of oxen and/or beating it with a stick. Under this system, quantitative and qualitative postharvest losses are often very high. Therefore, introducing and promoting appropriate threshing technologies is an important element to minimize losses and maintain the quality of paddy rice, which directly affects processing.
There are numerous factors that determine rice milling quality. One of these factors is the degree of mechanical damage to the grain before milling, which includes grain breakage and fissuring. In spike tooth type axial thresher, threshing is carried out by applying impact force by the spike to the straw and grain panicle. However, excessive impact force on the grains during threshing can cause significant grain fissuring and breakage, resulting in lower milling quality (Sharma et al., Citation1992). Mechanical threshing damage is influenced by the crop, the machine and the operating parameters. Some of these factors include grain and straw moisture content (MC), grain–straw ratio, threshing mechanism, threshing drum length and diameter, threshing concave clearance, threshing drum peripheral speed (DS) and feed rate (Srivastava et al., Citation2013). Numerous previous works have been conducted in light of these factors (Alizadeh & Khodabakhshipour, Citation2010; Ardeh & Gilandeh, Citation2008; Ghoname et al., Citation2023; Liquan et al., Citation2020; Rana Shahzad Noor et al., Citation2023; Osueke, Citation2013; Parihar et al., Citation2022; Sessİz et al., Citation2011; Singh et al., Citation2023; Suleiman et al., Citation2019).
Numerous past studies have been conducted on the effects of machine-crop parameters on rice grain fissuring and breakage during threshing (Alizadeh & Khodabakhshipour, Citation2010; Bhardwaj et al., Citation2021; Olaye et al., Citation2016; Sessİz et al., Citation2011). Alizadeh and Khodabakhshipour (Citation2010) studied the effect of grain MC and drum speed on grain damage for an axial thresher. They have reported that the higher the drum speed and the lower the MC, the greater the rate of breakage and fissuring. Olaye et al. (Citation2016) evaluated a locally manufactured axial rice thresher and investigated the effects of threshing drum speed of the axial thresher on mechanical damage to grains. They reported that when the threshing drum speed was increased from 600 rpm to 1200 rpm, the grain damage increased from 2.63% to 16.45%. On the other hand, Sessİz et al. (Citation2011) reported that DS has no effect on grain fissuring and breakage. Bhardwaj et al. (Citation2021) studied the effects of spike arrangement, cylinder speed and concave clearance of a conventional combine for basmati rice. They found that both higher speeds and higher number of spikes were observed to have a direct effect on the percentage of broken and fissured grain.
Although threshing is a crucial step in rice processing, there is still a gap in comprehensive research regarding the effects of threshing machine operating parameters and crop-specific factors on grain breakage and fissuring. Previous studies have often investigated the effects of individual parameters, such as grain MC or machine parameters, on grain breakage and fissuring. However, the complex interaction between machine operating parameters (e.g. DS, spike arrangement) and crop-specific parameters (e.g. MC, variety) has not been thoroughly explored. In addition, there are no previous studies that take into account the initial condition of the grain before threshing (pre-threshing damage), which influences the susceptibility of grains to damage during the threshing process. It is important to fill these research gaps with a holistic and systematic approach to optimize the threshing process and minimize grain damage, which is critical for maintaining the quality of rice. Therefore, the objective of this study was to investigate the effects of grain MC, DS and spike arrangement and their interactions on grain damage during threshing in three locally grown rice varieties considering the initial condition of the grain.
2. Materials and method
This experiment was conducted to study the effects of grain MC, DS, spike spacing (SS), variety and their interaction on grain fissuring and breakage during mechanical threshing.
2.1. Description of the test thresher
The study used an axial flow mechanical thresher, as depicted in . It has an open spike tooth type threshing cylinder with ten uniformly spaced threshing bars. The cylinder measures 300 mm in diameter and 880 mm in length. The spike tooth has diameter of 10 mm and length of 80 mm, which were bolted in helical arrangement on the threshing bars evenly to assist material flow in axial direction. The thresher was also equipped with straw throwers with five throwing blades.
Figure 1. The test thresher (a) during testing (b) threshing cylinder (c) threshing concave.
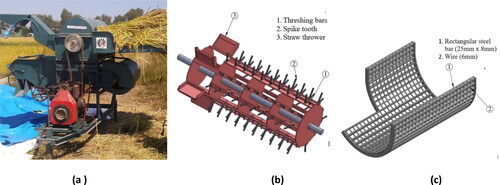
The threshing concave was made of a rectangular steel bar (25 × 8 mm) and a wire (6 mm). The thresher has a fixed concave clearance of 20 mm. Moreover, the thresher was equipped with a four-blade blowing fan with adjustable lip chaffer and cleaning sieve moved in an oscillating motion. A 14 hp diesel engine was used as a power source.
2.2. Experimental design
Factorial design with three replication and four factors, were employed. The four factors include: DS, SS, variety (VAR) and rice kernel MC. All the factors were tested at three levels. Therefore, for three replications a total of 243 (3*3*3*3*3) experiments were conducted. Manual threshing (hand rubbing) of rice was taken as control experiment. The effect of each independent factor and interactions among factors on grain breakage and fissured grain during threshing were studied. Details of factors and levels are shown in .
Table 1. Details of experimental factors and levels.
2.3. Experimental parameters measurement
2.3.1. Harvest moisture content
Farmers in the study area use open sun drying to dry the paddy to average MC of about 11–13% wet basis in the field before harvest. But, according to international rice research institute (IRRI) harvesting and threshing of rice has to be performed at about 22–24% MC wet basis and followed by appropriate drying, for better head rice yield (Sreenivasulu, Citation2019). Based on these practices, in this study three different harvest MC is selected in the range of 11–24% wet basis as a treatment as shown in .
2.3.2. Rice varieties used in this study
Three commonly grown rice varieties, Shaga, Ediget and Nerica-4, which are widely farmed in North-Western Ethiopia, were used for this experiment. Nerica-4, is the most widely adopted upland variety, grown in more than 10 SSA countries (AfricaRice, Citation2023). Shaga and Ediget are local improved rain-fed lowland rice varieties. Shaga has a brown seed color whereas Ediget and Nerica-4 are white in color.
Paddy dimensions and brown rice bending strength for studied varieties were measured for randomly selected 100 paddy rice grains and the mean result is presented in . Shaga is the shortest grain in length. Ediget is the thickest and widest whereas Nerica-4 is the longest, narrowest and thinnest grain under study. Based on paddy rice length–width ratio (i.e. grain shape) classification of IRRI, Ediget and Shaga, are a medium-grain variety, whereas, Nerica-4 is a long grain variety (Sreenivasulu, Citation2019). The maximum breaking force was measured using Stable micro system food texture analyzer, model TA.XTplusC.
Table 2. Grain dimensions and maximum breaking force in bending.
2.3.3. Cylinder peripheral speed
Mechanical threshing of rice can be done with wide range of rotational cylinder speed depending on the crop condition such as MC and variety (Ardeh & Gilandeh, Citation2008; Naik et al., Citation2010; Olaye et al., Citation2016). In order to determine the experimental cylinder speed for this experiment, preliminary trial have been conducted for proper threshing condition. Based on the observation made during the preliminary trials, three rotational speeds (RPM) of 720, 870 and 1020 were selected and the experiment was conducted with these levels. For each angular speed, DS (m/s) was computed corresponding to the base and tip of the spikes on the threshing cylinder using EquationEquation (1)(1)
(1) and the results are tabulated in .
(1)
(1)
where:
v: drum peripheral speed, in m/s
r: threshing drum radius, in meter
RPM: angular speed in revolutions per minute.
2.3.4. Spike arrangement
In this experiment, three different spike arrangements based on spacing between spikes and number of spikes was employed. The spacing between each spike was 60, 70 and 80 mm along the threshing bar with the number of spikes 120, 100, 80, respectively, were considered as a treatment in this experiment. These spike arrangements were selected based on locally available spike tooth type axial threshers.
2.3.5. Feed rate
The experiment was conducted at a constant feed rate. This feed rate was determined based on the highest possible threshing capacity and efficiency that can be achieved without plugging while threshing the highest moisture paddy (≅24%, wet basis) at lowest selected tip DS (17.3 m/s). Previous studies reported that, while threshing wet paddy threshers run very roughly and the material tends to accumulate at the end of the drum causing plugging (Andrews et al., Citation1993; Gummet et al., Citation1992). Hence, appropriate feed rate that avoid plugging at lowest selected DS and at highest MC is determined to be 600 kg/h before the actual test is commenced using trial and error method. Furthermore, less than 0.2% of unthreshed grain, most of them were immature, were observed at the specified conditions during preliminary test.
2.4. Experimental procedures
The three rice varieties under study were grown for testing purposes in North-Western Ethiopia, in the Amhara region, Fogera district, on the compound of Fogera National Rice Research and Training Center under rainfed condition in the period from July to October 2021. The rice varieties were planted by hand transplanting method and weed control and other agronomic practices were carried out according to agronomic recommendations. When the rice reached maturity, each rice variety was harvested manually with a sickle at three different moisture levels (as shown in ) during the period from October to December 2021. In order to avoid bias due to field variation, the rice samples to be threshed for each test were harvested using a completely randomized procedure. All randomizations were determined by a lottery system prior to testing.
The MCs were measured using the oven dry method as described in Kshirod (Citation2011) as well as the SATAKE MOISTEX digital grain moisture meter (model SS-8, measurement range 8.7–40% and accuracy 0.5%) with three replications. The MC on wet basis, MC (%), was determined using EquationEquation (2)(2)
(2) for oven dried samples. Both approaches resulted in similar results, with differences of less than 0.8%.
(2)
(2)
Where
%MC = MC wet basis
Ww = Weight of the sample before oven dry (wet weight)
Dw = Weight of the sample after oven dry (dry weight).
The threshing experiment was conducted immediately after harvesting was finished on the same day, to minimize any other factor that might cause rice grain quality loss. Preliminary threshing trials were made before the actual tests were conducted so as to adjust and calibrate the thresher for proper working conditions. Threshing cylinders with three different spike arrangement were assembled turn by turn to conducted the experiment as designed. Cylinder rotational speeds were adjusted by changing the position of throttle control lever of the engine repeatedly until the required angular speed is achieved. The rotational cylinder speed (RPM) was measured using a Hioki Laser Tachometer (model FT3406, accuracy ±2%, measuring range 30–9999 rpm).
For each treatment combination, threshing experiment were conducted for 10 min with equal amounts of rice bundles at an average constant feed rate of 600 kg/h of fresh biomass, with three replicates. After each experiment, a sample of 1 kg was collected from the grain outlet of the thresher for laboratory analysis. The samples were sealed in a plastic bag and stored in a refrigerator at 4 °C until fissured and broken grain analyses were performed. Flow chart showing experimental procedures is depicted in .
Figure 2. Flowchart for the experimental procedure.
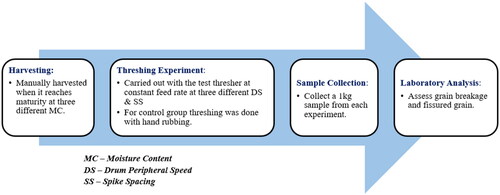
Rice grain might be fissured in the field even before harvesting due to poor preharvest management and moisture adsorption. Therefore, to investigate and distinguish pre-threshing damage and grain damage solely attributed to threshing operation a control experiment is performed. In doing so, paddy rice is harvested with sickle manually and threshed by hand rubbing for each harvest MC with three replications for every studied variety. Threshing by hand rubbing assumed to cause no grain damage to the grain. Then a sample of 1 kg was collected and sealed in a plastic bag and stored in a refrigerator at 4 °C until fissured and broken grain analyses were performed.
2.5. Laboratory analysis and analytical procedures
2.5.1. Grain breakage assessment
Three samples of 100 g each were taken from threshed grains of each experiment randomly for analysis. Separate those grains that were broken crushed or dehulled (partially or fully) and weigh. Percentages of broken grains, , were computed using EquationEquation (3)
(3)
(3) .
(3)
(3)
where:
– is the weight of damaged grains in the sample (g).
2.5.2. Fissured grain assessment
Fissured kernels were determined by randomly taking a sample of 100 kernels from the threshed grains of each experiment and the husk was removed by hand. Then the brown rice kernels were inspected for fissures with the help of grain purity board. The purity board was provided with two magnifying lenses with diameter 100 mm and focal length 20 cm, two bulb candles with 25 W, and opal glass with measuring scale. The number of fissured kernels () were determined and percentages of fissured grains,
, were calculated using EquationEquation (4)
(4)
(4) .
(4)
(4)
2.5.3. Pre-threshing grain damage assessment
Contribution of pre-threshing grain damage (fissured and broken grain) to the overall grain damage was analyzed using EquationEquations (5)(5)
(5) and Equation(6)
(6)
(6) . This analysis was performed by considering fissured and broken grain recorded after each threshing experiment (overall fissured and broken grain) is the sum total of pre-threshing grain damage (fissured and broken grain percentage observed in hand threshed sample at each MC) and net threshing operation fissured and broken grain. In other word, fissured and broken grain recorded after each threshing experiment is from the two sources, i.e. pre-threshing damage (initial condition of the grain) and threshing operation damage.
(5)
(5)
(6)
(6)
where:
CPTgf (%) – contribution of pre-threshing grain fissuring in (%) to the overall grain fissuring
CPTgb (%) – contribution of pre-threshing grain breakage (%) to the overall grain breakage
FgHT – Fissured grain percentage observed in hand threshed sample at each MC
FgHT – Fissured grain percentage observed in machine threshed sample at each MC
BgHT– Broken grain percentage observed in hand threshed sample at each MC
BGMT– Broken grain percentage observed in machine threshed sample at each MC.
2.6. Data analysis
Multilevel factorial design, comprising three varieties, three MC, three drum speed and three SS were used in the experiment. The analysis of variance of general linear model (GLM), multivariate procedures were deployed using IBM SPSS statistical package software (version 27). Treatment means were considered significantly different if p-value, p < 0.05.
3. Result and discussion
shows the effects of the independent variables, VAR, MC, DS, SS and their interaction on fissured and broken grain as obtained through the ANOVA. The results indicated that effects of all the main effects (VAR, MC, DS and SS) and some of the interaction effects (VAR*MC, VAR*DS and MC*DS) on fissured and broken grain percentage are highly significant (p < 0.01). Furthermore, the interaction effect MC*SS and VAR*MC*DS affects percentages of broken grain significantly at p < 0.01.
Table 3. ANOVA results for effects of VAR, MC, DS, SS and their interaction on fissured and broken grain.
3.1. Studied variety response on fissuring and grain breakage
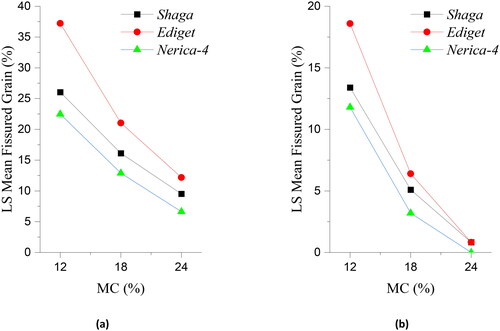
The least square (LS) mean percentage of fissured grain for experimental group (machine threshed) and control group (hand threshed) is shown in . Fissured and broken grain observed in hand threshed sample can be considered as pre-threshing grain damage or initial conditions of the grain. As it is indicated in , for hand threshed group, initially at 24% MC little or no difference was observed in percent fissured grain among studied varieties. Then, as MC decreased, fissured grain percentage was increased for all varieties. However, the rate of increment in fissured grain was varied with variety. Ediget, which is the widest and thickest of all studied varieties, was found to have higher mean percentage of fissured grains. In contrast, lower percentage of fissured grain was recorded for Nerica-4, which is long grain variety. This phenomenon happened in the field before threshing operation was performed. This would be because of differences in moisture gradient among varieties based on their kernel sizes. There would be a higher moisture gradient in short and medium grain varieties than long grain varieties (Dong et al., Citation2010; Fan et al., Citation2000). This could result in higher fissure rate in short and medium grain varieties than long grain varieties. Likewise, higher fissured grain percentage for the experimental group was recorded in Ediget variety as shown in . This would be because some grains might weaken by the moisture gradient inside the kernels but not fissured before threshing operation and easily fissured during machine threshing. This speculation might require further investigation.
Figure 3. Mean fissured grain (%) at different level of MC, (a) experimental group (b) control group.
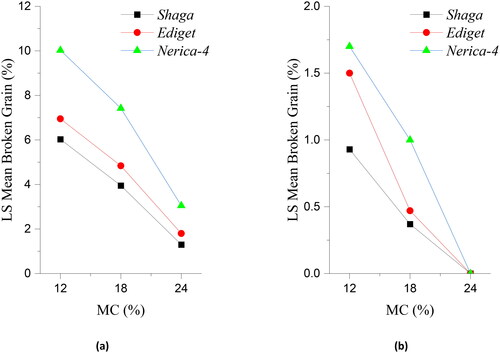
On the other hand, higher grain breakage was observed in Nerica-4 than in Ediget and Shaga varieties as shown in . This could be due to the fact that Nerica-4 is a longer and narrower variety and may have a higher likelihood of breakage during threshing than Ediget and Shaga, which are medium grain varieties. Furthermore, Nerica-4 has lower bending strength than the other studied variety, which might result in higher susceptibility for grain breakage during threshing.
Figure 4. Mean broken grain (%) at different level of MC, (a) experimental group (b) control group.
In summary, varieties respond differently in grain fissuring and breakage during harvesting period and threshing operation. Furthermore, the result also indicated that higher level fissured and broken grain at the pre-threshing stage resulted in higher level of fissured and broken grain during the threshing operation. This shows that the initial condition of the grain has an effect on the level of grain mechanical damage during threshing.
3.2. Effects of MC on grain breakage and fissuring
As it is indicated in and , the result demonstrated that percentage of fissured and broken grains was increased with a decrease in MC in all studied varieties for both control and experimental group. The increments in fissured grain percentage for the control group (hand threshed sample) would be due to rapid moisture absorption by dried kernels below the critical MC at which fissure occurs. This has been sufficiently studied and reported previously (Bautista et al., Citation2009; Siebenmorgen et al., Citation1992). The objective here is to quantify pre-threshing grain fissuring and breakage and to investigate their contribution to the overall grain damage during mechanical threshing.
The increments in fissured and broken grain percentage for the experimental group are due to the moisture absorption in the field and mechanical damage during the threshing operation. The result showed that, as MC decreases from 24% to 12% on average, the LS mean fissured grain increased from 9.5% to 26.0% for Shaga, 12.2% to 37.2% for Ediget and 6.6% to 22.5% for Nerica-4, respectively. Likewise, the LS mean broken grain increases from 1.3% to 6.0% for Shaga, 1.8% to 7.0% for Ediget and 3.1% to 10.0 for Nerica-4, respectively. Generally, as harvest MC decreases both fissured and broken grain percentage during threshing increases. Similar results were reported by Andrews et al. (Citation1993), Alizadeh and Khodabakhshipour (Citation2010) and Ardeh and Gilandeh (Citation2008). This might be because as the grain MC decreases, more grains might become fragile and failed to resist the impact force exserted by the threshing mechanism. This indicates that the optimum harvest MC is a very critical factor so as to reduce mechanical grain damage which in turn improves the head rice yield.
depicted the percentage contribution of pre-threshing fissured and broken grain to the overall grain fissuring and breakage at different MC for studied varieties. The result showed that pre-threshing fissured and broken grain contribution to the overall grain fissuring and breakage increases significantly (p < .05) as the MC decreases. This implies that the contribution of damage caused by the threshing operation to the overall grain damage decreases significantly as the MC decreases. This shows that all observed fissured and broken grain during mechanical threshing are not only from the threshing operation, some grains were damaged before threshing operation in the field. This damage becomes sever as the MC decreases and varies with variety. Hence, in order to reduce mechanical grain breakage, which actually influence one of the milling quality indices, i.e. head rice yield, harvest MC has to be investigated and optimized for each variety.
Table 4. Contribution of pre-threshing fissured and broken grain to the overall grain damage.
3.3. Cylinder peripheral speed
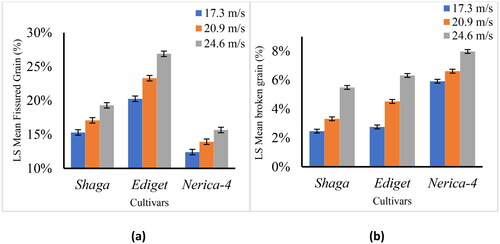
The result showed that the percentage of fissured and broken grains increases with cylinder peripheral speed. As shown in as the cylinder tip peripheral speed increases from 17.3 to 24.6 m/s, the LS mean fissured grain increases from 15.3% to 19.3% for Shaga, 20.26% to 26.89% for Ediget and 12.41% to 15.67% for Nerica-4, respectively. Likewise, the LS mean broken grain increases from 2.47% to 5.49% for Shaga, 2.76% to 6.31% for Ediget and 5.91% to 7.97 for Nerica-4, respectively, as the cylinder tip peripheral speed increases from 17.3 to 24.6 m/s as depicted in . This is due to the fact that an increase in cylinder speed increases the impact force on the grains. In addition, higher speeds can also cause the grains to be thrown away and collide with the walls of the cylinder and concave, which can cause damage. Similar results were reported by Esgici et al. (Citation2020), Olaye et al. (Citation2016), Alizadeh and Khodabakhshipour (Citation2010) and Bhardwaj et al. (Citation2021).
Figure 5. LS mean (a) fissured, and (b) broken grain, at different drum peripheral speed.
3.4. Spike arrangement
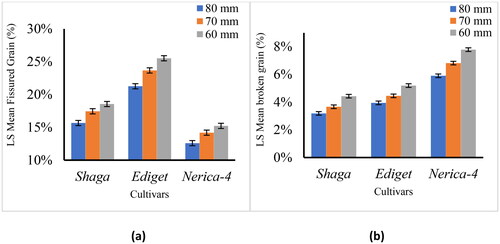
As it is depicted in , when the spacing between the spikes was decreased or the number of spikes per unit surface area of the drum was increased, the percentage of broken and fissured grains was increased. As the spacing between spikes was decreased from 80 to 60 mm, LS mean percentage of fissured grain was increased, from 15.67% to 18.56% for Shaga, 21.26% to 25.52% for Ediget and 12.59% to 15.22% for Nerica-4, respectively. Similarly, LS mean broken grain was increased, from 3.19% to 4.43% for Shaga, 3.94% to 5.19% for Ediget and 5.90% to 7.79% for Nerica-4, respectively, as the SS was decreased from 80 to 60 mm. This could be due to the fact that as the number of spikes increases, the grains are hit more frequently by the spikes, resulting in a higher proportion of fissured and broken grains. Similar results were reported by Bhardwaj et al. (Citation2021).
Figure 6. LS mean (a) fissured, and (b) broken grain, at different drum peripheral speed.
3.5. Interaction effects
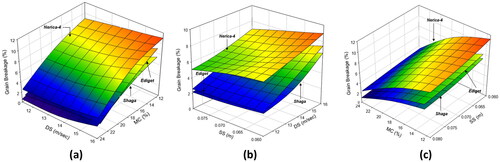
Two-way interaction plots for fissured and broken grain percentages are depicted in and . The result showed that the maximum threshing breakage of 12.3% was observed in Nerica-4 variety at the lowest MC (MC-3), highest drum speed (DS-3) and shortest SS (SS-3). In Ediget and Shaga varieties, threshing breakage of 11.4% and 9.97%, respectively, was recorded at about the same level of factors. The highest percentage of cracked grain, 46.0%, was observed for the Ediget variety at the lowest MC (MC-3), highest cylinder velocity (DS-3) and shortest SS (SS-3). At about the same level of factors, 31.33% and 25.33% fissured grains were observed for Shaga and Nerica-4 varieties, respectively.
Figure 7. Effects of interactions of independent variable of fissured grain, a) MC versus DS, b) DS versus SS and c) MC versus SS, on fissured grain.
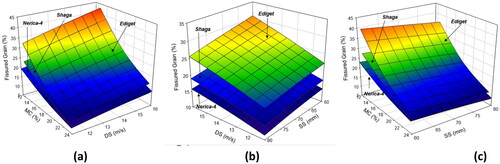
Figure 8. Effects of interactions of independent variable of on grain breakage a) MC versus DS, b) DS versus SS and c) MC versus SS.
3.6. Regression analysis
The dependent variables (fissured and broken grain percentage) were regressed on predicting variables of harvest MC (%), tip drum peripheral speed, DS (m/s) and SS (mm) for all studied varieties. The independent variables significantly predicted fissured grain and broken grain percentage for all studied varieties, at p < 0.001, as shown in and . Furthermore, the R2 value depicts that the model explains 92.2%, 93.1% and 95.1% of the variance in fissured grain and 86.4%, 88.0% and 92.9% of the variance in grain breakage for Shaga, Ediget and Nerica-4 varieties respectively.
Table 5. Regression results for fissured grain (%) for different threshing conditions.
Table 6. Regression results for broken grain (%) for different threshing conditions.
Coefficients were further evaluated to determine the influence of each of the factors on the dependent variables (fissured and broken grain percentage). The result showed that harvest MC and SS negatively affect fissured and broken grain percentage, whereas DS positively affect fissured and broken grain percentage for all studied varieties as indicated in and .
The influence of each variable on fissured and broken grain percentage for all studied varieties, are indicated by standardized coefficients (beta coefficients) and t statistic in and . The result showed that for all studied varieties, harvest MC (with the highest beta coefficient and t-statistic) was the most influential factors that affect fissured and broken grain percentage, followed by cylinder peripheral speed and SS.
4. Conclusions
In this study, the effects MC, DS and SS, and their intractions on grain fissuring and breakage in threshing paddy rice were investigated for three rice varieties. Grain fissuring and breakage varies significantly with variety under different threshing conditions. Fissured grain was higher for Ediget variety, which is medium grain, and lower for Nerica-4 variety, which is long and slender grain. Furthermore, broken grain was higher in Nerica-4 variety and lower for Shaga variety, which is medium grain.
Pre-threshing grain fissuring and breakage increases as harvest MC decreases. Furthermore, percentage contribution of pre-threshing grain fissuring and breakage to the overall grain fissuring and breakage increases as harvest MC decreases for all varieties.
The most influential parameter that affect grain fissuring and breakage during threshing is harvest MC. Generally, as harvest MC decreases both pre-threshing and after threshing grain fissuring and breakage increases. The result also showed that the percentage of fissured and broken grains increases with cylinder peripheral speed and decreases with SS. Furthermore, the interaction effects also affect grain fissuring and breakage significantly.
In summary, varieties respond differently in grain fissuring and breakage with MC and threshing machine parameters. Not all observed fissure and breakage of grain is from the threshing process alone; some grains were already damaged in the field before threshing. This damage becomes sever as the MC decreases and varies with variety. Hence, to reduce mechanical grain damage, which actually influence one of the milling quality indices, particularly head rice yield, it is recommended to investigate the optimal harvest MC for each variety. This should be done while also considering other important factors like percentage of immature grains. Carefully balancing these parameters for each variety is important to reduce grain damage and improve milling quality.
Acknowledgments
We thank Amhara Metal Industry and Machine Technologies Development Enterprise for developing the test thresher and Fogera National Rice Research and Training Center for growing the rice varieties and providing laboratory facilities to conduct the research.
Disclosure statement
The authors declare that they have no competing interests.
Data availability statement
In accordance with the principles of open and transparent research, the data that support the findings of this study are available upon request. Researchers and interested parties can contact the corresponding author with email [email protected] to request access to the data. Please note that, the data will be shared upon request with no other special requirements.
Additional information
Notes on contributors
Solomon Tekeste Hailemesikel
Solomon Tekeste Hailemeskel is a PhD candidate at Bahir Dar Institute of Technology, Bahir Dar University, where he is studying agricultural mechanization engineering with a focus on improving rice post-harvest handling practices. He holds a BSc in Agricultural Engineering and Mechanization from Hawassa Institute of Technology, Hawassa University, and an MSc in Mechanical Design from Addis Ababa Institute of Technology, Addis Ababa University. Prior to his doctoral studies, he was involved in numerous agricultural mechanization research projects that served the needs of smallholder farmers. His current PhD research aims to develop innovative solutions for enhancing post-harvest handling practices with the goal of improving milling quality of rice.
Mersha Alebachew
Mersha Alebachew Fetene is an Associate Researcher in Agricultural Engineering at the Fogera National Rice Research and Training Center, Ethiopian Institute of Agricultural Research in Ethiopia. He obtained his MSC degree in Agricultural Mechanization Engineering from Bahir Dar Institute of Technology, Bahir Dar University, and his BSc degree in Biosystems Engineering from Hawassa Institute of Technology, Hawassa University. Currently, he serves as the Head of the Agricultural Engineering Sector at the Fogera National Rice Research and Training Center, Ethiopian Institute of Agricultural Research.
Mulugeta Admasu Delele
Mulugeta Admasu Delele (PhD) is a professor at the faculty of chemical and food engineering, Bahir Dar Institute of Technology. He has an extensive experimental and modelling research experience in different biosystems.
Addisu Negash Ali
Addisu Negash Ali (PhD) is an Associate Professor of Mechanical Engineering specialized in Mechanical Design at Bahir Dar Institute of Technology, Bahir Dar University, Bahir Dar, Ethiopia. He completed his PhD, MSc. and BSc. Degree at the National Taiwan University of Science and Technology, Addis Ababa University, and Arba Minh University respectively. Currently, he is the Chair of Mechanical Design at the Faculty of Mechanical and Industrial Engineering, Bahir Dar Institute of Technology, Bahir Dar University.
Solomon Workneh Fanta
Solomon Workneh Fanta (PhD) is a Professor of Bio systems Engineering at Bahir Dar Institute of Technology, Bahir Dar University, Bahir Dar, Ethiopia. He completed his PhD, MSc. and BSc. Degree at the KULeuven, Indian Institute of Technology, and Bahir Dar University respectively. Currently, he is the Dean of Faculty of Chemical and Food Engineering, Bahir Dar Institute of Technology, Bahir Dar University.
Geta Kidanemariam
Geta Kidanemariam Gelaw (PhD) is an Assistant Professor of Mechanical Engineering specialized in Mechanical Design at Bahir Dar Institute of Technology, Bahir Dar University, Bahir Dar, Ethiopia. He completed his PhD at Addis Ababa University in Mechanical Design and his MSc in Agricultural Mechanization Engineering in Nitra University Slovakia Republic. Currently, he is a chair of Agricultural Mechanization Engineering at Faculty of Mechanical and Industrial Engineering, Bahir Dar Institute of Technology, Bahir Dar University, Bahir Dar Ethiopia.
References
- AfricaRice. NERICA. Retrieved 27 September 2023, from https://www.africarice.org/nerica.
- Srivastava, A. K., Goering, C. E., Rohrbach, R. P., & Buckmaster, D. R. (2013). Engineering principles of agricultural machines (2nd ed.). American Society of Agricultural and Biological Engineers. https://doi.org/10.13031/epam.2013
- Alizadeh, M. R., & Khodabakhshipour, M. (2010). Effect of threshing drum speed and crop moisture content on the paddy grain damage in axial-flow thresher. Cercetări Agronomice în Moldova, 43(144), 1–14. https://repository.uaiasi.ro/xmlui/handle/20.500.12811/2571
- Andrews, S. B., Siebenmorgen, T. J., Vories, E. D., Loewer, D. H., & Mauromoustakos, A. (1993). Effects of combine operating parameters on harvest loss and quality in rice. Transactions of the ASAE, 36(6), 1599–1607. https://doi.org/10.13031/2013.28501
- Ardeh, E. A. A., & Gilandeh, Y. A. (2008). Investigation of the effective factors on threshing loss, damaged grains percent and material other than grain to grain ratio on an auto head feed threshing unit. American Journal of Agricultural and Biological Sciences, 3(4), 699–705. https://doi.org/10.3844/ajabssp.2008.699.705
- Arouna, A., Fatognon, I. A., Saito, K., & Futakuchi, K. (2021). Moving toward rice self-sufficiency in sub-Saharan Africa by 2030: Lessons learned from 10 years of the Coalition for African Rice Development. World Development Perspectives, 21, 100291. https://doi.org/10.1016/j.wdp.2021.100291
- Bautista, R. C., Siebenmorgen, T. J. and Mauromoustakos, A. (2009). The role of rice individual Kernel moisture content distributions at harvest on milling quality. Transactions of the ASABE, 52(5), 1611–1620. https://doi.org/10.13031/2013.29112
- Bhardwaj, M., Dogra, R., Javed, M., Singh, M., & Dogra, B. (2021). Optimization of conventional combine harvester to reduce combine losses for basmati rice (Oryza Sativa). Agricultural Sciences, 12(03), 259–272. https://doi.org/10.4236/as.2021.123017
- Dong, R., Lu, Z., Liu, Z., Koide, S., & Cao, W. (2010). Effect of drying and tempering on rice fissuring analysed by integrating intra-kernel moisture distribution. Journal of Food Engineering, 97(2), 161–167. https://doi.org/10.1016/j.jfoodeng.2009.10.005
- Esgici, R., Pekitkan, F. G., & Sessiz, A. (2020). Evaluation of cylinder rotational speed for rice grain losses and broken grain ratio. Journal of Agricultural Machinery Science, 16(2), 28–33. http://dergipark.org.tr/tr/pub/tarmak.
- Fan, J., Siebenmorgen, T. J. and Yang, W. (2000). A study of head rice yield reduction of long- and medium-grain rice varieties in relation to various harvest and drying conditions. Transactions of the ASAE, 43(6), 1709–1714. https://doi.org/10.13031/2013.3072
- FAO. Production: Crop and livestock products. Retrieved 26 September 2023, from https://www.fao.org/faostat/en/#data/QCL.
- Ghoname, M. S., Soltan, M. A., Bahnas, O. T., & Fouda, T. Z. (2023). Modification of a combine harvester rice threshing device. Agricultural Engineering International: CIGR Journal, 25(2), 101–109. https://cigrjournal.org/index.php/Ejounral/article/view/8501
- Gummet, M., Kutzbach, H. D., Mühlbauer, W., Wacker, P., & Quick, G. R. (1992). Performance evaluation of An IRRI axial-flow paddy thresher. Agricultural Mechanization in Asia, Africa and Latin America (AMA), 23(3), 47–54.
- Kshirod, R. B. (2011). Rice Quality: A guide to rice properties and analysis. Woodhead Publishing Limited. www.woodheadpublishing.com.
- Liquan, T., Zhengzhong, Z., Yongsen, X., Meiqiao, L., & Rendiao, J. (2020). Development and experiment on 4LZ-4. 0 type double speed and double action rice combine harvester. International Journal of Frontiers in Engineering Technology, 2(3), 1–15. https://doi.org/10.25236/IJFET.2020.020301
- Nahemiah, D., Nkama, I., Yahaya, I. P., Badau, M. H., & Umar, A. (2021). Advances in rice postharvest loss reduction strategies in Africa through low grade broken rice fractions and husk value addition. Recent advances in rice research (pp. 207–226). IntechOpen. https://doi.org/10.5772/intechopen.94273
- Naik, R. K., Patel, S., Verma, A. K., & Shrivastava, A. K. (2010). Effect of crop and machine parameters on performance of paddy thresher. Agricultural Engineering Today, 34(1), 30–32. indianjournals.com/ijor.aspx?target=ijor:aet&volume=34&issue=1&article=005
- Rana Shahzad Noor, F. H., Khan, H. F., Shah, A. A., & Shah, A. N. (2023). Effect of crop maturity condition and operating factors on the threshing performance of wheat thresher. Journal of Pure and Applied Agriculture, 8(2), 21–36. Retrieved from https://ojs.aiou.edu.pk/index.php/jpaa/article/view/1464
- Olaye, A. R. I. B., Moreira, J., Hounhouigan, J., & Amponsah, S. K. (2016). Effect of threshing drum speed and crop weight on paddy grain quality in axial-flow thresher (ASI). Journal of Multidisciplinary Engineering Science and Technology, 3, 3716–3721.
- Osueke, E. C. O. (2013). Study of the influence of crop, machine & operating parameters on performance of cereal threshers. International Journal of Engineering Research and Development, 7(9), 1–9. Retrieved from International Journal of Engineering Research and Development (IJERD).
- Parihar, D. S., Shrivastava, A. K., Singh, A. K., Singh, N. K., Mahadik, A. S., & Awasthi, V. J. (2022). Optimization of operational parameters for axial flow paddy thresher using RSM. International Journal of Environment and Climate Change, 12(9), 253–263. https://doi.org/10.9734/ijecc/2022/v12i930762
- Riaz, M., Ismail, T., & Akhtar, S. (2017). Harvesting, threshing, processing, and products of rice. Rice production worldwide. Springer. https://doi.org/10.1007/978-3-319-47516-5_16.
- Seck, P. A., Diagne, A., Mohanty, S., & Wopereis, M. C. S. (2012). Crops that feed the world 7: Rice. Food Security, 4(1), 7–24. https://doi.org/10.1007/s12571-012-0168-1
- Sessİz, A., Esgici, R., Güzel, E., & Özcan, M. (2011, September 21-24). Performance evaluation of axial-flow and tangential flow threshing units for rice [conference presentation]. 11th International Congress on Mechanization and Energy in Agriculture, Istanbul, Terkey.
- Sharma, A. D., Kunze, O. R., & Sarker, N. N. (1992). Impact damage on rough rice. Transactions of the ASAE, 35(6), 1929–1934. https://doi.org/10.13031/2013.28817
- Siebenmorgen, T. J., Counce, P. A., Lu, R., & Kocher, M. F. (1992). Correlation of head rice yield with individual kernel moisture content distribution at harvest. Transactions of the ASAE, 35(6), 1879–1884. https://doi.org/10.13031/2013.28810
- Singh, P. D., Shrivastava, A. K., & Vishnu, A. (2023). Effect of machine and crop parameters on paddy (Oryza sativa) threshing using axial flow thresher. Journal of Agricultural Engineering, 59(3), 229–239. https://doi.org/10.52151/jae2022593.1778
- Sreenivasulu, V. M. B. N.Jr., (2019). Improving head rice yield and milling quality: State-of- the-art and future prospects. In N. Sreenivasulu (Ed.), Rice grain quality: Methods and protocols, methods in molecular biology (pp. 1–18). Springer. https://doi.org/10.1007/978-1-4939-8914-0
- Suleiman, J., Dangora, N. D., & Attanda, M. L. (2019). Development of a regression model for predicting rice grain breakages for Deutz-Fahr M1202 combine harvester. Bayero Journal of Engineering and Technology, 14(1), 47–53.