
Abstract
Business intelligence (BI) systems has been widely publicised as providing immense benefits to organisations that have implemented it. Yet, very few studies have empirically evaluated these assertions theoretically. The main aim of this study is to empirically evaluate the impacts of adopting BI systems on organisational performance of banks. A conceptual model was developed using the balanced scorecard. Data were collected through hand-administered survey questionnaires from the universal banks in Ghana where 130 samples from executives were analysed through partial least squares structural equation modelling (PLS-SEM). The results indicate that BI Systems indeed have a positive significant effect on the learning and growth, internal process and customer performances of the banks. However, the findings proved that the adoption of BI systems does not directly lead to the financial performance of the banks, but rather through the indirect effects of learning and growth, internal process and customer performances thus confirming the core premise of the balanced scorecard. A major practical implication from the study is that vendors can capitalise on the findings to promote their BI products.
Public Interest Statement
The need for intelligence in today’s competitive globalised world is inevitable, hence organisations adopt business intelligence (BI) systems to outperform their competitors. However, most of the benefits reported about BI Systems have been anecdotal with dearth of empirical evidence. This study evaluates the impact of BI systems on organisational performance using Ghanaian banks as a case study to ascertain if indeed the adoption of BI systems can have a significant impact on the organisational performance of the banks. The findings revealed that indeed the adoption of BI systems impacted positively on Ghanaian Banks’ learning and growth, internal business process and customer performances. The results, however, showed that the adoption of BI Systems does not directly lead to the financial performance of the banks, but rather through the indirect effects of learning and growth, internal business process and customer performances.
1. Introduction
The use of business intelligence (BI) systems to provide support for the achievement of a firm’s strategic business goals, business process reengineering, provision of higher quality of information and eventually better support for decision-making (Watson & Wixom, Citation2007) has made it a very popular technology recently for both researchers and practitioners (Olszak & Ziemba, Citation2012). Various components of BI Systems are used by employees in various positions to access the firm’s data, work with the data and analyse it for managing the operations of the firm. This helps to improve the firms operations efficiently. BI can also assist a firm to discover new opportunities and also help in reengineering their operational activities (Howson, Citation2007). As a result, literature points out that a lot of organisations have implemented BI systems using maturity models and critical success factors (CSFs) (Dawson & Van Belle, Citation2013; Fedouaki, Okar, & Alami, Citation2013; Hribar Rajterič, Citation2010; Olszak & Ziemba, Citation2012; Yeoh & Koronios, Citation2010; Yeoh, Koronios, & Gao, Citation2008). As BI is still evolving and new tools are always emerging, many organisations keep upgrading and spending heavily to improve their systems. Gartner (Citation2017) reported that the “global revenue in the business intelligence (BI) and analytics software market is forecasted to reach $18.3 billion in 2017” which is “an increase of 7.3% from 2016”, based on the latest forecast from Gartner, Inc. They continued further to predict that “by the end of 2020, the market is forecasted to grow to $22.8 billion”. Gartner (Citation2017) emphasised that most of these spending will result from modern BI and analytics platforms which continue to grow more rapidly than the overall market, and thus balancing the drop in traditional BI spending. Generally, the modern BI and analytics platform were developed recently in order “to meet new organisational requirements for accessibility, agility and deeper analytical insight, shifting the market from IT-led, system-of-record reporting to business-led, agile analytics including self-service” (Gartner, Citation2017).
Ubiparipović and Đurković (Citation2011) asserted that contemporary banks face challenges such as fierce competition, a highly dynamic market, the necessity of strict control, varying client demands and risk management are only some of the features of the business environment where modern banks conduct their operations. In addition, Curko, Bach, and Radonic (Citation2007) emphasised that concerns such as suppression and detection of fraud, risk management, customer management, loss prevention and product management, are some of the primary problems of financial institutions. Likewise, Ghanaian banks are facing a lot of challenges as highlighted in the Ghana Banking Survey (Citation2014). The findings from the survey shows that Ghanaian banks are facing challenges such as: customers’ demand for improved service delivery at reasonable cost, customers’ attrition, competition, legislation and regulations, technology and the performance of the domestic economy. From the survey, 81.8% of the executives surveyed consider competition as a major challenge. In addition, 72.7% see regulations as a challenge, whilst 63.6% are of the view that technological factors will have the greatest influence on the future of banking in Ghana. Thus, banks strive to adopt diverse forms of BI tools to curtail the challenges they face. Some of the areas BI covers in the bank include: “Customer Relationship Management (CRM), Performance Management (PM), Risk Management (RM), Asset and Liability Management (ALM), and Compliance”. Online analytical processing (OLAP) and data warehouse are used for the informational basis for the application of BI in the banks, whilst data mining and knowledge retrieval handle “complex statistical analysis discovering hidden relationships between data and forecasting the behaviour trends of business systems” (Ubiparipović & Đurković, Citation2011).
BI systems are systems that comprises “a broad category of technologies, applications, and processes which are used for gathering, storing, accessing, and analysing data into actionable information to help business users take informed decisions in order to improve business performance” (Azvine, Cui, & Nauck, Citation2005, p. 215; Watson, Citation2009). BI systems are reported widely in the literature as providing a lot of benefits to organisations. Thompson (Citation2004) lists the following benefits BI bring to companies from a survey results: “(1) faster and more accurate reporting (81%); (2) an improved decision-making process (78%); (3) improved customer satisfaction (56%); (4) increased revenues (49%); (5) savings in IT (40%); and (6) savings in other areas (in addition to information technology) (50%)”. Likewise, Ritacco and Carver (Citation2007), for instance, divided BI benefits into four groups: (1) lowering costs through improved operational efficiency, eliminating report backlog and delays, negotiating better contracts with suppliers and customers, finding root causes of problems and taking action and identifying wasted resources and reducing inventory costs; (2) increasing revenue through selling of information to customers, partners and suppliers, improving strategies with better marketing analysis and empowering your sales force; (3) improving customer satisfaction through giving users the means to make better decisions, providing quick answers to user questions and challenging assumptions with factual information; and (4) improving communication within the company. In addition, Moss and Atre (Citation2003, p. 39) categorised the benefits of BI as: “(1) an increase in revenue; (2) an increase in profit; (3) improved customer satisfaction; (4) a reduction of costs; and (5) an increase in market share”. It has also been declared that these benefits are giving the organisations competitive advantage (Davenport, Citation2006; Matei, Citation2010; Negash, Citation2004). However, a dearth of studies exists in the literature when it comes to empirical evidence to ascertain some of these claims of BI systems benefits. Are the organisations that have implemented BI systems really benefitting from these reported benefits? Is it true that BI systems can improve organisational performance?
Consequently, this study was motivated by the fact that there are limited empirical evidence in the information systems (IS) literature when it comes to BI systems impact on organisational performance as many of the studies focused on BI applications development, and others on its adoption (Aruldoss, Lakshmi, & Venkatesan, Citation2014). In the context of developing countries, especially sub-Saharan Africa (SSA), specifically Ghana, BI systems is still in its early stages. Many organisations are still relying on their transaction processing systems (TPS), e.g. enterprise resource planning (ERP), and other legacy database applications without much analytics. However, research has established the existence of Ghanaian banks using BI systems (Owusu, Agbemabiese, Abdurrahaman, & Soladoye, Citation2017). Therefore, this study aims to assess the impact of BI systems adoption on the banks performance through the balanced scorecard (BSC) approach (Kaplan & Norton, Citation1992). Determining such a fact empirically will help contribute to enrich the IS literature, especially from a developing country perspective, where such a study has not been done before. The empirical evidence resulting from this study can also help in the diffusion of BI systems in Ghanaian organisations as vendors could capitalise on the findings to promote their products.
The choice of the BSC was as a result of its comprehensive approach with the financial and non-financial dimensions when it comes to the evaluation of the impact of IT on organisational performance and has been used to measure the effects of the introduction of a new IS or IT on organisational performance (Park & Rim, Citation2011; Wu & Chen, Citation2014).
The rest of the paper is organised as follows: the next section introduces readers to the literature review and related studies. The description of the research model and the formulation of the hypotheses follow. The methodology adopted together with the sampling method, and data analysis performed are discussed in the next section. This is followed by the discussion of the findings and the conclusion of the study with implications and suggestions for future studies.
2. Literature review
The belief that information technology (IT)/IS has a positive impact on organisational performance (Osei-Bryson & Ko, Citation2004) has been a long standing debate in the IS literature and has received considerable attention from both academics and practioners (Davern & Kauffman, Citation2000; Irani & Love, Citation2000; Remenyi, Money, & Sherwood-Smith, Citation2000). In fact, there have been several controversies surrounding performance effects of IT investments in spite of some encouraging evidence from some payoffs from IT (Brynjolfsson, Citation1993; Brynjolfsson & Hitt, Citation1993, Citation1996; Hitt & Brynjolfsson, Citation1996). Whilst researchers (Brynjolfsson & Hitt, Citation1996; Kohli & Devaraj, Citation2003; Stratopoulos & Dehning, Citation2000) got a positive response from IT impact on organisational performance, others (Brynjolfsson, Citation1993; Strassmann, Citation1990; Weill, Citation1992) had results ranging from non-significant, to even a negative relationship.
However, most of these studies focused on the financial measures in which the investments in the IT do not necessarily commensurate with the financial returns. Existing literature on IT/IS business value for organisational performance have shown that the studies were limited to only financial measures, such as the return on investment (ROI), net present value (NPV) and the return on assets (ROA) (Hunton, Lippincott, & Reck, Citation2003; Martinsons, Davison, & Tse, Citation1999; Nicolaou, Citation2004; Poston & Grabski, Citation2001). But, Hou (Citation2015) argued that these financial measures which were applicable to some early TPSs, cannot be used on some recent novel systems such as BI which offers a lot of intangible benefits including improved decision-making process and increased user effectiveness. This therefore calls for a comprehensive approach for measuring the impact of IT/IS on organisational performance.
2.1. Underpinning theory—the balanced scorecard (BSC)
Kaplan and Norton (Citation2001) argued that financial measures alone cannot be used to evaluate the impact of IT/IS on organisational performance. Other non-financial measures too are equally important. This led to them developing the BSC, which includes the other nonfinancial measures, i.e. customer, internal business process and learning and growth dimensions to supplement the finance measure (Kaplan & Norton, Citation1992). There are several other comprehensive models that are used to evaluate the impact of IT/IS on organisational performance. These include the European Foundation for Quality Management (EFQM) Excellence Model, the Baldrige Criteria for Performance Excellence Model, Capability Maturity Models (CMM), the Performance Pyramid Matrices, the Effective Progress and Performance Measurement (EP2 M). Yet, several studies recently have indicated that the BSC approach can be used to evaluate most IT innovations (such as ERP, RFID, BI Systems, SaaS) adoption impact on organisational performance (Hou, Citation2015; Lee, Park, & Lim, Citation2013; Lin, Hsu, & Ting, Citation2006; Park & Rim, Citation2011; Wu & Chen, Citation2014). Therefore, the BSC was found to be appropriate in evaluating the impact of BI systems on Ghanaian bank’s organisational performance and hence its use.
2.2. Related studies about the use of the BSC for measuring organisational performance
Due to the popularity of the BSC, a lot of studies have used it to evaluate the impact of various IT innovations on organisational performance in diverse industries. Examples of some of these studies are highlighted below:
Lee et al. (Citation2013) in their study seek to evaluate software-as-a-service (SaaS) using the BSC in Korean SMEs. They found out that “Learning and Growth, Internal Business Processes, and Customer performance are causally related to Financial performance”. Their results also show that “these four key elements for SaaS success are interrelated, supporting the core premise of the BSC”.
In addition, Wu and Chen (Citation2014) in their study entitled “A stage-based diffusion of IT innovation and the BSC performance impact from Taiwan firms” found that “IT value is realised differentially in different forms of performance indicators across different diffusion stages”. It was revealed that “significant differences exist between the final stage (assimilation) and the two earlier stages (adoption and implementation)”. Their results also indicated that the “four performance perspectives are well realised at the assimilation stage and concluded that time-lag effect and measurement method are the major determinants impacting IT-enabled performance measures”.
Again, Park and Rim (Citation2011) in their study of “The Relationship Analysis of RFID Adoption and Organisational Performance” from Korean firms found out that the “causal relationships between the adoption of RFID and organisational performance showed that learning and growth, internal process and customer performance were strongly affected by the adoption of RFID”. However, their results indicated that the adoption of RFID does not appear to influence the financial performance of a company.
Furthermore, Fang and Lin (Citation2006) in their study of “Measuring the Performance of ERP System – from the Balanced Scorecard Perspectives” from Taiwan Public companies with ERP implementation found out that the innovation and learning, internal, customer and the finance perspectives were all strongly affected by the objectives for implementing the ERP. Their findings further revealed that the BSC’s financial perspective have closed relationship with the non-financial perspectives (i.e. customer, internal and innovation and learning).
2.3. Organisational performance
Organisational performance, according to Gavrea, Ilies, and Stegerean (Citation2011), has been identified as one of the most important variables in management research, yet it has been defined differently over the years due to its many meanings. Whilst Georgopoulos and Tannenbaum (Citation1957, p. 535) in the 1950s defined organisational performance “as the extent to which organisations, viewed as a social system fulfilled their objectives” and evaluated performance based on work, people and organisational structure, it was defined in the late 60s and 70s as “an organisation’s ability to exploit its environment for accessing and using the limited resources” (Seashore & Yuchtman, Citation1967, p. 379). In the 80s and 90s, performance was seen as an organisation accomplishing its goals (effectiveness) using a minimum of resources (efficiency). This led to profit becoming one of the many indicators of performance (Campbell, Citation1977; Gavrea et al., Citation2011; Lusthaus & Adrien, Citation1998). However, Lebas and Euske (Citation2006, p. 71) has recently outlined a set of definitions to explain the concept of organisational performance. The main definition includes performance measured as “a set of financial and nonfinancial indicators which offer information on the degree of achievement of objectives and results”.
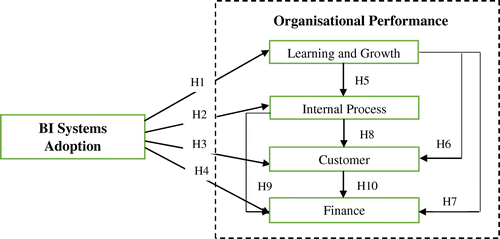
Thus the four dimensions of the BSC, i.e. internal business process, learning and growth, customer and finance represents organisational performance in this study, which “refers to the benefits accrued to a Bank as a result of the post-implementation effects of their BI Systems Adoption” and usage (Figure ).
Figure 1. Research model.
2.4. Development of research hypotheses
2.4.1. Link between BI systems adoption and organisational performance
The independent variable of this study is BI systems adoption. Adoption is defined as the “acceptance and the continued use” of an innovation (Robertson, Citation1971, p.56). In addition, Rogers (Citation1962, p. 17) sees adoption as “a decision to continue full-scale use of an innovation”. Therefore, BI systems adoption, in this study, refers to the bank’s adoption, implementation and use of BI systems in their operations based on Rogers definition. Numerous previous studies grounded on innovation adoption theories such as diffusion of innovation (DOI), technology–organisation–environment (TOE) framework, technology acceptance model, theory of planned behavior, unified theory of acceptance and technology (UTAT) have all used “adoption” as the dependent variable (Oliveira & Martins, Citation2011; Puklavec, Oliveira, & Popovic, Citation2014). Nevertheless, few other studies have also used it as a mediating variable leading to evaluation of the post-adoption effects of IT/IS innovations (Park & Rim, Citation2011; Ramamurthy, Sen, & Sinha, Citation2008). A thorough scan of the IS literature shows lack of empirical studies when it comes to the evaluation of the impact of BI systems on the firm performance. Some few examples found are: Hou (Citation2015) evaluated the impact of BI systems usage on the organisational performance of Taiwan’s semiconductor industry through the BSC and found out that “higher levels of BI system usage will lead to improved financial performance indirectly through enhanced internal process, learning and growth and customer performance (non-financial performance)”. His results also provide initial evidence that the adoption of BI systems leads to increased financial performance. Similarly, Elbashir, Collier, and Davern (Citation2008) investigated the benefits organisations achieved in using BI systems by “measuring the relationship between business process and organisational performance”. Their findings indicated that BI systems can improve the internal business processes of a firm which in turn can lead to enhanced organisational performance. Thompson (Citation2004) declared that BI systems can improved customer satisfaction, increased revenue and enhanced the business processes of a firm through faster and more accurate reporting. Similarly, Ritacco and Carver (Citation2007) and Moss and Atre (Citation2003) claimed that BI systems can lower cost, increase revenue, improve customer satisfaction and increase market share. Based on these discussions, it is assumed that the adoption and continue usage of BI systems for the day-to-day operations of Ghanaian banks will lead to their non-financial and financial performances. This study therefore evaluates the relationship between BI systems adoption and organisational performance of Ghanaian banks using the four dimensions of the BSC. The researcher therefore hypothesised that:
H1: BI Systems Adoption has a positive effect on Organisational Performance in terms of employees Learning and Growth.
H2: BI Systems Adoption has a positive effect on Organisational Performance in terms of improving Internal Process of the banks.
H3: BI Systems Adoption has a positive effect on Organisational Performance in terms of enhancing the banks’ Customer management.
H4: BI Systems Adoption has a positive effect on Organisational Performance in terms of improving Financial gains of the banks.
2.4.2. Dependent variable (DV)
The dependent variable (DV) of this study is organisational performance. The DV used the four dimensions of the BSC as follows:
| (1) | Learning and Growth: this seeks to answer the key question: how can our company continue to improve and create value? (Kaplan & Norton, Citation1992). Kaplan and Norton (Citation1992) continued further to say that organisations must “monitor their ability to launch new products, create more value for customers, and improve operating efficiencies” which are used to evaluate learning and growth perspective. This can be done by organisations strategising through prioritising on the key issues to create an environment that supports organisational change, innovation and growth to achieve their vision (Kaplan & Norton, Citation2001). Through the use of BI systems, banks can launch new products and create more value for customers (Hocevar & Jaklic, Citation2010). Howson (Citation2007) stated that BI can assist a firm to discover new opportunities and also help in reengineering their operational activities. Again, according to Kaplan and Norton (Citation2004), the learning and growth perspective “describes how the people, technology, and organisation climate combine to support their strategy”. They continued further to explain that “improvements in learning and growth measures are lead indicators for internal process, customer, and financial performance”. Based on the above discussion, the researcher therefore hypothesised that: H5: Learning and Growth performance attributed to BI Systems usage will have a positive significant effect on Internal Process Performance. H6: Learning and Growth performance attributed to BI Systems usage will have a positive significant effect on Customer Performance. H7: Learning and Growth performance attributed to BI Systems usage will have a positive significant effect on Finance Performance. | ||||
| (2) | Internal Business Process: this seeks to answer the key question: what must our company excel at? (Kaplan & Norton, Citation1992). Kaplan and Norton (Citation1992) continued further to say that organisations must “determine the processes and competencies that are most critical, and specify measures, such as cycle time, quality, employee skills, and productivity, to track them” which are used to measure the internal business process. This is done by the “strategic priorities for various business processes that create customer and shareholder satisfaction” (Kaplan & Norton, Citation2001). Kaplan and Norton (Citation2004) further argued that internal processes create and provide the value proposition for customers and concluded that “the performance of internal processes is a leading indicator of subsequent improvements in customer and financial outcomes”. Curko et al. (Citation2007) stated that the success of banking operations is strongly linked with the quality of customer relations and effectiveness of banks processes. BI systems usage is expected to significantly improve the internal process of the banks businesses. Based on the above discussions, it is hypothesised that: H8: Internal Business Process performance attributed to BI Systems usage will have a positive significant effect on Customer Performance. H9: Internal Business Process performance attributed to BI Systems usage will have a positive significant effect on Finance Performance. | ||||
| (3) | Customer: this seeks to answer the key question: how do customers see our company? (Kaplan & Norton, Citation1992). Kaplan and Norton (Citation1992) continued further to explain that customers concerns fall into four main categories which are “lead times, quality, performance and service, and cost” which are used to measure the customer perspective and which organisations must strive to adhere to in order to retain existing customers as well as attracting new ones. They explained further that “Lead time measures the time required for the company to meet its customers’ needs. Quality measures the defect level of incoming products as perceived and measured by the customer”. In addition, “the combination of performance and service measures how the company’s products or services contribute to creating value for its customers” (Kaplan & Norton, Citation1992). Again, Kaplan and Norton (Citation2001) further argued that “the core of any business strategy is the customer-value proposition, which describes the unique mix of product, price, service, relationship, and image that a company offers”. It also defines “how the organisation differentiates itself from competitors to attract, retain, and deepen relationships with targeted customers”. Again, the value proposition is crucial as “it helps an organisation connect its internal processes to improved outcomes with its customers”. It is assumed that once there is an improvement in the internal processes of the banks as a result of BI systems usage, customer concerns can be addressed swiftly and thereby leading to customer satisfaction. In addition, Kaplan and Norton (Citation2004) explained that “success with targeted customers provide a principal component for improved financial performance”. Based on the above discussion, it is hypothesised that: H10: Customer performance attributed to BI Systems usage will have a positive significant effect on Finance performance | ||||
| (4) | Finance: this seeks to answer the key question: how has our company done by its shareholders? (Kaplan & Norton, Citation1992). Kaplan and Norton (Citation1992) continued further to explain that organisations must “measure cash flow, quarterly sales growth, operating income by division, and increased market share by segment and return on equity” which are used to measure the finance perspective. This is done by organisations strategising for “growth, profitability, and risk viewed from the perspective of the shareholder” and further explained that companies increase economic value through revenue growth and productivity (Kaplan & Norton, Citation2001). Furthermore, Kaplan and Norton (Citation2004) asserted that financial performance although a lag indicator, provides the ultimate definition of an organisation’s success. In measuring the benefits of BI systems, Hocevar and Jaklic (Citation2010) indicated that many of the effects resulting from BI usage are assumed to be mainly consisting of non-financial and even intangible benefits. In the long run, it has been established that “although such non-financial effects should lead to financial outcomes (e.g. cost savings)”, yet “there may be a time lag between the acquisition of information from BI and the related financial gain” (Hocevar & Jaklic, Citation2010). In addition, Kaplan and Norton (Citation2004) emphasised that the four dimensions of the BSC are interrelated. The learning and growth dimension is always a lead indicator of the other dimensions, i.e. internal business process, customer and finance. Similarly, the internal business process is a lead indicator of customer and finance. Likewise, the customer dimension is a lead indicator of the finance dimension. In other words, Kaplan and Norton (Citation2004) noted that the use of the system can improve the Learning and Growth of the organisation’s employees. Once that is improved, then the internal business process can be enhanced significantly. This then can lead to customers becoming satisfied with the organisation in terms of their quality service delivery which eventually can translate to the sales of more shares and other products of the organisations. This can then lead to the financial gains of the organisation. On the basis of the above discussions, the researcher therefore hypothesised that: H11a: There is an indirect and positive significant relationship between BI system adoption and financial performance through the mediating effect of internal process performance, customer performance, and learning and growth. H11b: There is an indirect and positive significant relationship between BI system adoption and customer performance through the mediating effect of learning and growth performance and internal process performance. H11c: There is an indirect and positive significant relationship between BI system adoption and internal process performance through the mediating effect of learning and growth performance. H11d: There is an indirect and positive significant relationship between Internal Process performance and finance performance through the mediating effect of customer performances. H11e: There is an indirect and positive significant relationship between learning and growth performance and customer performance through the mediating effect of internal process performance. H11f: There is an indirect and positive significant relationship between learning and growth performance and finance performance through the mediating effect of internal process and customer performances. | ||||
3. Research methodology
This study adopted the quantitative approach through a survey method. In practice, due to the intangibility of the many benefits of BI, its measurement can be extremely difficult (Lonnqvist & Pirttimaki, Citation2006). Thus, in this study, the evaluation was done through the “subjective perception-based measures” at the organisational level. The use of the executives “perceptions was considered appropriate because most of the data required to measure” the Organisational Performance are “intangible or qualitative in nature and would be difficult, if not impossible, to collect objectively”. The “perception-based measurement provides opportunities for insights into these intangible quality-related business processes benefits” (Elbashir et al., Citation2008). Elbashir et al. (Citation2008) further declared that “perceptual measures have been widely used in almost all the behaviourally oriented business and management disciplines” whereby “senior executives’ and middle managers’ perceptions are found to be a good proxy for organisational performance impact of IT” (Zhuang & Lederer, Citation2003). Previous studies have reported about high convergence and/or relationship between “objective performance measures and perceptual data collected from senior executives and lower level managers” (Elbashir et al., Citation2008; Ray, Muhanna, & Barney, Citation2005) and hence its used in this study.
A questionnaire was designed for the constructs based on existing literature and modified to suit the context of the current study. Each of the constructs ,i.e. BI systems adoption, internal business process, learning and growth, customer and finance has five items adapted from these studies (Brynjolfsson & Hitt, Citation1996; Elbashir et al., Citation2008; Fang & Lin, Citation2006; Ifinedo, Citation2011; Oliveira, Thomas, & Espadanal, Citation2014; Park & Rim, Citation2011; Stratopoulos & Dehning, Citation2000; Thiesse, Staake, Schmitt, & Fleisch, Citation2011). The questionnaire was divided into two parts. Part A consists of respondents profiles, whilst Part B is made up of the construct’s and all the items used to measure them. The items were measured on a seven-point Likert Scale with end points “1 = Strongly Disagree” and “7 = Strongly Agree”. A sample questionnaire is attached in Appendix 1. The developed questionnaire was also evaluated for its validity and reliability. Content validity was done through expert review, where three academics checked for the wording and made various suggestions which were incorporated to enhance the questions. Reliability was done with a pilot study of 30 respondents where both the Cronbach alpha and composite reliability values for all the constructs and their indicators meet the acceptable threshold value of 0.7 and above (Nunnally, Citation1978). This is shown in Table .
Table 1. Reliability of constructs
Data collection was done through self-administered questionnaire with non-proportionate stratified and purposive sampling techniques from Chief Information Technology officers/IT/IS managers and their deputies as well as business analyst from the commercial Banks. The researcher distributed 240 questionnaires to the target respondents. After several follows up, 142 questionnaires were returned representing 58.3%. However, after a thorough check of the filled questions, 130 of them were found to be valid representing 52.4%, which were used for the final data analysis.
4. Data analysis
This study used SPSS 21 for the descriptive statistics of the respondent’s profiles. Inferential statistics was done through PLS-SEM approach using SmartPLS 3.2.6 (Ringle, Wende, & Becker, Citation2015). The choice of PLS-SEM specifically SmatPLS 3 was informed by its ability to handle small sample size as well as non-normally distributed data (Hair, Hult, Ringle, & Sarstedt, Citation2014, p. 19). A normality test through the traditional approaches of Kolmogorov–Smirnov and Shapiro–Wilks tests conducted on the collected data for this study revealed that the data are not normally distributed. This is shown in Table . Thus, the use of PLS-SEM approach was justified with the small sample size of 130 respondents and non-normal data distribution.
Table 2. Normality test
Normality test through both Kolmogorov–Smirnov and Shapiro–Wilk test result from Table above revealed that all the constructs are significant at p < 0.05. For a normally distributed data, both test should have p > 0.05 (Dallal & Wilkinson, Citation1986; Royston, Citation1982; Shapiro & Wilk, Citation1965). Thus, the data is not normally distributed hence the choice of PLS-SEM is appropriate.
4.1. Profile of respondents
From Table , the Descriptive statistics show that MIS Managers with 39 (30%) forms the majority of the respondents job category and business analyst with 31 respondents (23.8%) follows. This indicates a greater percentage of the target respondents were represented. Furthermore, 32 respondents (24.6%) indicated that their banks adopted BI systems within 1–2 years; 57 respondents (43.8%) indicated that their banks adopted BI systems within 3–5 years; 31 respondents (23.8%) indicated their banks adopted BI systems within 6–10 years; and 10 respondents (7.7%) indicated their banks adopted BI systems over 10 years ago. The results show that majority of the banks are still in their infancy stages of adopting BI systems since majority are under 10 years of adoption although none of the banks fall under the less than 1 year category. This is a good sign that Ghanaian banks are fully aware of BI systems and are using them for their operations.
Table 3. Descriptive statistics for the respondents—Frequencies and percentages of respondents Job Category and Time since a bank adopted BI System
4.2. Assessment of the measurement model
The inferential statistics were done in two stages as required by SmartPLS 3.2.6 (Ringle et al., Citation2015). First, the assessment of the measurement model was done where the data were subjected to confirmatory factor analysis (CFA) to verify their reliability and validity.
Table illustrates the results of the assessment of the measurement model. All the constructs’ indicators outer loadings are above the threshold value of 0.708. The constructs’ reliability was assessed through both the Cronbach alpha and composite reliability methods. Both methods indicate that the constructs are reliable because they meet the acceptable threshold of 0.7 and above (Hair et al., Citation2014, p. 107; Nunnally, Citation1978). In addition, the convergent validity of the constructs were evaluated through the average variance extracted (AVE) criterion. All the constructs met the 0.5 and above threshold in line with the (Bagozzi & Yi, Citation1989; Fornell & Larcker, Citation1981) guidelines.
Table 4. Construct validity and reliability
Table shows the discriminant validity of the constructs. The Fornell–Larcker criterion was used for evaluating the discriminant validity. According to Hair et al. (Citation2014, p. 105), the Fornell–Larcker method “compares the square root of the AVE values with the latent variable correlations” where “the square root of each construct’s AVE should be greater than its highest correlation with any other construct”. Thus, from Table , all the square root of each construct’s AVE is greater than their highest correlation with other constructs indicating discriminant validity has been established in line with the Fornell–Larcker criterion (Fornell & Larcker, Citation1981).
Table 5. Discriminant validity—Fornell–Larcker criterion
4.3. Assessment of the structural model
The next stage after establishing the validity and reliability of the measurement model is the evaluation of the structural model.
Hypotheses’ testing was done through the bootstrapping method. The t value generated by SmartPLS 3.2.6 (Ringle et al., Citation2015) provides the statistical significance of the causal path relationship between the constructs in the hypothesised model. In PLS-SEM, the “popular critical t values for a two-tailed test are 1.65 (α = 0.10), 1.96 (α = 0.05), or 2.57 (α = 0.01)” (Hair et al., Citation2014, p. 134).
Figure and Table show the results of the bootstrapping method for the structural model signifying the t-values causal relationships between the constructs. At 5% significance interval (t-value>=1.96), BISysAdopt → IntPro (t = 3.370); BISysAdopt → LearnGrow (t = 10.143); Cust → Fin (t = 5.806); IntPro → Cust (t = 2.017); IntPro → Fin (t = 2.901); LearnGrow → Cust (t = 3.594); LearnGrow → IntPro (t = 11.983) were found to have significant relationships. Also, at 10% (t-value ≥ 1.65) significance interval, BISysAdopt → Cust (t = 1.835) emerged significant. However, BISysAdopt → Fin (t = 0.566) and LearnGrow → Fin (t = 1.486) were found to be insignificant.
Figure 2. Bootstrapping results (direct effects).
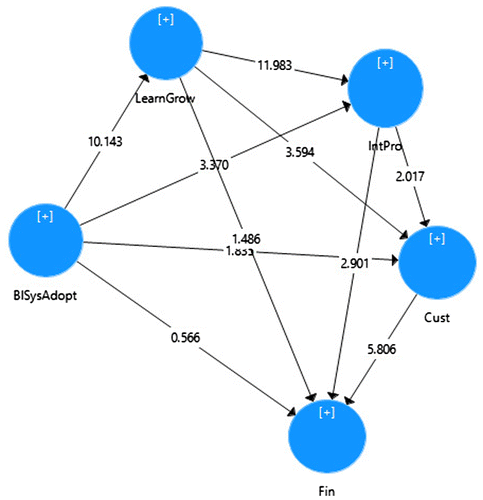
Table 6. Bootstrapping results (direct effects)
Therefore, the hypothesised relationships between BI systems adoption and learning and growth, internal business process and customer are supported. In addition, the hypothesised relationships between learning and growth and internal business process and customer are also supported. Again, the hypothesised relationships between internal business process and customer and finance are also supported. Furthermore, the hypothesised relationship between customer and finance are also supported. However, the hypothesised relationship between BI systems adoption and finance as well as learning and growth and finance are not supported.
4.4. Mediation effects
Garson (Citation2016, p. 60) noted that indirect effects are effects of one latent construct on an endogenous latent variable mediated through one or more additional latent variables. According to Preacher and Hayes (Citation2008), mediation occurs “when a predictor affects a dependent variable indirectly through at least one intervening variable, or mediator”. Baron and Kenny (Citation1986) explained that generally, a given variable could be said to be functioning as a mediator to the degree that it accounts for the relation between the predictor and the criterion. Several methods are used to assess the mediation effect (MacKinnon, Lockwood, Hoffman, West, & Sheets, Citation2002). These include the causal steps strategy (Baron & Kenny, Citation1986), Sobel test (Sobel Citation1982, Citation1986); the distribution of the product approach (MacKinnon, Lockwood, & Williams, Citation2004; MacKinnon et al., Citation2002); and the bootstrapping method. This study adopted the bootstrapping approach to test the mediation effect as many researchers have advocated for its use, especially with PLS-SEM (Hair et al., Citation2014, p. 223; Hayes, Citation2009; Preacher & Hayes, Citation2004, Citation2008; Ramayah, Citation2015).
The researcher used the bias-corrected bootstrap confidence interval option with 5000 subsamples from the SmartPLS 3.2.6 (Ringle et al., Citation2015) algorithm as recommended by (Hayes & Scharkow, Citation2013) as the most trustworthy test when power is of utmost concern.
Table shows the results from the indirect effects from the structural model via the bootstrapping technique. Here, it can be observed that exogenous latent variable BI systems Adoption indirect effects on endogenous constructs customer, finance and internal process are all significant with values (t = 5.135), (t = 9.695), and (t = 7.798), respectively. In addition, endogenous latent variable internal process indirect effect on endogenous construct Finance is significant with value (t = 1.781); endogenous latent variable learning and growth indirect effect on endogenous construct customer is significant with value (t = 1.932); and endogenous latent variable learning and growth indirect effect on endogenous construct finance is significant with value (t = 6.416).
Table 7. Bootstrapping (indirect effects)—hypotheses’ testing for mediation
Furthermore, from Table , mediation effects are confirmed as hypothesised between the BI systems adoption and customer through the indirect effects of learning and growth and internal process in line with the guidelines recommended by (Preacher & Hayes, Citation2008) as there is no zero between the LL (5%) Confidence Interval (CI) (0.293) and the UL (95%) CI (0.561). Similarly, mediation is detected between BI systems adoption and finance through the indirect effects of learning and growth, internal process and customer as there is no zero between the LL (5%) Confidence Interval (CI) (0.486) and the UL (95%) CI (0.686). Again, mediation is detected between BI systems adoption and internal process through the indirect effects of learning and growth as there is no zero between the LL (5%) Confidence Interval (CI) (0.320) and the UL (95%) CI (0.493). Others are mediation effects are detected between internal process and finance through the indirect effects of customer as there is no zero between the LL (5%) CI (0.023) and the UL (95%) CI (0.267). In addition, mediation effects are detected between learning and growth and customer, through the indirect effects of internal process as there is no zero between the LL (5%) CI (0.031) and the UL (95%) CI (0.335). Lastly, mediation effects are detected between learning and growth and finance, through the indirect effects of internal process and customer as there is no zero between the LL (5%) CI (0.412) and the UL (95%) CI (0.690).
Table 8. Bootstrapping (indirect effects) – Confidence interval bias corrected
Therefore, as hypothesised, the indirect effects of BI systems adoption on finance, BI systems adoption on customer and BI systems adoption on internal process are all supported. In addition, the indirect effects of learning and growth on finance, learning and growth and customer as well as internal business process and finance are all supported.
Thus, this implies that the adoption of BI systems does not directly leads to organisational performance in terms of financial gains. Nevertheless, through the mediation effects of learning and growth, internal process and customer, the finance performance can be achieved. Also, customer performances are also achieved through the indirect effects of learning and growth and internal process performances. This confirms the core premise of the original BSC that all the components are interrelated (Hou, Citation2015; Kaplan & Norton, Citation2004; Lee et al., Citation2013).
4.5. Coefficient of determination—R2
The coefficient of determination, denoted as R2 value, in PLS-SEM measures the models predictive accuracy. It is calculated as “the squared correlation between a specific endogenous construct’s actual and predicted value”. The R2 is the representation of all the exogenous latent variables’ collective effects on the endogenous construct. It is also the amount of the variance in the endogenous constructs which is explained by all of the exogenous constructs linked to it (Hair et al., Citation2014, pp. 174–175). As a rule of thumb, the R2 have values ranging from 0 to 1. Values of 0.75, 0.50 or 0.25 for endogenous latent variables have been specified as substantial, moderate or weak , respectively (Hair, Ringle, & Sarstedt, Citation2011; Hair et al., Citation2014, p. 175; Henseler, Ringle, & Sinkovics, Citation2009).
From Table , the R2 values of 0.601, 0.680, 0.718 and 0.343 indicates that the exogenous latent variable BI systems adoption explain 34.3% of the variance of the endogenous construct learning and growth. Similarly, the combined effects of BI systems adoption, and learning and growth constructs on endogenous construct internal business process is 71.8%. Likewise, the combined effects of BI systems adoption, learning and growth and internal business process constructs on endogenous construct Customer is 60.1%. Again, the combined effects of BI systems adoption, learning and growth, internal business process and customer constructs on endogenous construct finance is 68.0%.
Table 9. R2, R2 adjusted f2 and Q2 values
Thus, the strongest effect in this structural model occurs with BI systems adoption and learning and growth constructs on endogenous construct internal business process. Therefore, as theorised, the adoption of BI system improves the learning and growth of the firm’s employees which eventually leads to the enhancement of the internal business processes of the organisation. Once the internal business processes are improved, the likelihood that customer satisfaction will be achieved is higher which shows 60.1% of the variance explained. Eventually, all the exogenous latent variables explained 68.0% of the variance of the finance construct.
4.6. Effect sizes
The effect size, denoted as f2, is used to measure an exogenous latent variable’s influence to an endogenous construct R2 value. The f2 value is used by researchers to assess the importance of individual latent variable’s contribution in explaining the variance of the endogenous constructs. As a rule of thumb, f2 values of “0.02, 0.15 and 0.35 indicate an exogenous construct’s small, medium or large effect, respectively, on an endogenous construct” (Hair et al., Citation2014, p. 186). From Table , with an f2 value of 0.523, it emerged that BI systems adoption have the highest effect size on learning and growth construct. Also, with an f2 value of 0.100 and 0.093, respectively, BI systems adoption have medium effect size on internal business process and customer constructs. However, it emerged that BI systems adoption have an insignificant effect size on the endogenous construct finance with an f2 value of 0.006.
4.7. Predictive relevance
The model’s predictive relevance was assessed through the Stone–Geisser’s Q2 value (Geisser, Citation1974; Stone, Citation1974) was evaluated. This study followed the blindfolding procedure “via the cross-validated redundancy approach as recommended by (Hair et al., Citation2014, p. 183), to calculate the Q2 value”. From Table , the Q2 value of 0.488, 0.531, 0.563 and 0.239 indicate the structural path model has predictive relevance.
5. Discussions
A structural model was developed for this study through the lens of the BSC which was used to empirically assess the post-adoption impact of BI systems adoption on the organisational performance of Ghanaian banks using PLS-SEM approach.
The findings from the analysis indicated that BI systems adoption positively impacted Ghanaian banks organisational performances in terms of their learning and growth, internal business process and customer. However, BI systems adoption does not have a direct significant effect on the banks finance performance. Nevertheless, there is a significant relationship between BI systems adoption and finance performance through the mediation effects of learning and growth, internal process and customer. These findings are discussed below.
As hypothesised, BI systems adoption have a significant relationship with endogenous construct learning and growth. This is an indication that once BI systems are continuously used in the organisation, it helps the employees to monitor their ability to launch new products, create more value for customers and improve operating efficiencies (Kaplan & Norton, Citation1992). This is true as the strongest effect of BI systems adoption is on the learning and growth construct (f2 = 0.523). This implies that the banks’ continue usage of BI systems significantly improves their ability to improve their operating efficiencies. Also, as described by Kaplan and Norton (Citation2004), learning and growth has a direct positive significant relationship with internal business process and customer, confirming its lead indication. Thus, learning and growth performance emerging significant with internal business process and customer constructs is in line with other studies (Fang & Lin, Citation2006; Hou, Citation2015; Lee et al., Citation2013; Park & Rim, Citation2011; Wu & Chen, Citation2014).
Both BI systems adoption and learning and growth constructs have a significant positive relationship with endogenous construct internal business process. As noted by Kaplan and Norton (Citation1992), through the improvement in the learning and growth attributed to BI systems usage, the banks are able to determine the processes and competencies which are most critical and specify measures, including cycle time, quality, employee skills and productivity, to track them. These lead to them strategising in priorities for various business processes that create customer and shareholder satisfaction (Kaplan & Norton, Citation2001). Also, internal business process emerged significant with both endogenous constructs customer and finance signifying its lead indicator to these constructs (Kaplan & Norton, Citation2004). Thus, internal business performance emerging significant is in line with other studies (Fang & Lin, Citation2006; Hou, Citation2015; Lee et al., Citation2013; Park & Rim, Citation2011; Wu & Chen, Citation2014).
BI systems adoption, learning and growth and internal business process constructs have a significant positive relationship with endogenous construct customer. Kaplan and Norton (Citation1992) emphasised that customer concerns are categorised into four as “lead times, quality, performance and service, and cost”. With the enhancement in the internal business processes attributed to BI systems usage, the banks are able to meet efficiently most of these primary concerns of their customers. Also, customer emerged significant with the endogenous construct finance, which signifies that once customers are happy, their purchase of the bank’s shares and other products can lead to the financial gains. This also signifies the lead indicator of the customer construct to finance (Kaplan & Norton, Citation2004). Thus, customer performance emerging significant is in line with other studies (Fang & Lin, Citation2006; Hou, Citation2015; Lee et al., Citation2013; Park & Rim, Citation2011; Wu & Chen, Citation2014).
The findings of this study showed that BI systems adoption has no direct significant relationship with the endogenous construct finance. With an effect size f2 value of 0.006, it emerged that BI system adoption does not have a direct effect on finance construct. However, through the mediation effect of learning and growth, internal process and customer constructs, the finance constructs emerged significant with BI systems adoption. Thus, managers should encourage the use of BI systems in all their operations which with time can translate to the financial gains of the organisation (Hou, Citation2015; Lee et al., Citation2013).
6. Conclusion and recommendations
The main objective of this study was to investigate empirically the post-adoption effects of BI systems adoption on the organisational performance of Ghanaian banks. This was done through the BSC. The findings revealed that, indeed, BI systems adoption impacted the organisational performance of Ghanaian banks positively as the four dimensions of the BSC, i.e. learning and growth, internal business process, customer and finance were all found to be significant with BI Systems adoption. BI systems adoption were found to have a direct positive significant relationship with learning and growth, internal business process and customer performances. However, the findings showed that BI systems adoption does not have a direct significant relationship with finance performance but rather through an indirect positive significant relationship with learning and growth, internal business process and customer performances.
6.1. Implications
This study contributes to the body of knowledge with the provision of empirical evidence through a PLS-SEM approach concerning the benefits of BI systems which have been mostly anecdotal. This will help enrich the IS literature most importantly with this empirical evidence which is coming from a developing country where there are dearth of research concerning the phenomenon under investigation.
Practically, this study has shown that the adoption of BI systems can have both financial and non-financial effects on organisational performance. This has provided an insight to managers and policy-makers that in evaluating the effects on an IT/IS such as BI systems, they should take a comprehensive approach and consider both the financial and non-financial aspects due to the intangibility of some of the benefits. In addition, it is recommended that bank managers should also encourage the use of BI systems in all their operations which with time can translate to the financial gains of the organisation. Again, it is highly recommended that the empirical evidence provided through this study should be used by vendors and other policy makers to help create awareness about BI systems in developing countries, especially SSA countries where the phenomenon is not known much.
6.2. Limitations and suggestions for future studies
This study focused on empirically evaluating the post-adoption impact of BI systems adoption on Ghanaian banks organisational performance. The findings of the quantitative analysis can be further validated with a qualitative study to confirm the findings of this empirical evidence in future study.
Additional information
Funding
Notes on contributors
Acheampong Owusu
Acheampong Owusu holds a PhD in Information Systems (with focus on Technological Innovations Diffusion and their impact on Organisations) from Limkokwing University of Creative Technology, Cyberjaya, Malaysia. He has worked at the University of Ghana Business School for the past 12 years as the head of the IT Unit and have also been involved in part-time lecturing in the undergraduate level over the years. His research interests include Business Intelligence Systems and Analytics, Information Systems, Cloud Computing, and Ecommerce.
References
- Aruldoss, M., Lakshmi, M., & Venkatesan, T. V. P. (2014). A survey on recent research in business intelligence. Journal of Enterprise Information Management, 27, 831–866.10.1108/JEIM-06-2013-0029
- Azvine, B., Cui, Z., & Nauck, D. D. (2005). Towards real-time business intelligence. BT Technology Journal, 23, 214–225.10.1007/s10550-005-0043-0
- Bagozzi, R. P., & Yi, Y. (1989). On the use of structural equation models in experimental designs. Journal of Marketing Research, 26, 271–284.10.2307/3172900
- Baron, R. M., & Kenny, D. A. (1986). The moderator–mediator variable distinction in social psychological research: Conceptual, strategic, and statistical considerations. Journal of Personality and Social Psychology, 51, 1173–1182.10.1037/0022-3514.51.6.1173
- Brynjolfsson, E. (1993). The productivity paradox of information technology. Communications of the ACM, 36, 66–77.10.1145/163298.163309
- Brynjolfsson, E., & Hitt, L. (1993). Is information systems spending productive? New evidence and new results (pp. 47–64). Cambridge, MA: MIT Sloan School of Management.
- Brynjolfsson, E., & Hitt, L. (1996). Paradox lost? Firm-level evidence on the returns to information systems spending. Management Science, 42, 541–558.10.1287/mnsc.42.4.541
- Campbell, J. P. (1977). On the nature of organizational effectiveness. New perspectives on organizational effectiveness, 13, 55.
- Curko, K., Bach, M. P., & Radonic, G. (2007, June). Business intelligence and business process management in banking operations. In Information Technology Interfaces, 2007. ITI 2007. 29th International Conference on (pp. 57–62). IEEE.10.1109/ITI.2007.4283744
- Dallal, G. E., & Wilkinson, L. (1986). An analytic approximation to the distribution of Lilliefors's test statistic for normality. The American Statistician, 40, 294–296.
- Davenport, T. H. (2006). Competing on analytics. Harvard Business Review, 84, 98–107.
- Davern, M. J., & Kauffman, R. J. (2000). Discovering potential and realizing value from information technology investments. Journal of Management Information Systems, 16, 121–143.10.1080/07421222.2000.11518268
- Dawson, L., & Van Belle, J.-P. (2013). Critical success factors for business intelligence in the South African financial services sector. SA Journal of Information Management, 15(1), 1–12.
- Elbashir, M. Z., Collier, P. A., & Davern, M. J. (2008). Measuring the effects of business intelligence systems: The relationship between business process and organizational performance. International Journal of Accounting Information Systems, 9, 135–153.10.1016/j.accinf.2008.03.001
- Fang, M.-Y., & Lin, F. (2006). Measuring the performance of ERP System—From the balanced scorecard perspectives. Journal of American Academy of Business, 10, 256–263.
- Fedouaki, F., Okar, C., & Alami, S. El. (2013). A maturity model for business intelligence system project in small and medium-sized enterprises: An empirical investigation. International Journal of Computer Science Issues, 10, 61–69.
- Fornell, C., & Larcker, D. F. (1981). Structural equation models with unobservable variables and measurement error: Algebra and statistics. Journal of Marketing Research, 382–388.10.2307/3150980
- Garson, G. D. (2016). Partial least squares: Regression & structural equation modelling. Asheboro, NC: Statistical Associates Publishing.
- Gartner. (2017). Gartner says worldwide business intelligence and analytics market to reach $18.3 billion in 2017. Gartner, Inc. Retrieved March 5, 2017, from https://www.gartner.com/newsroom/id/3612617
- Gavrea, C., Ilies, L., & Stegerean, R. (2011). Determinants of organizational performance: The case of Romania. Management & Marketing, 6, 285–300.
- Geisser, S. (1974). A predictive approach to the random effect model. Biometrika, 61, 101–107.
- Georgopoulos, B. S., & Tannenbaum, A. S. (1957). A study of organizational effectiveness. American Sociological Review, 22, 534–540.10.2307/2089477
- Ghana Banking Survey. (2014). The future of banking in Ghana. What’s next? Pricewater House Coopers. Retrieved March 15, 2015 from https://www.pwc.com/gh/en/assets/pdf/gh-banking-survey-2014.pdf
- Hair, J. F., Hult, G. T. M., Ringle, C. M., & Sarstedt, M. (2014). A primer on partial least squares structural equation modeling (PLS-SEM). Thousand Oaks, CA: Sage.
- Hair, J. F., Ringle, C. M., & Sarstedt, M. (2011). PLS-SEM: Indeed a silver bullet. The Journal of Marketing Theory and Practice, 19, 139–152.10.2753/MTP1069-6679190202
- Hayes, A. F. (2009). Beyond Baron and Kenny: Statistical mediation analysis in the new millennium. Communication Monographs, 76, 408–420.10.1080/03637750903310360
- Hayes, A. F., & Scharkow, M. (2013). The relative trustworthiness of inferential tests of the indirect effect in statistical mediation analysis: Does method really matter? Psychological Science, 24, 1918–1927.10.1177/0956797613480187
- Henseler, J., Ringle, C. M., & Sinkovics, R. R. (2009). The use of partial least squares path modeling in international marketing. In New challenges to international marketing (pp. 277–319). Emerald Group Publishing Limited.
- Hitt, L. M., & Brynjolfsson, E. (1996). Productivity, business profitability, and consumer surplus: Three different measures of information technology value. MIS Quarterly, 121–142.10.2307/249475
- Hocevar, B., & Jaklic, J. (2010). Assessing benefits of business intelligence systems—A case study. Management, 15, 87–119.
- Hou, C. K. (2015). Using the balanced scorecard in assessing the impact of BI system usage on organizational performance: An empirical study of Taiwan’s semiconductor industry. Information Development, 32, 1545–1569.
- Howson, C. (2007). Successful business intelligence. New Delhi: Tata McGraw-Hill Education.
- Hribar Rajterič, I. (2010). Overview of business intelligence maturity models. Management: Journal of Contemporary Management Issues, 15, 47–67.
- Hunton, J. E., Lippincott, B., & Reck, J. L. (2003). Enterprise resource planning systems: Comparing firm performance of adopters and nonadopters. International Journal of Accounting Information Systems, 4, 165–184.10.1016/S1467-0895(03)00008-3
- Ifinedo, P. (2011). An empirical analysis of factors influencing internet/E-business technologies adoption by Smes in Canada. International Journal of Information Technology & Decision Making, 10, 731–766.10.1142/S0219622011004543
- Irani, Z., & Love, P. E. (2000). The propagation of technology management taxonomies for evaluating investments in information systems. Journal of Management Information Systems, 17, 161–177.
- Kaplan, R. S., & Norton, D. P. (1992). The balanced scorecard—Measures that drive performance. Harvard Business Review, 70, 71–79.
- Kaplan, R. S., & Norton, D. P. (2001). Transforming the balanced scorecard from performance measurement to strategic management: Part I, 15, 87–104.
- Kaplan, R. S., & Norton, D. P. (2004). The strategy map: Guide to aligning intangible assets. Strategy & Leadership, 32, 10–17.10.1108/10878570410699825
- Kohli, R., & Devaraj, S. (2003). Measuring information technology payoff: A meta-analysis of structural variables in firm-level empirical research. Information Systems Research, 14, 127–145.10.1287/isre.14.2.127.16019
- Lebas, M. J., & Euske, K. (2006). A conceptual and operational delineation of performance. Business Performance Measurement: Theory and Practice, 65–79.
- Lee, S., Park, S. B., & Lim, G. G. (2013). Using balanced scorecards for the evaluation of “Software-as-a-service”. Information & Management, 50, 553–561.10.1016/j.im.2013.07.006
- Lin, H.-Y., Hsu, P.-Y., & Ting, P.-H. (2006). ERP systems success: An integration of IS success model and balanced scorecard. Practice, 38, 215–228.
- Lonnqvist, A., & Pirttimaki, V. (2006). The measurement of business intelligence. Information Systems Management, 23, 32–40.10.1201/1078.10580530/45769.23.1.20061201/91770.4
- Lusthaus, C., & Adrien, M. H. (1998). Organizational assessment: A review of experience. Universalia Occasional Paper, 31.
- MacKinnon, D. P., Lockwood, C. M., Hoffman, J. M., West, S. G., & Sheets, V. (2002). A comparison of methods to test mediation and other intervening variable effects. Psychological Methods, 7, 83.10.1037/1082-989X.7.1.83
- MacKinnon, D. P., Lockwood, C. M., & Williams, J. (2004). Confidence limits for the indirect effect: Distribution of the product and resampling methods. Multivariate Behavioral Research, 39, 99–128.10.1207/s15327906mbr3901_4
- Martinsons, M., Davison, R., & Tse, D. (1999). The balanced scorecard: A foundation for the strategic management of information systems. Decision Support Systems, 25, 71–88.10.1016/S0167-9236(98)00086-4
- Matei, G. (2010). A collaborative approach of business intelligence systems. Journal of Applied Collaborative Systems, 2, 91–101.
- Moss, L. T., & Atre, S. (2003). Business intelligence roadmap: The complete project lifecycle for decision-support applications. Boston, MA: Addison-Wesley Professional.
- Negash, S. (2004). Business intelligence (BI). Communications of the Association for Information Systems, 13, 177–195.
- Nicolaou, A. I. (2004). Firm performance effects in relation to the implementation and use of enterprise resource planning systems. Journal of Information Systems, 18, 79–105.10.2308/jis.2004.18.2.79
- Nunnally, J. (1978). Psychometric methods. New York, NY: McGraw-Hill.
- Oliveira, T., & Martins, M. (2011). Literature review of information technology adoption models at firm level. The Electronic Journal Information Systems Evaluation, 14, 110–121.
- Oliveira, T., Thomas, M., & Espadanal, M. (2014). Assessing the determinants of cloud computing adoption: An analysis of the manufacturing and services sectors. Information & Management, 51, 497–510.10.1016/j.im.2014.03.006
- Olszak, C. M., & Ziemba, E. (2012). Critical success factors for implementing business intelligence systems in small and medium enterprises on the example of Upper Silesia, Poland. Interdisciplinary Journal of Information, Knowledge & Management, 7, 129–150.
- Osei-Bryson, K. M., & Ko, M. (2004). Exploring the relationship between information technology investments and firm performance using regression splines analysis. Information & Management, 42(1), 1–13.10.1016/j.im.2003.09.002
- Owusu, A., Agbemabiese, G. C., Abdurrahaman, D. T., & Soladoye, B. A. (2017). Determinants of business intelligence systems adoption in developing countries: An empirical analysis from Ghanaian Banks. The Journal of Internet Banking and Commerce, 2017.
- Park, Y.-J., & Rim, M.-H. (2011). The relationship analysis of RFID adoption and organizational performance. In ICSNC 2011, The Sixth International Conference on Systems and Networks Communications, (c) (pp. 76–82).
- Poston, R., & Grabski, S. (2001). Financial impacts of enterprise resource planning implementations. International Journal of Accounting Information Systems, 2, 271–294.10.1016/S1467-0895(01)00024-0
- Preacher, K. J., & Hayes, A. F. (2004). SPSS and SAS procedures for estimating indirect effects in simple mediation models. Behavior Research Methods, Instruments, & Computers, 36, 717–731.10.3758/BF03206553
- Preacher, K. J., & Hayes, A. F. (2008). Asymptotic and resampling strategies for assessing and comparing indirect effects in multiple mediator models. Behavior Research Methods, 40, 879–891.10.3758/BRM.40.3.879
- Puklavec, B., Oliveira, T., & Popovic, A. (2014). Unpacking business intelligence systems adoption determinants: An exploratory study of small and medium enterprises. Economic and Business Review, 16, 185–213.
- Ramamurthy, K., Sen, A., & Sinha, A. (2008). Data warehousing infusion and organizational effectiveness. IEEE Transactions on Systems, Man, and Cybernetics—Part A: Systems and Humans, 38, 976–994.10.1109/TSMCA.2008.923032
- Ramayah, T. (2015). Testing mediation effect PLS 2.0 steps.
- Ray, G., Muhanna, W. A., & Barney, J. B. (2005). Information technology and the performance of the customer service process: A resource-based analysis. MIS Quarterly, 625–652.
- Remenyi, D., Money, A. H., & Sherwood-Smith, M. (2000). The effective measurement and management of IT costs and benefits. Amsterdam: Elsevier.
- Ringle, C. M., Wende, S., & Becker, J.-M. (2015). SmartPLS 3. Boenningstedt: SmartPLS GmbH. Retrieved from https://www.smartpls.com
- Ritacco, M., & Carver, A. (2007). The business value of business intelligence—A framework for measuring the benefits of business intelligence. Business Objects, 1–24.
- Robertson, T. S. (1971). Innovative behavior and communication. New York, NY: Holt, Rinehart and Winston.
- Rogers, E. (1962). Diffusion of innovation. New York, NY: The Free Press.
- Royston, J. P. (1982). Algorithm AS 181: The W test for normality. Journal of the Royal Statistical Society. Series C (Applied Statistics), 31, 176–180.
- Seashore, S. E., & Yuchtman, E. (1967). Factorial analysis of organizational performance. Administrative Science Quarterly, 377–395.10.2307/2391311
- Shapiro, S. S., & Wilk, M. B. (1965). An analysis of variance test for normality (complete samples). Biometrika, 52, 591–611.
- Sobel, M. E. (1982). Asymptotic confidence intervals for indirect effects in structural equation models. Sociological Methodology, 13, 290–312.
- Sobel, M. E. (1986). Some new results on indirect effects and their standard errors in covariance structure models. Sociological Methodology, 16, 159–186.
- Stone, M. (1974). Cross-validation and multinomial prediction. Biometrika, 61, 509–515.
- Strassmann, P. A. (1990). The business value of computers: An executive’s guide. New Canaan, CT: Information Economics Press.
- Stratopoulos, T., & Dehning, B. (2000). Does successful investment in information technology solve the productivity paradox? Information & Management, 38, 103–117.10.1016/S0378-7206(00)00058-6
- Thiesse, F., Staake, T., Schmitt, P., & Fleisch, E. (2011). The rise of the “next-generation bar code”: An international RFID adoption study. Supply Chain Management: An International Journal, 16, 328–345.10.1108/13598541111155848
- Thompson, O. (2004). Business intelligence success, lessons learned. Technology.
- Ubiparipović, B., & Đurković, E. (2011). Application of business intelligence in the banking industry. Management Information System, 6, 23–30.
- Watson, H. J. (2009). Tutorial: Business intelligence-past, present, and future. Communications of the Association for Information Systems, 25, 39.
- Watson, H. J., & Wixom, B. H. (2007). The current state of business intelligence. Computer, 40, 96–99.10.1109/MC.2007.331
- Weill, P. (1992). The relationship between investment in information technology and firm performance: A study of the valve manufacturing sector. Information Systems Research, 3, 307–333.10.1287/isre.3.4.307
- Wu, I. L., & Chen, J. L. (2014). A stage-based diffusion of IT innovation and the BSC performance impact: A moderator of technology-organization-environment. Technological Forecasting and Social Change, 88, 76–90.10.1016/j.techfore.2014.06.015
- Yeoh, W., & Koronios, A. (2010). Critical success factors for business intelligence systems. Journal of Computer Information Systems, 50, 23–32.
- Yeoh, W., Koronios, A., & Gao, J. (2008). Managing the implementation of business intelligence systems. International Journal of Enterprise Information Systems, 4, 79–94.10.4018/IJEIS
- Zhuang, Y., & Lederer, A. L. (2003). An instrument for measuring the business benefits of e-commerce retailing. International Journal of Electronic Commerce, 7, 65–99.
Appendix 1
PART I: Basic Information
1. Job Category:
| a. | ( ) CIO | ||||
| b. | ( ) MIS Manager | ||||
| c. | ( ) IT Director/Manager | ||||
| d. | ( ) Business Analyst | ||||
| e. | ( ) Other(s). Please specify: ___________________________________ | ||||
2. Please indicate the elapsed time since adoption of BI Systems
| a. | ( ) Less than 1 year | ||||
| b. | ( ) 1–2 years | ||||
| c. | ( ) 3–5 years | ||||
| d. | ( ) 6–10 years | ||||
| e. | ( ) Over 10 years | ||||
PART II: Extent of BI systems adoption and its effects on organisational performance
Notes: 1 = Strongly disagree; 2 = Disagree; 3 = Moderately Disagree; 4 = Neither disagree nor agree; 5 = Moderately Agree; 6 = Agree; 7 = Strongly agree