
Abstract
The purpose of this research is to know the most effective factor that has a relationship with the brand equity of Disney at Disney shop, DLF Mall, Noida, India. The factors that are tested in this research include brand awareness, brand image, perceived quality, brand association, and brand loyalty. A convenient sampling technique was used to collect data from 400 respondents by using online questionnaires. The questionnaire was sent to the people who had visited Disney shop, DLF Mall, Noida, India. The reliability and validity of various factors affecting the brand equity of Disney were examined by confirmatory factor analysis and structural equation modelling. This research found that brand image has the highest relationship and is able to create brand equity for Disney the most, whereas perceived quality and brand association have a low relationship with the brand equity of Disney. In addition, brand awareness has a negative effect on brand equity with a regression weight of-0.086. This research has implications for the brand equity of Disney. There are five factors that can be related to the brand equity of Disney. These five factors are brand awareness, brand image, perceived quality, brand association and brand loyalty. This research helps to develop an insight about the most important factor having an impact on the brand equity of Disney at Disney shop.
PUBLIC INTEREST STATEMENT
As there are numerous brands available in today’s market, brand equity is crucial and important to the product, business, or even the organization. However, there are several aspects of brand equity that can add value to a brand, such as brand awareness, brand image, perceived quality, brand association, and brand loyalty. Disney has also done a fantastic job at building brand value. As a result, the aim of this study is to look at the numerous aspects or factors that influence Disney’s brand equity.
1. Introduction
Disney is very well known as the worldwide entertainment company. It includes four business segments: media networks, park experiences and products, studio entertainment, and direct to consumer and the international segment. Most people around the world have grown up watching Disney entertainment and have access to Disney products. Disney first started with media and cartoon production and has always been trying to get something new outside the media product, theme park, etc. Disney also collaborated with other brands and products in order to create high brand equity around the world.
Disney products are available all around the world. It’s not that only American people or European people are influenced by Disney products, but Asian people are also influenced and fascinated by Disney products. There are many types of brands and different kinds of products that Disney is co-branding, such as bags, clothing, and cosmetics. As McQuarrie (Citation2017) demonstrated, there are many brands like high-end brands, street brands, or even sports brands doing co-branding; for example, Gucci, Givenchy, Coach, Forever 21, Reebok, Kade Spade, Swarovski, Sephora, New Balance, Van, and etc. Collaborating brands with Disney also helps to develop the business faster as many people are already aware of the brand. Miller (Citation2015) stated that UniQlo launched the first lot of T-shirts that featured the classic Disney characters and the result turned up well, so they planned to open the store in Downtown Disney Shop in Orlando.
Disney tries to get closer to its customers in every part of the world and never makes its fans feel disappointed. B (Citation2018) mentioned that there was a campaign in Bangkok, Thailand, where King Power Rangnam and Disney joined their hands together with the Walt Disney (Thailand) Company Limited to celebrate Mickey Mouse’s 90th anniversary at King Power Rangnam. There are people willing to pay more for Disney products as they think that it is worth paying. However, the present research would like to focus on how the brand equity of Disney will encourage Indian fans. Disney knows well how to create brand value and how to promote their brand.
Brand equity is necessary and important to the product, business, or even to the firm because there are various brands available in the market nowadays. However, there are many dimensions that are involved in brand equity, for example, brand awareness, brand image, perceived quality, brand association and brand loyalty that could add value to a particular brand. Moreover, Disney has done an excellent work of creating brand value. Therefore, the present research attempts to study the various dimensions or factors affecting the brand equity of Disney.
2. Literature review
2.1. Brand awareness—Brand equity
Romaniuk et al. (Citation2017) clarified that the customers would be able to recognize and remember when they see products; moreover, brand awareness is a significant thing that can show and trace into the customer’s mind under the various conditions in the market. Customers will probably choose the brand that is well-known to them in the market, while brand awareness encourages the customer to make a decision to purchase as well (Aaker, Citation1991; Bettman & Park, Citation1980; Hoyer & Brown, Citation1990).
2.2. Brand image—Brand equity
Zhang (Citation2015) and Ph Kotler and Barich (Citation1991) alleged that brand image is the way a customer perceives a brand, which includes the information or attitude towards the brand. Furthermore, brand image is created by a set of features of an extraordinary nature, unique to a given brand, which cause its differentiation while simultaneously ensuring the desired market recognition.
Anwar et al. (Citation2011) stated that brand image is the way of perceiving the brand by the customers. Furthermore, brand image can be considered as the first impression of customers as well as a crucial source of brand equity. Alhaddad (Citation2014) implied that creating brand equity needs brand image since brand image motivates brand equity.
Figure 1. The research framework.
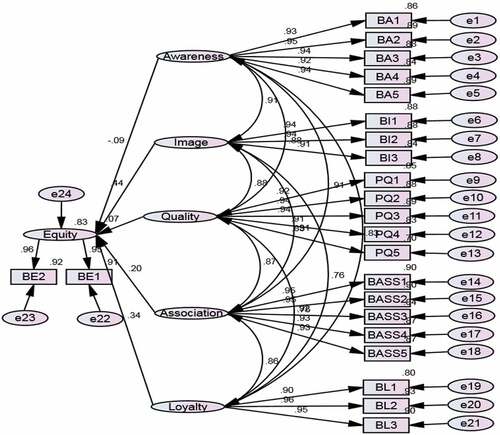
Figure 2. Results of structural model.
2.3. Perceived quality—Brand equity
Aaker (Citation1996) says that perceived quality is one of the elements for making the decision to buy. Furthermore, it is related to the reputation of the product and how those brands can be differentiated from the rest of the brands, while the quality of judgment will totally depend on the customers. Furthermore, perceived quality comes from the customer’s perception. Tsiotsou (Citation2006) implied that perceived quality could guarantee the brand in various ways: customers will mostly rely on high-quality products, which will encourage people to purchase the products again.
2.4. Brand association—Brand equity
Aaker (Citation1991) suggested that “brand associations could provide value to the consumer by providing a reason for consumers to buy the brand and by creating positive attitudes and feelings among consumers.”
Emari et al. (Citation2012); Keller (Citation1993) spoke that brand association could send either good or bad information to the customer’s mind. Besides, brand association also provides three categories, which are attribute, benefit and attitude. These three categories convey all the thoughts and satisfaction of the customer through the brand.
2.5. Brand loyalty—Brand equity
Brand loyalty can be considered as the heart of brand equity. Because purchasing the same product on a regular basis is primarily motivated by brand loyalty. No matter what the price is, loyal customers will accept the product without any conditions (Tong & Hawley, Citation2009).
Besides, Aaker (Citation1991), P. Kotler and Keller (Citation2006) describe that loyalty is the ability of the company to reduce competitors by treating their customers in a better way. Furthermore, loyalty also persuades customers to pay more for a brand even if the products have a high price, so brand loyalty relates to brand equity literally.
2.6. Research framework
This research analyses the relationship between the dimensions that are related to the brand equity of Disney at Disney shop, DLF Mall, Noida, India. The dimensions under study include brand awareness, brand image, perceived quality, brand association, brand loyalty, and brand equity.
The conceptual framework of the study is as follows
:2.7. Research objectives
The primary objective of the present research work is to examine the relationship of Brand Awareness, Brand Image, Perceived Quality, Brand Association, Brand Loyalty with the Brand Equity of Disney.
2.8. Research hypotheses
H1: Brand awareness has no significant relationship with the brand equity of Disney.
H2: Brand image has no significant relationship with the brand equity of Disney.
H3: Perceived quality has no significant relationship with the brand equity of Disney.
H4: Brand association has no significant relationship with the brand equity of Disney.
H5: Brand loyalty has no significant relationship with the brand equity of Disney.
2.9. Research methodology
This research aims to study the relationship between brand awareness, brand image, perceived quality, brand association and brand loyalty toward brand equity of Disney shop, DLF Mall, Noida, India. Descriptive research has been applied to focus on the characteristics of the population that are being studied. Data from 400 respondents has been collected through a convenient sampling technique by an online questionnaire from respondents who have been to the Disney shop, DLF Mall, Noida, India. The survey consisted of eight parts, and a five-point Likert scale was used for evaluating the results. As the research aims to confirm the already existing relationship between brand awareness, brand image, perceived quality, brand association, and brand loyalty toward brand equity, CB-SEM was studied using AMOS (Version 24) software. Moreover, the sample size is also considerably large (400 respondents). CB-SEM is therefore more appropriate than PLS-SEM.
2.10. The results of reliability
As a pilot study, all six variables were tested using Cronbach’s Alpha Coefficient to check their reliability. The sample size considered for the pretest was 30 participants. Table , shows that all six variables, brand awareness, brand image, perceived quality, brand association, brand loyalty and brand equity, are greater than 0.6 (α ≥ 0.6). Peterson (Citation1994) claimed that testing the question for each variable will be accepted only when the Cronbach’s Alpha Coefficient test is greater than 0.6 or equal to 0.6. Since the results of the pretest show that in each case, the value is more than 0.60, indicating that the questions are reliable and acceptable for the study, Moreover, Griethuijsen et al. (Citation2014) describe that the acceptable value is normally at 0.70. Considering this, the questionnaire is acceptable as the values of all six variables are higher than 0.70.
Table 1. Summary of Cronbach’s Alpha Coefficient for Pretest
3. Results and discussion
3.1. Demographic factors
This section summarizes the demographic profile of 400 respondents using frequency and percentages. Demographic factors such as gender, age, monthly income, educational level, and job position of 400 respondents having experience of visiting the Disney shop, DLF Mall, Noida, India are shown in Table . The table indicated that the sample size of female participants was 58% (232 respondents), while male respondents comprised 42% (168 respondents). The age group information shown in Table highlights that most of the participants are in the age group between 26 and 30 years old, with 42.5% (170 respondents), followed by the participants aged 21–25 with 22% (88 participants), followed by the participants aged 31–35 with 14.25% (57 participants). The fourth one is the age group of people who are 36–40 with 9% (36 participants), followed by the age group of people who are 20 or less with 6.75% (27 participants). Lastly is the age group of people who are over the age of 41 with 5.5% (22 participants).
The monthly income range indicated that the salary range of INR 40,001—INR.50, 000 has the highest percentage, 36% (144 participants), followed by the salary range of INR 50, 000 or more with 32% (128 participants), INR 30,001—INR 40, 000 with 21.25% (85 participants), and the last group, with the lowest percentage, was the salary range of INR 30, 000 or less with 10.75% (43 participants).
The educational level demographic data showed that the highest educational level of respondents is bachelor degree with 72% (288 participants). The second highest educational level of respondents is high school or less, with 10% (40 participants). There are two levels in this category with the same percentages and participants. Those two levels are associate’s degree and post-graduation, with 9 percent (36 participants) each.
The final demographic data point is the job position category, which includes employed for pay, self-employed, students, and unemployed and looking for work. Employed for wage is the one with the highest percentage, with 57.25% (229 participants). The second highest is self-employed with 28.75% (115 participants), followed by out of work and looking for work with 7.25% (29 participants), and students with 6.75% (27 participants).
3.2. Confirmatory factor analysis
The present study highlighted the relationship between brand awareness, brand image, perceived quality, brand association, brand loyalty and brand equity of Disney at Disney shop, DLF Mall, Noida, India. Confirmatory factor analysis was applied to check the robustness and validity of the measurement model for all the constructs. Each construct was tested by evaluating the criteria of overall fit with data, in terms of reliability, convergent and discriminant validity.
The results () indicated that the base model is acceptable as, in the majority of cases, the results exceeded the minimum required threshold, with results of Composite Reliability (Construct Reliability) being more than the threshold value of 0.70. The Average Variance Extracted (AVE) for each construct also exceeded the required threshold of 0.50. Moreover, the factor loadings of all indicator items are also more than the recommended threshold of 0.70, indicating that the measurement has sufficient convergent validity .
Table 2. Summary analysis of the demographic features using frequency and percentage
3.3. Discriminant validity
Table indicates that the discriminant validity has been achieved as all crossed construct correlations are lower than the square root of the AVE (Average Variance Extracted).
Table 3. Results of confirmatory factor analysis, average variance extracted and construct reliability
Table 4. Discriminant Validity
3.4. Analysis of the structural model
In order to test the hypotheses, structural equation modelling was employed, and the results are shown in Table and Table .
Table 5. Goodness of fit indices of the structural model
Table 6. Hypotheses testing results of the structural model
Seven of the model fit indices were used for assessing the model fit (Table ).
Table shows that the CMIN/df was 2.975, indicating a good fit. Other indices of goodness of fit, such as GFI (Goodness of Fit), CFI (Comparative Fit Index), IFI (Incremental Fit Index), NFI (Normed Fit Index) and TLI (Trucker-Lewis Index) are 0.88, 0.970, 0.971, 0.956 and 0.965 respectively. Each index is greater than the minimum threshold of 0.90, except for GFI, which is slightly lower than 0.90. The RMSEA (Root Mean Square Error of Approximation) is 0.070, which is also lower than 0.08 as required, indicating that the model is a good fit.
4. Conclusion
Table indicates that hypotheses second and fifth have p-values of less than 0.001, indicating a significant positive relationship between brand image, brand loyalty, and brand equity. As brand image acts as a link between the product and the consumer’s perceptions and beliefs about the brand, it will always have a positive impact on brand equity. Similarly, customers who buy a particular brand again and again, create trust in a particular brand, and consistently prefer a particular brand over competitors will obviously help to significantly impact brand equity. Thus, both hypotheses stand rejected. At the same time, p-values of hypotheses first, third, and fourth are more than 0.001, indicating an insignificant relationship between brand awareness, brand quality, brand association, and brand equity of Disney at Disney shop. Thus, hypotheses (1), (3), and (4) are accepted. In such a situation, we can conclude that the effect of brand image on brand equity is strongest with a regression weight of 0.442. The effect of brand loyalty on brand equity of Disney at the Disney shop is the second strongest, with a regression weight of 0.342. In addition, brand awareness has a negative effect on brand equity with a regression weight of-0.086. In terms of brand image, Disney has presented itself to the public quite well. The way they do this is different from the other brands. It has made it easy for the customer to remember Disney and has made it a memorable and valuable brand. Moreover, people mostly buy things for what they value in each product. It does not matter to them whether the price is high or low. Thus, selection should be based on focusing on which factors can create value or relate to the brand equity well.
5. Limitations and further study
Disney is a brand that is well known worldwide, and therefore an attempt has been made in this paper to understand how Disney has created its brand equity. The area of the study was totally focused on people visiting Disney Shop, DLF Mall, Noida, India. The majority of the demographic data are female (> 50%) with an average age of 26 to 30, a monthly income of Rs.40,001 to Rs.50,000, a bachelor’s degree, and job position category of employed.
The study analyzed the relationship between the dependent variables (brand equity of Disney) and independent variables (brand awareness, brand image, perceived quality, brand association and brand loyalty), based on the objective of the study. In real life, there can be many other factors apart from these five independent variables that can affect the brand equity of Disney, the outcome of which would probably be different from this study. Eventually, the results shown by those factors apart from these variable factors could have more potential and more valuable results for the brand equity of Disney.
Disclosure statement
The authors reported no potential conflicts of interest.
Additional information
Funding
Notes on contributors
Bhumiphat Gilitwala
Bhumiphat Gilitwala is a faculty member at the Graduate School of Business and Advanced Technology Management, Assumption University of Thailand. A Royally Decorated Academician who has been conferred with “The Most Admirable Order of the Direkgunabhorn” by the King of Thailand for his devotional services rendered to the Kingdom of Thailand. He has done his Doctorate in Management & Organization Development from Assumption University of Thailand and has 33 years of experience in the field of Higher Education and Industry. He has also completed a certificate in “Marketing 3.0-Value Driven Marketing”, facilitated by Philip Kotler.
Amit Kumar Nag
Amit Kumar Nag is Associate Professor and Head, Department of Commerce, Bhopal School of Social Sciences (BSSS). He has done his Doctorate in Finance and is having an experience of 18 years in the field of Higher Education. He is also a Visiting Faculty for MBA (Professional) at Assumption University of Thailand. He is actively involved in research, particularly in the field of Accounting, Finance and Taxation. He has published more than 50 research papers in various journals of National and International repute.
References
- Aaker, D. A. (1991). Managing brand equity: capitalizing on value of a brand name. The Free Press.
- Aaker, D. A. (1996). Building strong brands. The Free Press.
- Alhaddad, A. (2014). The effect of brand image and brand loyalty on brand equity. International Journal of Business and Management Invention, 3(5), 28–11. https://www.ijbmi.org/papers/Vol(3)5/Version-4/D0354028032.pdf
- Anwar, A., Gulzar, A., Sohail, F. B., & Akram, S. N. (2011). Impact of brand image, trust and effect on consumer brand extension attitude: The mediating role of brand loyalty. International Journal of Economics and Management SciencesVol, 1(5), 73–79. https://www.hilarispublisher.com/abstract/impact-of-brand-image-trust-and-affect-on-consumer-brand-extension-attitude-the-mediating-role-of-brand-loyalty-19430.html
- B, T. O., Ed. (2018). King power joins hand with The Walt Disney (Thailand) company limited to celebrate mickey mouse’s 90th anniversary, kicking off the “king power and disney’s endless celebrations” campaign. https://www.timeout.com/bangkok/news/king-power-joins-hand-with-the-walt-disney-thailand-company-limited-to-celebrate-mickey-mouses-90th-anniversary-kicking-off-the-king-power-and-disneys-endless-celebrations-campaign-102618.
- Bettman, J. R., & Park, C. W. (1980). Effects of prior knowledge and experience and phase of the choice process on consumer decision processes: A protocol analysis. Journal of Consumer Research, 7(3), 234. https://doi.org/10.1086/208812
- Emari, H., Jafari, A., & Mogaddam, M. (2012). The mediatory impact of brand loyalty and brand image on brand equity. African Journal of Business Management, 6(17), 5692-5701. https://academicjournals.org/article/article1380786406_Emari%20et%20al.pdf
- Griethuijsen, R. A. L. F., Eijck, M. W., Haste, H., Brok, P. J., Skinner, N. C., Mansour, N., Savran Gencer, A., & BouJaoude, S. (2014). Global patterns in students’ views of science and interest in science. Research in Science Education, 45(4), 581–603. https://doi.org/10.1007/s11165-014-9438-6
- Hoyer, W. D., & Brown, S. P. (1990). Effects of brand awareness on choice for a common, repeat-purchase product. Journal of Consumer Research, 17(2), 141–148. https://doi.org/10.1086/208544
- Keller, K. L. (1993). Conceptualizing, measuring, managing customer-based brand equity. Journal of Marketing, 57(1), 1–22. https://doi.org/10.1177/002224299305700101
- Kotler, P., & Barich, H. (1991). A framework for marketing image management. Sloane Management Review, 2(32), 94–104. https://sloanreview.mit.edu/article/a-framework-for-marketing-image-management/
- Kotler, P., & Keller, K. (2006). Marketing management (12th ed.). Prentice Hall.
- McQuarrie, L. (2017, April 5). 47 official Disney collaboration. Trendhunter Create the future. https://www.trendhunter.com/slideshow/disney-collaborations
- Miller, M. J. (2015, August 3). Uniqlo partners with Disney to create magic for all collection. https://www.brandchannel.com/2015/08/03/Disney-Disney-080315/
- Peterson, R. A. (1994). A meta-analysis of cronbach’s coefficient alpha. Journal of Consumer Research, 21(2), 381–391. https://doi.org/10.1086/209405
- Romaniuk, J., Wight, S., & Faulkner, M. (2017). Brand awareness: Revisiting an old metric for a new world. Journal of Product & Brand Management, 26(5), 469–476. https://doi.org/10.1108/JPBM-06-2016-1242
- Tong, X., & Hawley, J. M. (2009). Measuring customer-based brand equity: Empirical evidence from the sportswear market in China. Journal of Product & Brand Management, 18(4), 262–271. https://doi.org/10.1108/10610420910972783
- Tsiotsou, R. (2006). The role of perceived product quality and overall satisfaction on purchase intentions. International Journal of Consumer Studies, 30(2), 207–217. https://doi.org/10.1111/j.1470-6431.2005.00477.x
- Zhang, Y. (2015). The impact of brand image on consumer behavior: A literature re- view. Open Journal of Business and Management, 3(1), 58–60. https://doi.org/10.4236/ojbm.2015.31006