
 ?Mathematical formulae have been encoded as MathML and are displayed in this HTML version using MathJax in order to improve their display. Uncheck the box to turn MathJax off. This feature requires Javascript. Click on a formula to zoom.
Abstract
In Ethiopia, the gender gap in financial inclusion is high, and the effect of socioeconomic variables on the gap is not well investigated. The main objective of this study is to investigate determinants of the financial inclusion gender gap in Ethiopia using the World Bank’s Global Findex database from 2017. Different decomposition techniques were employed to examine the effect of socioeconomic characteristics of individuals on the financial inclusion gender gap. The finding shows a statistically significant gender gap in all indicators of financial inclusion under study in Ethiopia. More specifically, males are 6.3%, 7%, 9.8%, 8.4 %, and 5.8% more likely to have a formal account, formal saving, formal borrowing, emergency fund, and debit card ownership, respectively. The result from the Daymont and Andrisani approach reveals that differences in socioeconomic characteristics between males and females explain the gender gap in formal saving, formal account ownership, debit card ownership, and emergency fund, while the gap in formal borrowing is attributed to differences in returns to these characteristics. Besides, the observed gender gap in all indicators of financial inclusion is explained by gender disparity in commitment in financial markets. Age, income, education, employment, and mobile ownership are determinants of the gender gap in financial inclusion in Ethiopia. Being older, more educated, employed, and having mobile, and wealthier favor financial inclusion, with age, employment, and education having a greater effect. Gender mainstreaming in economic activities to increase income, employment opportunities, and education for females to bridge the gender gap in financial inclusion is important.
1. Introduction
Financial inclusion refers to enabling all individuals and businesses in an economy to have access to useful and affordable financial services that meet their needs (Sha’ban et al., Citation2019). It indicates all efforts that primarily enable low-income people to access affordable formal financial services (Omar & Inaba, Citation2020). According to Zins and Weill (Citation2016), financial inclusion is related to having an account at a formal financial institution that enables a person to save and borrow money. Access, usage, and quality are the three dimensions of financial inclusion. Access refers to affordability and physical proximity. Usage implies regularity, frequency, and duration of time used, whereas quality refers to the customization of products to client needs and appropriate segmentation to develop products for all income levels (Triki & Faye, Citation2012).
Nowadays, financial inclusion has been regarded as a vital instrument for realizing multidimensional macroeconomic stability, sustainable and inclusive economic growth, employment generation, poverty reduction and income equality in both developed and developing nations (Omar & Inaba, Citation2020). Furthermore, financial inclusion plays a crucial role in meeting the United Nation’s Sustainable Development Goals (Kuada, Citation2019; Omar & Inaba, Citation2020). For instance, access to finance enables the impoverished segment of society to enhance their production and productivity that can improve their food security (SDG 2), invest in human capital and health (SDGs 3 and 4), promote gender equality (SDG 5), and meet the decent work goal and innovation goal (SDGs 8 and 9).
Financial inclusion is still one of the most significant development priorities. As a result, there is increased interest in intellectuals, financial institutions, governments, policymakers, and others (Abel et al., Citation2018). The significance of financial development in every country’s economic growth is critical. It is a crucial component of economic development since it functions as the economy’s “blood.” For the economy to remain healthy, financial development must flow in the same way that blood does in the human body. According to research conducted in 67 low and middle-income countries, financial development is an important instrument for poverty reduction (Boukhatem, Citation2016; Nanziri, Citation2016; Ogunleye, Citation2017). Hence, financial development in one country denotes that there is alternative funding for the poor and disadvantaged groups because it enhances access to finance. Financial inclusion is one of the major indicators of financial development (Hajilee et al., Citation2017; Li, Citation2018; Singh, Citation2019).
Access to finance contributes to economic development (Aterido et al., Citation2013; Desalegn & Yemataw, Citation2017; Zins & Weill, Citation2016). We cannot think of development without finance. When there are fast and accessible financial services, it is easy for individuals as well as organizations to fulfill their needs. In one way or another, they are gratifying themselves, and they are partaking in economic activities via different level investments. Hence, financial inclusion denotes having all kinds of financial needs in a continuous way for sustainable economic prosperity. Financial inclusion reduces poverty and income inequality (Aslan et al., Citation2017; Neaime & Gaysset, Citation2018; Ogunleye, Citation2017; Park & Mercado, Citation2017).
It appeared that the financial inclusion of women is vital in the broader socio-economic play in developing nations. Sharma et al. (Citation2013), and Sujlana and Kiran (Citation2018) noted that for the inclusive growth of a country, inclusive financing remains mandatory. Financially independent citizens contribute to a strong and independent economy. Thus, ensuring financial stability for citizens is ensuring sustainable development.
World Economic Forum (Citation2019) data shows one-third of the population of adults remains unbanked. Of these, about half the % are women population which are living in rural areas. In developing nations, the gender gap in owning accounts is only 9 %. This is shocking news for countries since the gender gap has a big implication for economic development. Financial exclusion of women hampers their participation in any economic activities, diminishes innovation, and deteriorates participation in entrepreneurial endeavors (Fareed et al., Citation2017). Credit and other financial services can provide small-scale farmers with the opportunity to improve farm productivity and transition from subsistence farming to large-scale and commercial farming. In the short run, credit can help farmers increase their purchasing power to gain necessary production inputs and finance their operating expenses, while in the long run, it can help farmers to make profitable investments. Female farm managers, however, are 9 %age points less likely to live in a household with access to credit than male farm managers (Buehren et al., Citation2019).
The gender gap is an important dimension in the debate over access to finance that has received less attention. It has often been contended, for example, that a lack of access to finance stifles female entrepreneurship and inhibits women from participating in the contemporary market economy. Recent worldwide data analysis demonstrates the extent to which Sub-Saharan African (SSA) countries are distinguished by a degree of gender that is different from other regions (Aterido et al., Citation2013). Females are still less likely than males to have an account with a financial institution, according to the World Bank’s (Citation2017) Global Findex Database (Demirguc-Kunt et al., Citation2018).
One reason a woman may have less access to formal credit is that she is less likely to possess and manage tangible assets that may be used as collateral. Furthermore, women have lower levels of human and social capital on average, which might limit their access to formal finance, and this disadvantages women. When financing is scarce, farmers are more inclined to utilize sub-optimal amounts of productive inputs, reducing their productive potential (Buehren et al., Citation2019). Deléchat et al. (Citation2018) find a robust negative relationship between being female and financial inclusion as in previous studies, and their analysis points to legal discrimination, lack of protection from harassment, including at the workplace, and more diffuse gender norms as possible explanatory factors.
An initiative led by the World Bank Group focuses on accelerating country-based reforms to achieve countries’ national financial inclusion goals. The initiative is called The Financial Inclusion Support Framework (FISF). Commenced in 2013, the initiative is supported by G20 countries to improve the existing situation regarding financial services in unbanked and under-banked sectors. With the national support program and knowledge components, FISF is committed to helping countries to build financially strong nations. The national support program component under its four themes- national financial inclusion strategy and monitoring and evaluation; financial infrastructures, such as payments and credit reporting systems; diversified financial services for individuals and enterprises; and financial consumer protection and financial capability has been implemented by different countries. Ethiopia is among a few counties like Mozambique, Rwanda, Indonesia, Zambia, Pakistan, Vietnam, and Cote d’Ivoire that launched Country Support Programs in 2015. Supporting strategies for national financial inclusion in Ethiopia was also one of the moves of the initiative (Brief, Citation2018). Even though Ethiopia has put remarkable efforts into promoting financial inclusion, it is not as successful as other East African countries. Evidence shows that Ethiopians, especially women, prefer informal saving clubs rather than formal financial institutions. In this regard, Lakew and Azadi (Citation2020) argued that this preference, combined with unemployment and low income, is the barrier to the financial inclusion strategy in Ethiopia.
Some economies have had gains in account ownership but missed out on opportunities for greater progress because women were insufficiently included. In Ethiopia, account ownership has risen by 18 %age points among men since 2014, roughly twice the size of the increase among women (Demirguc-Kunt et al., Citation2018). At the economic level, too, gender gaps have mostly remained stable. Economies that had no gender gap in 2014 generally still do not have one; the converse is also true. But there are exceptions. In 2014, no gender gap was found in Burkina Faso or Ethiopia. Since then, these two economies have seen a big growth in account ownership—but more among men than women. As a result, both now have a double-digit gender gap in account ownership.
The availability of finance and its accessibility have a significant impact on farmers’ production start-up and subsequent performance. Obstacles to obtaining adequate loans will affect farm households’ technical efficiency. Increased output production as a result of better credit availability is, therefore, evidence of binding credit constraint (Komicha & Öhlmer, Citation2007).
Women farmers are less productive than male farmers in Ethiopia (Ethiopia’s Ministry of Agriculture and Natural Resources, UN Women, UNDP, & UN Environment, Citation2018). According to the World Bank and ONE (Citation2013), the agricultural productivity gender gap in Ethiopia was found to be 24%. This gap is attributed to women’s unequal access to key agricultural inputs, including labour, land, fertilizers, improved seeds, and knowledge which in turn are highly determined by access to financial resources. This is because, financial resources constraint is a barrier to modern agricultural technology adoption (Balana et al., Citation2020). Constrained access to finance affects not only the agricultural productivity and efficiency of women but also their chance of participating in off-farm activities and self-employment. For instance, Komicha and Öhlmer (Citation2007) found that the mean technical efficiency score of credit unconstrained farm households is 12% higher than that of credit-constrained farm households in Ethiopia. Mukasa et al. (Citation2017) argued that credit constraints result in a productivity loss of about 60% in Ethiopia and the majority of the losers are female-headed smallholders.
Financial exclusion impedes the entrepreneurial endeavors of women and prevents them from actively participating in market economies (Aterido et al., Citation2013; Kuada, Citation2019). It is argued that the availability of financial resources will encourage talented but poor entrepreneurs to start their businesses. According to Beriso (Citation2021), lack of access to finance is the major leading major factor hindering Ethiopian women entrepreneurs in entrepreneurial activities.
Being financially excluded relative to men, women in Ethiopia are constrained from participating in various economic activities to their full potential. They lag behind their male counterparts in terms of productivity and efficiency due to the low adoption of modern technology. Besides, women earn lower incomes from self-employment and wage income. All these impede the endeavors of Ethiopian women to pull themselves from the poverty trap and aggravate income inequality. The financial inclusion gender gap, therefore, is a major challenge for Ethiopia to realize inclusive growth, the full potential of women’s economic empowerment, and gender equality. Despite the seriousness of the consequences of the financial gender gap in Ethiopia, empirical studies that address factors determining the gap are non-existent. Given this background, the current study tries to examine how socioeconomic characteristics contribute to the financial inclusion gender gap by considering different indicators of financial inclusion.
This paper makes three major contributions to the existing empirical literature. First, to the best of the authors’ knowledge, this paper is the first of its kind for Ethiopia that attempts to examine gender gaps in access to, usage, and quality of financial services, which are core dimensions of financial inclusion. Unlike Lakew and Azadi (Citation2020), Abdu et al. (Citation2021), and Desalegn and Yemataw (Citation2017), who studied determinants of financial inclusion, this paper focuses on determinants of the financial inclusion gender gap in Ethiopia. Second, the majority of the previous related empirical literature dealt only with a single dimension of financial inclusion, mainly that related to access. This fails to capture the full picture of financial inclusion. The present study tries to cover all three dimensions, access, usage, and quality, of financial inclusion in examining the determinants of the financial inclusion gender gap in Ethiopia. Third, contrary to the majority of the previous related studies that employed traditional econometric estimation techniques like OLS, probit, and logit, this study contributes to the existing stock of literature by applying a more robust decomposition method in Ethiopia.
The remainder of this paper is organized as follows. Section 2 presents data and methods of data analysis. Section 3 discusses results on the financial inclusion gender gap in Ethiopia, and Section 4 is devoted to conclusions and policy implications.
2. Conceptual framework
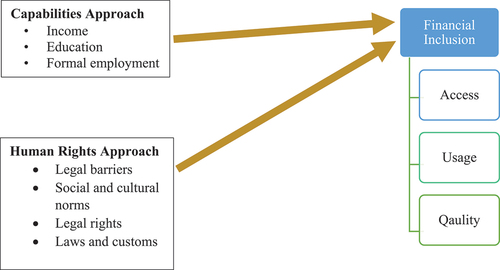
According to Benería et al. (Citation2015), the gender gap in economic outcomes, including financial inclusion, is explained by the human rights approach and the capabilities approach. According to the human rights argument, everyone in society should have access to the same rights, regardless of their sexual orientation. However, in Sub-Saharan African countries, women do not enjoy the same rights in the financial system. Women are constrained from entering into contacts under their name due to discriminatory treatment under law or customs. Gender norms hinder women’s access to and use of financial services and the level of autonomy that they enjoy in controlling their income source. Institutions in African countries equally limit women’s access to land ownership, which is a barrier to their access to credit, as land is often used as collateral (Balasubramanian et al., Citation2018). Demirgüç-Kunt et al. (Citation2013) argue that women in developing countries like Ethiopia face greater and more systematic barriers to accessing formal financial services. Furthermore, legal barriers like access to national ID documents or another legally recognized ID credential (Demirgüç-Kunt et al., Citation2022) hinder women from financial inclusion as compared to men. Stronger legal rights promote financial inclusion (Allen et al., Citation2016) which implies women in developing countries, where legal rights are weak, are financially excluded. In sum, all factors mentioned above detrimentally affect access to physical and reputational collateral for women which in turn degrades creditworthiness of women in the financial market.
On the other hand, the capabilities arguments assume that the unequal allocation of resources is the cause of many.
other discriminations and inequalities, notably those of income and gender. Gender gaps in financial inclusion can be explained by gender differences in capabilities such as income, education levels, and formal employment (Aterido et al., Citation2013; Ndoya & Tsala, Citation2021). Evidence shows that the differences between men and women in access to and use of financial services can be explained by the fact that men are more likely than women to have access to education (Aterido et al., Citation2013; Kara et al., Citation2021; Ndoya & Tsala, Citation2021; Sharif et al., Citation2022) because it has a direct connection with financial literacy (Ozili, Citation2020). According to Kara et al. (Citation2021), the financial literacy gap between males and females explains the gender gap in financial inclusion. Other scholars attribute the gender gap in financial inclusion to the difference in education, income, and employment (Deléchat et al., Citation2018; Demirgüç-Kunt et al., Citation2013; Ghosh & Chaudhury, Citation2019; Ndoya & Tsala, Citation2021; Sharif et al., Citation2022; Shihadeh, Citation2018; Zins & Weill, Citation2016). The following conceptual framework illustrated in is developed based on related previous empirical studies.
Figure 1. Conceptual framework.
3. Data and methods
3.1. Variables and sources of data
Data for the study were obtained from the 2017 Global Findex Database, which was based on survey data collected by Gallup Inc. as part of its Gallup World Poll. The 2017 Global Findex Database was compiled using nationally representative surveys of more than 150,000 adults aged 15 and above in 144 countries in 2017. From each country surveyed, approximately 1000 people were randomly selected and interviewed. The entire civilian, excluding the institutionalized population, was the target population of the survey.
The 2017 Global Findex database includes updated indicators on access to and use of formal and informal financial services. It has additional data on the use of financial technology (or fintech), including the use of mobile phones and the Internet to conduct financial transactions. The data reveal opportunities to expand access to financial services among people who do not have an account—the unbanked—as well as to promote greater use of digital financial services among those who do have an account. It also provides micro-level information—gender, age, income, and education—that will be used in our estimations. The current study focuses on determinants of the financial inclusion gender gap in Ethiopia.
Following the previous related literature, this study focuses on three main indicators of financial inclusion, i.e., formal account, formal borrowing, and formal saving.
Formal account ownership refers to the fact that the individual has a bank account either at a financial institution or through a mobile money provider. Formal saving refers to the fact that the individual saved money using an account at a financial institution in the past 12 months. Formal borrowing means that the individual borrowed from a financial institution in the past 12 months.
To examine the gender gap in the availability of modern technology in financial services, we use debit card holding as an indicator. Besides, whether or not it would be possible to come up with an amount equal to 1/20 of gross national income (GNI) per capita in local currency within the next month is used as an indicator to shed light on factors determining the financial resilience to the unexpected gap between females and males on their expenses. All aforementioned financial inclusion indicators are dummy variables that take 1 if the respondents respond “Yes” to questions and 0 otherwise. The variable name, variable description, and expected sign of the explanatory variable are presented in Table .
Table 1. Variables definition and expected sign
3.2. Estimation strategies
Blinder (Citation1973) and R. Oaxaca (Citation1973) introduced the decomposition method, which was later extended by Neumark (Citation1988) and R. L. Oaxaca and Ransom (Citation1988, Citation1994) to decompose outcome variables between two groups into a part explained by differences in observed characteristics and a part explained by differences in the returns to these characteristics (Bauer & Sinning, Citation2008; Fairlie, Citation2005, Citation2017; Jann, Citation2008). However, if the result is binary and the coefficients are from a logit or probit model, the technique cannot be used directly (Fairlie, Citation2005). Since all dependent variables in this study are binary, the conventional Oaxaca-Blinder decomposition technique to decompose the financial inclusion gender gap is not appropriate because it generates inconsistent estimates, therefore, provides misleading decomposition results (Fairlie, Citation2017; Sinning et al., Citation2008). To overcome this problem, this study applies a Fairlie decomposition approach, which best fits binary dependent variables.
The standard Blinder-Oaxaca decomposition of the male/female difference in the average value of the dependent variable for linear regression is as follows:
Where is a row vector of average values of the independent variables and
is a vector of coefficient estimates for gender
. Following Fairlie (Citation1999, 2006), and Ghosh and Chaudhury (Citation2019), this study applied the Fairlie decomposition technique for a nonlinear equation
to analyze the gender gap in financial inclusion in Ethiopia. Fairlie decomposition model can be specified as:
Where is the sample size for gender
(M = male, F = Female).
is the mean probability of outcome variable for sex
is the vector of independent variables for sex case
,
the vector of coefficient estimates including a constant term, and F is the cumulative distribution function from the logistic distribution. The first term in brackets represents the part of the gender disparity caused by differences in group X distributions (i.e., differences in the distributions of the independent variables), and the second term represents the part caused by differences in group processes deciding (i.e., differences in the coefficients) levels of Y. The second term also includes the portion of the gender difference created by unmeasurable or unobserved endowments between classes.
Notably, in the first term of the equation, we use the male coefficient estimates as weights, while in the second term, we use the female distribution of independent variables
as weights.
An equally valid expression for the decomposition is:
Here, the female coefficient estimates are used as weights for the first term in the decomposition, and the male distributions of the independent variables
are used as weights for the second term.
The Blinder-Oaxaca decomposition technique’s alternative method of measuring the decomposition often yields different estimates, which is a well-known index problem (Fairlie, Citation2006; Ghosh & Chaudhury, Citation2019). A third choice is to use coefficient estimates from a combined sample of the two groups to weigh the first term of the decomposition expression. In our research, we used this method to measure decomposition. We used coefficient estimates from a logit regression with a sample of all gender groups in particular.
However, an additional calculation is needed to assess the contribution of a specific variable to the gender gap. Consider the case where X comprises two variables: and
. As a consequence, the independent contribution to the gender gap can be expressed as:
Similarly, the contribution can be expressed as:
The number of contributions from individual variables would equal the cumulative contribution from all of the variables measured for the full sample, which is a useful property of this technique. The cumulative contribution of sex differences in the independent variables to the gender disparity in the dependent variable is calculated using this methodology. It also helps us to determine how much each independent (explanatory) variable contributes to the overall difference. The change in the average predicted probability from replacing the female distribution of a specific variable with the male distribution while holding the distributions of the other variables constant is the contribution of each explanatory variable to the gap.
A one-to-one matching of cases between the two groups is used in the decomposition technique (Aterido et al., Citation2013; Ghosh & Chaudhury, Citation2019). Because the groups are different sizes, a sample is taken, and the process is repeated 1000 times, with the mean results being reported. We draw a random sub-sample of females with or without replacement equal to the size of the full male sample and match the sample by their respective rankings in predicted probabilities because the number of females and males is not equal. We draw 1,000 different sub-samples because the decomposition estimates are sensitive to the sub-sample chosen, and our results are based on average values obtained from the decomposition method carried out over these sub-samples.
We used decomposition techniques suggested by Daymont and Andrisani (Citation1984) to decompose the disparities in financial inclusion between males and females into a part explained by differences in observable characteristics, a part explained by differences in estimated coefficients, and a part explained by interactions between characteristics and coefficients.
where E denotes the portion of the raw differential due to endowment differences, C denotes the portion attributable to coefficient differences, and CE denotes the portion that can be clarified by the relationship between C and E. Bauer and Sinning (Citation2008) created the Stata command “nldecompose,” which is used to estimate EquationEquation 7(7)
(7)
The decomposition strategies discussed thus far do not provide a detailed breakdown of each independent variable’s contribution to the disparity in financial inclusion between the two classes. Furthermore, path dependence and identification issues associated with the selection of a reference group in which dummy variables are included among the independent variables plague the techniques. To solve these issues, we used the detailed decomposition technique developed by Powers et al. (Citation2011). When dummy variables are used in the predictors, this approach manages path dependence (Schwiebert, Citation2015; Yun, Citation2004), computes asymptotic standard errors (Yun, Citation2005b), and overcomes the identification problem associated with the choice of a reference group (Yun, Citation2005a, Citation2008). According to Powers et al. (Citation2011), the raw difference can be expressed as a sum of weighted sums of the unique inputs in terms of the total components.
Where is the weight component for the explained component (E) and
is the weight for the unexplained component (C).
4. Results
In this section, we present both preliminary results based on descriptive statistics and econometric decomposition analysis from different decomposition techniques.
4.1. Descriptive statistics
The data used in this study comprises 39.8% males and 60.2% females. About 71.3% of respondents attended secondary education, while 28.7% have primary education. The average age of the sampled respondents is 33, with 15 and 98 minimum and maximum ages, respectively.
Descriptive statistics and inferential statistics, such as t-test and chi-square tests, as set out in Table below and Table of Appendix Section, are used to present a preliminary finding on the gender differential in financial inclusion and selected socio-economic variables.
Table 2. Two-sample t-test with unequal variances
The findings from Table show that there is a statistically significant age gap between males and females in the surveyed individuals. Males are, on average older than their female counterparts by three years, and the age difference is statistically significant at a 1% level of significance. Table in Appendix shows that there is no statistically significant association between the level of income and gender, which lays down preliminary evidence that the financial gender gap in Ethiopia is not mainly attributed to the difference in income level between males and females. Educational status and employment status are statistically associated with gender. It shows that a larger proportion (76.3%) of females attended primary education compared to males (63.8%). However, the proportion of males who attended secondary education (36.2%) is higher than that of females. This confirms that there are huge education gender gaps in Ethiopia. According to the World Economic Forum (Citation2021) Global Gender Gap Report, the education gender gap in Ethiopia amounts to 15%-20%. There is a statistically significant association between gender and employment status in Ethiopia during the study period. Moreover, national ID and mobile ownership are associated with the gender of the respondent, as indicated in Table .
4.2. Explaining financial inclusion gender gap
4.2.1. Fairlie nonlinear decomposition estimates
Results in Table in the Appendix reveal a statistically significant association between all the financial inclusion indicators used in this study and gender. Table shows the results of Fairlie’s nonlinear decomposition. The results of the decomposition present the gender gap and its determinants in each indicator of access, usage, and quality of financial services in Ethiopia. The result reveals that there is financial inclusion gender gap in all indicators under consideration though the magnitude of the gap varies across the indicators used. The decomposition of formal saving reveals that females have a 0.646 likelihood of having formal saving, as compared with 0.716 for men resulting in a gender gap of 0.070. Out of the total gap, 142.8% is explained by the socioeconomic variables in the model. More specifically, employment status and age of the household play a great role in explaining the gender gap in formal saving. However, educational status does not affect the gender gap in formal saving, and the result is in line with the finding of Fungacova and Weill (Citation2015).
Table 3. Fairlie decomposition result
Males have a 0.530 likelihood of having a formal account, as compared with 0.367 for females, which implies that males are 0.163 more likely to have a formal account compared to females. Of the total gender gap in having a formal account, 85.7% is explained by age, age squared, education, employment, mobile ownership, and national ID ownership, while 14.3% remains unexplained. The decomposition for formal borrowing shows that males have a 0.530 likelihood of borrowing from formal financial institutions, as compared with 0.367 for females, which results in a gender gap of 0.098. Only 16.3% of the total gender gap in formal borrowing is explained by the socioeconomic variables in the model, while 83.7% is unexplained.
A decomposition result in Table indicates that males have a 0.116 likelihood of having a debit card, as compared to 0.058 for females, which shows a 0.058 gender gap. About 52.2% of the total gap is explained by income quintile 4, education, and employment. There is a gender gap in the possibility of coming up with an emergency fund. Females have a 0.589 likelihood of coming up with an emergency fund, compared with 0.673 for men. This shows a 0.041 gender gap in the possibility of coming up with an emergency fund. About 48.6% of the total gap is explained by income quintile 1, income quintile 4, and education.
Table 4. Daymont and Andrisani decomposition results
In the case of formal account ownership, only 35% of the gap is explained by differences in these socioeconomic variables. The differences in socioeconomic variables explain 29.5% of the gender gap in formal saving and 17.3% in formal borrowing. Among the financial inclusion indicators considered in this study, group differences in socioeconomic variables better explain the gender gap in debit card holding (65.5%), while the contribution of the socioeconomic variables in explaining the gender gap in case of the possibility of coming up with emergency fund is the least (7.1%). The results show that a higher proportion of the gender gap in indicators of financial inclusion, except debit card holding, is attributed to differences in other factors across gender.
4.2.2. Daymont and andrisani decomposition estimates
This section presents the overall gender disparity calculated in Table in the selected financial inclusion indicators decomposed into differences in characteristics, differences in coefficients, and interaction effects between the two. The weighting introduced by Neumark (Citation1988) was applied in specifying Omega, and the bootstrap method was used to drive analytic standard errors of the components of the decomposition equation to judge the statistical significance of the estimates. The findings of the decomposition (gender gap) depicted in Table are consistent with those in Table . In comparison to their male counterparts, females lag in all indicators of financial inclusion. The following sections look at the factors that contribute to the gender gap in financial inclusion in Ethiopia.
Table 5. Detailed decomposition results
The overall gender disparity in financial inclusion can be decomposed into three components: differences in observable characteristics/predictors, differences in coefficients, and the interaction between characteristics and coefficients. Furthermore, the overall gender disparity in financial inclusion is decomposed into differences in efforts, advantages to males, and disadvantages to females.
The estimate of characteristics for formal saving is positive and statistically significant at the 1% level of significance, meaning that the gender gap in formal saving is due to differences in measurable characteristics or socioeconomic variables in the model. The observable characteristics explain 117.1% and 142.8% of the total gender gap in formal savings when the value of omega is 1 and 0, respectively. The gender gap in formal saving is widened by the socioeconomic variables in the model. Besides, the formal saving gender gap is attributed to differences in effort between males and females, which explains about 121.4% of the gap. As shown in Table , there are no advantages to males and disadvantages to females, which explains the gender gap in formal saving in Ethiopia during the period under investigation.
The results in Table reveal that the gender gap in formal account holding is explained by differences in socioeconomic variables in the model, which explain 74.4% and 85.7% of the total gap when the value of omega is 1 and 0, respectively. The estimate of observable characteristics is positive and statistically significant, meaning that it adds to the worsening of the gender gap in formal account ownership. The coefficient of gender differences in the effort of having a formal account is positive and statistically significant, implying that it widens the gender gap in formal account holding. It explains 80.7% of the total gender gap in formal account holding. However, advantages to males and disadvantages to females do not explain the gender gap in formal account holding.
The difference in coefficient explains 90.3% of gender disparity in formal borrowing when Omega is 1 and 80.1% when Omega is 0. The gender gap in formal borrowing is attributed to the difference in effort, which explains 31.8% of the total gender gap, while the shares of advantages to males and the disadvantages to females are 41% and 27.2% percent, respectively. The gender gap in the possibility of coming up with an emergency fund is explained by the difference in the coefficient that explains 76.8% of the total gender gap when the omega is 0. Besides, differences in effort and advantages to males explain 46.3% and 32.3%, respectively, of the total gender gap in the possibility of coming up with an emergency fund. Determinants of the gender gap in debit card holding depend on the value of the weighting matrix. More specifically, the gender gap in debit card holding is attributed to differences in observable characteristics which explains 54.2% when the value of weighting matric is 1, while the interaction effect explains 35.3% of the total gender gap in debit card holding given a weighting matrix value of 0. The only difference in effort explains the gender gap in debit card holding.
4.2.3. Detailed decomposition estimates
Table shows the contributions of each socioeconomic variable to the financial inclusion gender gap between males and females in Ethiopia during the study period. It outlines the results of the decomposition, as well as the contribution of each socioeconomic variable in the model to the overall gender gap in financial inclusion. The first section of the table shows the decomposition results, which are consistent with those in Table . The total financial inclusion gender disparity is decomposed into gaps due to variations in socioeconomic characteristics and differences in coefficients for each indicator of financial inclusion.
About 142% of the gender gap in formal saving is explained by differences in characteristics/predictors between the two groups, while differences in coefficient account for −42.8% of the observed gender disparity in formal saving. The result reveals that differences in observable characteristics in the model widen the gender gap in formal saving, while differences in coefficients narrow it down. The leading factor that explains the gender gap in formal saving is age, followed by age square, which explains about 99.9% and −77.4%, respectively, of the total disparity. This shows that age exacerbates the gender gap in formal saving while it narrows down the gap after a certain threshold is attained. Employment status explains about 69.3% of the total gender gap in formal savings, while the share of mobile ownership is 40.3%. Both variables expand the gender gap in formal saving. Moreover, the within-economy household income quintile, except for income quintile 3 (middle 20%), determines the gender gap informal saving in Ethiopia. Income quintile 1 (the poorest 20%) reduces the gender gap in formal saving, while income 2 (second 20%) and income quintile 4 (fourth 20%) widen the gap. Endowment gaps account for just 42.3 % of the overall gender differential in formal savings, with age differences (100%) and employment status (74.3%) accounting for the majority of the gap.
Differences in socioeconomic characteristics account for 85.7% of the gender disparity in formal account holding at formal financial institutions, while differences in coefficients account for 14.3 %. Except for national ID ownership, all socioeconomic variables in the model explain the gender gap in formal account ownership. Of the explained gap, differences in age and age squared between males and females explain a major proportion of the gender gap in formal account holding. Age explains 55.5%, while the share of age squared is −48.1% in explaining the gender gap in formal account holding. Age squared and income quintile 1 (poorest 20%) narrow down the formal account holding gender gap, while the rest of the income quintiles, education, employment, and mobile ownership, increase the gap.
Differences in socioeconomic characteristics between males and females, which accounts for 48.6% of the overall gender gap, explain the gender disparity in the ability to come up with an emergency fund. The larger proportions are explained by age (62.9%), age squared (−64.5%), and employment status (44.9%). While age and employment status are expected to widen the gap in explaining the observed gender disparity in the possibility of coming up with an emergency fund, gender squared narrows it down. Furthermore, the gender gap in the possibility of coming up with an emergency fund is narrowed in the first income quintile, while it is widened in the second-, third-, and fourth-income quintiles.
5. Discussion
The study examined determinants of the financial inclusion gender gap in Ethiopia using the Findex 2017 database. The result reveals that there is a statistically significant financial inclusion gender gap though the magnitude of the gap differs across the indicator used. The highest gap is observed in formal account holding, which amounts to 16.3%, followed by borrowing from a formal financial institution with a gender gap of 9.8%. The least gender gap is reported in debit card holding. Except in formal borrowing, the socioeconomic variables in the model explain the total financial inclusion gender gap. Formal borrowing is poorly explained by the variables in the model, which implies that the disparity might be better explained by cultural and asset-holding-related variables. Interpretation of the findings and discussion of their implications are presented below.
Income and asset accumulation are positively associated with age. Until a certain age threshold is achieved, an increase in age leads to more income and asset accumulation which in turn increases a propensity to save, own a formal account, borrow from a formal financial institution, and raise emergency funds. This implies that individuals are more financially included at a younger age when they are economically active. There was a statistically significant age difference between men and women in Ethiopia during the study period. This indicates that age disparity among men and women is one of the socioeconomic factors that determine the financial inclusion gender gap in Ethiopia. However, age has a nonlinear effect on financial inclusion, with a statistically significant positive coefficient for age and a significantly significant negative for age squared. Hence older people are more likely to be financially included, but after a certain age, the probability of being financially included diminishes. This finding is similar to the findings of Zins and Weill (Citation2016), Fungacova and Weill (Citation2015), Mndolwa and Alhassan (Citation2020), Ghosh and Chaudhury (Citation2019), Bekele (Citation2022), Mossie (Citation2022) and Demirguc-Kunt et al. (Citation2018). The reason why older individuals are less included financially is that they might be reluctant to use formal financial services as they are not used to using them. This finding is in line with the Life‐Cycle Hypothesis, which posits that wealth follows an inverted U-shape whereby it is positive during an individual’s active working age and negative when they are retired (Zins & Weill, Citation2016). From the supply side, financial institutions might put less effort into attracting older clients (Fungacova & Weill, Citation2015; Soumaré et al., Citation2016).
Income is a crucial determinant of the financial inclusion of individuals. According to the relative income hypothesis, income savings are positively related to the level of income. The implication is that poor individuals have less propensity to save due to lack of money; therefore, they are less likely to have a formal account and less possible to come up with an emergency fund. The richest individuals are highly likely to be financially included as compared to the poorest ones (Allen et al., Citation2016; Shihadeh, Citation2018). Higher-income and accumulated wealth are often key prerequisites in accessing formal credit as banks assess borrowers’ ability to pay back predominantly through applicants’ income levels and to generate wealth. Therefore, it is plausible to expect a direct link between income and wealth levels and access to formal credit (Kara et al., Citation2021). Finally, it is argued that the impact of income and wealth on accessing formal credit is more detrimental for female household heads, and gender differences in formal credit markets manifest themselves indirectly through income (Klapper & Singer, Citation2015). Overall, the empirical evidence shows that individuals with lower income and less wealth are disadvantaged in credit markets (Fungacova & Weill, Citation2015; Kara et al., Citation2021). According to Findex 2017 data, about 85.1% of the surveyed households who reported not having a formal account attributed it to a lack of money. However, women in Ethiopia are less included financially compared to their male counterparts due to income disparity. Women earn less income and accumulate less wealth because key economic resources like land are owned and controlled by men. In line with this, Balasubramanian et al. (Citation2018) argue that women who own land are more likely to have formal accounts and formal savings.
The finding of this study reveals that education determines the financial inclusion gender gap in Ethiopia, particularly formal account holding and formal borrowing. The result shows that individuals who completed secondary education are more likely to be included financially as compared to those who are primary school complete. This implies that women are less included financially compared to their male counterparts due to the statistically significant gender gap in education. This corroborates the findings of Shihadeh (Citation2018), Zins and Weill (Citation2016), Lyons et al. (Citation2019), Morsy (Citation2020), and Sharif et al. (Citation2022). Educated individuals are expected to make more informed decisions throughout their life. It is argued that more educational attainment is also strongly linked to better financial decision-making and greater wealth (Kara et al., Citation2021). Education is associated with financial literacy, which is more relevant to financial decision-making. Accordingly, more educated individuals can understand financial products and concepts, financial risks and opportunities, and make informed choices regarding financial products. Further, educated people are more likely to have a job, which leads to more chances of having an account and, thus, more chances to save and borrow. In addition, it is easier for highly educated people to deal with documents, read or understand financial rules and regulations and use financial services (Shihadeh, Citation2018).
Furthermore, in Ethiopia, the gender gap in employment status is reflected in financial inclusion. The gender gap in employment widens the gender gap in formal saving, formal account ownership, and the possibility of coming up with an emergency fund. This implies that educated individuals are more likely to be financially included. This finding is in line with the findings of Bekele (Citation2022), Mndolwa and Alhassan (Citation2020), and Morsy (Citation2020). Due to insufficient access to training and education, Ethiopian women are less likely to be employed, more likely to be underemployed, and more likely to receive lower wages from their employment (Mat, Citation2020). According to the World Economic Forum (Citation2019), only 77 % of women were employed, while 88 % of men were employed. Furthermore, young Ethiopian women are less economically active than their male counterparts. According to Mat (Citation2020) and World Bank (Citation2017), young women in Ethiopia who are not in employment, education, or training (NEET) are higher than young men (15.1% for women vs. 5.7% for men). The World Economic Forum (World Economic Forum, Citation2019) report shows that Ethiopian gender parity in education is low (85%, with the rank of 140th) because human capital investment is insufficient and penalizes women more than men, which resulted in a low literacy rate for women (44% of women vs. 59% of men). Low employment, low skills, and education of women resulted in a low earning rate. According to Mat (Citation2020) and the World Bank (Citation2017), young women in Ethiopia are more likely than young men to be unemployed, educated, or trained (NEET) (15.1 % for women vs. 5.7 % for men). According to the World Economic Forum (WEF, 2020), Ethiopian gender disparity in education is poor (85 %, ranking 140th) due to inadequate human capital spending, which penalizes women more than men, resulting in a low literacy rate for women (44 % of women vs. 59 % of men). Women’s poor earning rates are due to a lack of employment, expertise, and education.
Our finding reveals that mobile ownership is a determining factor for the financial inclusion gender gap in Ethiopia, which corroborates with Alfred et al. (Citation2017) and Bekele (Citation2022). According to Demirgüç-Kunt et al. (Citation2022), progress in access to finance depends on the mobile phone much more than the banking system. The variable ownership of smartphones has a significant positive impact on the dependent variable, the autonomy of women in decision-making, at a 5% confidence interval. This result shows that the ownership of a smartphone by a woman can ensure and enhance a woman’s autonomy in the decision-making of household finance, thus empowering her to make her own decisions (Kulkarni & Ghosh, Citation2021). In this regard, the gender disparity in mobile ownership means that women are less likely to be financially included compared to men.
We find that the lower use of formal financial services and digital financial services by females can be explained by gender disparity in age, education, and employment status. This implies that the observed financial inclusion gender disparity is attributed to females being less educated and less employed than men. Our finding corroborates with the findings of Aterido et al. (Citation2013) and Asuming et al. (Citation2019) for Sub-Saharan Africa, Zins and Weill (Citation2016), Botric and Broz (Citation2017) for Central and Eastern Europe, Mndolwa and Alhassan (Citation2020) for Tanzania, and Ghosh and Chaudhury (Citation2019) for India. Out of the total financial inclusion gender gap mentioned above, the proportion explained by differences in socioeconomic characteristics (age, income, education, and employment) differs across the financial inclusion indicators.
6. Limitations of the study
Empirical evidence shows that the socioeconomic characteristics of individuals are not the only determinant of the financial inclusion gender gap. For instance, Demirgüç-Kunt et al. (Citation2013) claim that legal discrimination against women precludes them from being included financially. Even though Ethiopia has made substantive and remarkable progress in ensuring that its laws recognize the equal rights of women, there are still laws with provisions that discriminate against women. Besides, some norms and cultures discourage women from asset accumulation and control over key economic resources like land. Anyangwe et al. (Citation2022), Liaqat et al. (Citation2022), and Lu et al. (Citation2021) argue that culture influences financial inclusion. Since the Findex 2017 database does not address the aforementioned variables, the current study incorporates legal and cultural variables in the financial inclusion gender gap model. We believe that including these variables gives full insight into the determinants of the financial inclusion gender gap in Ethiopia.
7. Conclusions and policy implications
Even though the overall financial inclusion in Ethiopia has improved over time for both men and women, the gender gap has remained unchanged. Women’s exclusion from financial products and services has ramifications for financial inclusion as a whole, as well as women’s political, economic, and social participation. To meet long-term growth goals, the gender gap in financial inclusion must be narrowed down. Using various econometric decomposition techniques, the primary goal of this study is to estimate the financial inclusion gender gap and analyze factors determining it using the World Bank’s Global Findex 2017 database.
Results from the Fairlie decomposition technique show that there is a statistically significant financial inclusion gender gap in Ethiopia. Women are less likely to be financially included in all indicators used in this study. The socioeconomic variables included in the model explain 142.8%, 85.7%, 52.2%, and 48.6% of the total gender gap in having formal savings, formal accounts, debit cards, and emergency funds, respectively. Age, employment status, income, mobile ownership, and educational level are among the socioeconomic variables that explain the financial inclusion gender disparity in Ethiopia across all indicators.
We break down the total financial inclusion gender disparity into differences in socioeconomic variables between men and women, differences in returns to these variables, and disparity in the interaction of the two. Differences in socioeconomic variables between men and women explain 142.8% and 85.7% of the total gender gap in having formal savings and formal accounts, respectively, are explained by the included socioeconomic variables, including age, income, employment, and mobile ownership. The socioeconomic variables in the model poorly explain the gender gap in formal borrowing. Rather, it is attributed to differences in returns to these socioeconomic variables, which implies discrimination against women in the credit market. This is further confirmed by the fact that 43.3% and 39.8% of the total gender gap in formal borrowing is explained by advantages to men and disadvantages to women, respectively, while the disparity in commitment explains 16.9%. Gender disparity in socioeconomic variables and their return explain the gender gap in an emergency fund. On the other hand, the gender gap in debit card holding is attributed to differences in the interaction effect between socioeconomic variables and their returns. In conclusion, women in Ethiopia are less likely to be financially included compared to men because they are less educated, less employed, poor, and have less access to technology like a mobile phone.
The results confirm that there is a financial inclusion gender gap in favor of men in Ethiopia in all financial indicators used in this study. We investigated the degree to which socioeconomic variables explain the gender disparity in financial inclusion in Ethiopia using a detailed decomposition method. We found that the gender disparity in financial inclusion in Ethiopia is primarily due to variations in included measurable socio-economic variables rather than differences in coefficients, and the variables that play a key role, in this case, are the respondents’ age, employment status, and educational level. In conclusion, females in Ethiopia are unable to use financial services due to their lack of education, employment, age, and earnings/income. However, socio-economic variables explain less than half of the gender gap in financial inclusion in most indicators. Therefore, future studies need to focus on the impact of socioeconomic, sociocultural, institutional, legal, and regulatory factors on the financial inclusion gender gap in Ethiopia. Policies to improve access to financial services for women need to address the growing gender gap in employment, education, and earnings/income. Among most indicators, socio-economic factors account for less than half of the gender disparity in financial inclusion.
The following policy recommendations are derived from the analysis. Closing the financial inclusion gender gap requires bridging the employment gender gap by enhancing females’ level of employment through improving their skills and creating job opportunities for women. Improving the employment level of women enables them to generate income which in turn will enhance their propensity to save, own a bank account, borrow from formal financial institutions, hold a debit card, and raise emergency funds. Ethiopia needs to narrow down the gender gap in education by promoting females’ level of education to close the financial inclusion gender gap. Increasing females’ educational status will reduce their likelihood of being excluded from financial services. Moreover, providing financial education to women will enhance their financial literacy, which will enhance their participation in financial services. For recommendations to be feasible, Ethiopia needs to apply gender mainstreaming in all sectors of its economy since gender gaps in each sector may be reflected in the financial sector gender gap. Therefore, applying a gender lens to reduce the gender gap in each sector of the economy has the potential to close the gender gap in financial inclusion in the country.
Availability of data and material
The data and material supporting the conclusions of this article would be provided upon reasonable request.
Authors’ contributions
SKH conceived the idea and contributed to conceptualization, data curation, analysis, methodology, and original draft preparation. DTT contributed to the introduction and edited the whole manuscript. Both authors read and approved the final manuscript.
Code availability
The Stata code used to undertake the analysis of this article would be provided upon reasonable request.
Disclosure statement
No potential conflict of interest was reported by the author(s).
Additional information
Funding
References
- Abdu, E., Adem, M., & McMillan, D. (2021). Determinants of financial inclusion in Afar Region: Evidence from selected woredas Determinants of financial inclusion in Afar Region: Evidence from selected woredas. Cogent Economics & Finance, 9(1). https://doi.org/10.1080/23322039.2021.1920149
- Abel, S., Mutandwa, L., & Roux, P. L. (2018). A review of determinants of financial inclusion. International Journal of Economics and Financial Issues, 8(3), 1–26. http://www.econjournals.com/index.php/ijefi/article/view/5458
- Alfred, S., Maureen, T., & Were, M. (2017). Mobile financial services and financial inclusion : Is it a boon for savings mobilization ?. Journal of Advanced Research, 7(1), 29–35. https://doi.org/10.1016/j.rdf.2017.01.001
- Allen, F., Demirguc-Kunt, A., Klapper, L., Soledad, M., Peria, M., & Allen, F. (2016). The foundations of financial inclusion: Understanding ownership and use of formal accounts. Journal of Financial Intermediation, 27, 27(1–30. https://doi.org/10.1016/j.jfi.2015.12.003
- Anyangwe, T., Vanroose, A., & Fanta, A. (2022). Determinants of financial inclusion does culture matter.Pdf. Cogent Economics & Finance, 10(1). https://doi.org/10.1080/23322039.2022.2073656
- Aslan, G., Deléchat, C., Newiak, M., & Yang, F. (2017). Inequality in Financial Inclusion and Income Inequality (WP/17/236; IMF Working Pape).
- Asuming, P. O., Osei-Agyei, L. G., & Mohammed, J. I. (2019). Financial inclusion in Sub-Saharan Africa: Recent trends and determinants. Journal of African Business, 20(1), 112–134. https://doi.org/10.1080/15228916.2018.1484209
- Aterido, R., Beck, T., & Iacovone, L. (2013). Access to finance in Sub-Saharan Africa: Is there a gender gap? World Development, 47, 102–120. https://doi.org/10.1016/j.worlddev.2013.02.013
- Balana, B., Mekonnen, D., Haile, B., Hagos, F., Yimam, S., & Ringler, C. (2020). Are Smallholder Farmers Credit Constrained? Evidence on Demand and Supply Constraints of Credit in Ethiopia and Tanzania. (No. 01974; IFPRI Discussion Paper, Issue November).
- Balasubramanian, S. A., Kuppusamy, T., & Natarajan, T. (2018). Financial inclusion and land ownership status of women. International Journal of Development Issues, 18(1), 51–69. https://doi.org/10.1108/IJDI-06-2018-0091
- Bauer, T. K., & Sinning, M. (2008). An extension of the Blinder-Oaxaca decomposition to nonlinear models. AStA Advances in Statistical Analysis, 92(2), 197–206. https://doi.org/10.1007/s10182-008-0056-3
- Bekele, W. D. (2022). Determinants of financial inclusion: A comparative study of Kenya and Ethiopia. Journal of African Business, 23(2), 301–319. https://doi.org/10.1080/15228916.2022.2078938
- Benería, L., Berik, G., & Floro, M. S. (2015). Gender, development, and globalization: Economics as if all people mattered (2nd ed.). Routledge.
- Beriso, B. S. (2021). Determinants of economic achievement for women entrepreneurs in Ethiopia. Journal of Innovation and Entrepreneurship, 10(5). https://doi.org/10.1186/s13731-020-00141-5
- Blinder, A. S. (1973). Wage discrimination: Reduced form and structural estimates. The Journal of Human Resources, 8(4), 436. https://doi.org/10.2307/144855
- Botric, V., & Broz, T. (2017). Gender differences in financial inclusion: Central and South Eastern Europe. South-Eastern Europe Journal of Economics, 15(2), 209–227.
- Boukhatem, J. (2016). Assessing the direct effect of financial development on poverty reduction in a panel of low- and middle-income countries. Research in International Business and Finance, 37, 214–230. https://doi.org/10.1016/j.ribaf.2015.11.008
- Brief. (2018). Financial Inclusion Support Framework (FISF). In World Bank. http://www.worldbank.org/en/topic/financialinclusion/brief/financial-inclusion-support-framework
- Buehren, N., Goldstein, M. P., Paula, L. G., Hailemicheal, A. H., Kirkwood, D. J., Paskov, P. R., Poulin, M., Raja, C., & Tarter, A. M. (2019). Ethiopia gender diagnostic report: Priorities for promoting equity. https://www.google.com/search?client=firefox-b-d&q=Ethiopia+gender+diagnostic+report%3A+Priorities+for+promoting+equity
- Daymont, T. N., & Andrisani, P. J. (1984). Job preferences, college major, and the gender gap in earnings. The Journal of Human Resources, 19(3), 408. https://doi.org/10.2307/145880
- Deléchat, C., Newiak, M., Xu, R., Yang, F., & Aslan, G. What is driving women ’ s financial inclusion across countries ?. (2018). IMF Working Papers, 18(38), 1. WP/18/38. https://doi.org/10.5089/9781484344460.001/
- Demirgüç-Kunt, A., Klapper, L., & Singer, D. (2013). Financial inclusion and legal discrimination against women: Evidence from developing countries. World Bank Policy Research Working Paper (No. 6416; Issue April). https://doi.org/10.1596/1813-9450-6416
- Demirgüç-Kunt, A., Klapper, L., Singer, D., & Ansar, S. (2022). The global 2021 findex database: Financial inclusion, digital payments, and resilience in the age of COVID-19. The World Bank.
- Demirguc-Kunt, A., Klapper, L., Singer, D., Ansar, S., & Hess, J. (2018). The global findex database 2017: Measuring financial inclusion and the fintech revolution. In The global findex database 2017: Measuring financial inclusion and the fintech revolution. The World Bank. https://doi.org/10.1596/978-1-4648-1259-0
- Desalegn, G., & Yemataw, G. (2017). Financial Inclusion in Ethiopia: Using LSMS (Ethiopia Socioeconomic Survey) Data. Ethiopian Journal of Economics, 26(2), 31–58. https://www.ajol.info/index.php/eje/article/viewFile/177737/167090
- Ethiopia’s Ministry of Agriculture and Natural Resources, UN Women, UNDP, & UN Environment. (2018). The Cost of the Gender Gap in Agricultural Productivity in Ethiopia. UN Women.
- Fairlie, R. W. (1999). The absence of the African-American owned business: An analysis of the dynamics of self-employment. Journal of Labor Economics, 17(1), 80–108. https://doi.org/10.1086/209914
- Fairlie, R. W. (2005). An extension of the Blinder-Oaxaca decomposition technique to logit and probit models. Journal of Economic and Social Measurement, 30(4). https://doi.org/10.3233/jem-2005-0259
- Fairlie, R. W. (2006). An Extension of the Blinder-Oaxaca Decomposition Technique to Logit and Probit Models. IZA Discussion Paper (No. 1917). https://doi.org/10.2139/ssrn.497302
- Fairlie, R. W. (2017). Addressing path dependence and incorporating sample weights in the nonlinear blinder-oaxaca decomposition technique for logit, probit and other nonlinear models. Stanford Institute for Economic Policy Research Discussion Paper (Issue 17). https://siepr.stanford.edu/sites/default/files/publications/17-013.pdf
- Fareed, F., Gabriel, M., Lenain, P., & Reynaud, J. (2017). Financial inclusion and women entrepreneurship. Organización para la Cooperación y Desarrollo económico (OECD), 1411(1411). https://doi.org/10.1787/2fbd0f35-en
- Fungacova, Z., & Weill, L. (2015). Understanding financial inclusion in China. China Economic Review, 34, 196–206. https://doi.org/10.1016/j.chieco.2014.12.004
- Ghosh, C., & Chaudhury, R. H. (2019). Gender Gap in case of financial inclusion: An empirical analysis in Indian Context. Economics Bulletin, 39(4), 2615–2630.
- Hajilee, M., Stringer, D. Y., & Metghalchi, M. (2017). Financial market inclusion, shadow economy and economic growth: New evidence from emerging economies. The Quarterly Review of Economics & Finance, 66, 149–158. https://doi.org/10.1016/j.qref.2017.07.015
- Jann, B. (2008). The Blinder-Oaxaca decomposition for linear regression models. Stata Journal, 8(4), 453–479. https://doi.org/10.1177/1536867x0800800401
- Kara, A., Zhou, H., & Zhou, Y. (2021). Achieving the United Nations ’ sustainable development goals through financial inclusion: A systematic literature review of access to finance across the globe. International Review of Financial Analysis, 77, 101833. https://doi.org/10.1016/j.irfa.2021.101833
- Klapper, L., & Singer, D. (2015). The role of informal financial services in Africa. Journal of African Economies, 24, i12–i31. https://doi.org/10.1093/jae/eju027
- Komicha, H. H., & Öhlmer, B. (2007). International conference on african influence of credit constraint on technical efficiency of farm households in Southeastern Ethiopia. International conference on African development archives. https://scholarworks.wmich.edu/africancenter_icad_archive/125
- Kuada, J. (2019). Financial inclusion and the sustainable development goals. In Extending financial Inclusion in Africa (pp. 259–277). Elsevier Inc. https://doi.org/10.1016/B978-0-12-814164-9.00012-8
- Kulkarni, L., & Ghosh, A. (2021). Gender disparity in the digitalization of financial services: Challenges and promises for women ’ s financial inclusion in India. Gender, Technology and Development, 25(2), 233–250. https://doi.org/10.1080/09718524.2021.1911022
- Lakew, T. B., & Azadi, H. (2020). Financial inclusion in ethiopia: Is it on the right track? International Journal of Financial Studies, 8(2), 1–13. https://doi.org/10.3390/ijfs8020028
- Li, L. (2018). Financial inclusion and poverty: The role of relative income. China Economic Review, 52(1), 165–191. https://doi.org/10.1016/j.chieco.2018.07.006
- Liaqat, I., Gao, Y., Rehman, F. U., Lakner, Z., & Olah, J. (2022). National culture and financial inclusion: Evidence from belt and road economies. Sustainability, 14(6), 3405–3421. https://doi.org/10.3390/su14063405
- Lu, W., Niu, G., & Zhou, Y. (2021). Individualism and financial inclusion. Journal of Economic Behavior and Organization, 183, 268–288. https://doi.org/10.1016/j.jebo.2021.01.008
- Lyons, A. C., Kass-Hanna, J., Lyons, A. C., & Kass-Hanna, J. (2019). Financial inclusion, financial literacy and economically vulnerable populations in the middle east and north africa financial inclusion, financial literacy and economically vulnerable populations in the Middle East and North Africa. Emerging Markets Finance and Trade, 1–40. https://doi.org/10.2139/ssrn.3189563
- Mat, M. L. (2020). Nexus skills/jobs: Assessment of youth Skills Development/Jobs Nexus in Ethiopia. The Netherlands Enterprise Agency. https://www.google.com/url?sa=t&rct=j&q=&esrc=s&source=web&cd=&ved=2ahUKEwjmy-Wika6AAxUQRvEDHbEkBuMQFnoECBAQAQ&url=https%3A%2F%2Fwww.rvo.nl%2Fsites%2Fdefault%2Ffiles%2F2020%2F03%2Fassessment-of-youth-skills-development-jobs-nexus-in-Ethiopia.pdf&usg=AOvVaw0ZB2jNNJLkaMIIYU43HgEw&opi=89978449
- Mndolwa, F. D., & Alhassan, A. L. (2020). Gender disparities in financial inclusion: Insights from Tanzania. African Development Review, 32(4), 578–590. https://doi.org/10.1111/1467-8268.12462
- Morsy, H. (2020). Access to finance – Mind the gender gap. The Quarterly Review of Economics & Finance, 78, 12–21. https://doi.org/10.1016/j.qref.2020.02.005
- Mossie, W. A. (2022). Understanding Financial inclusion in Ethiopia. Cogent Economics & Finance, 10(1). https://doi.org/10.1080/23322039.2022.2071385
- Mukasa, A. N., Simpasa, A. M., & Salami, A. O. (2017). Credit constraints and farm productivity: Micro-level evidence from smallholder farmers in Ethiopia. Working Paper Series (No. 247; Working Paper). www.afdb.org/
- Nanziri, E. L. (2016). Financial inclusion And Welfare in South Africa: Is there a Gender Gap? Journal of African Development, 18(2), 109–134. https://doi.org/10.5325/jafrideve.18.2.0109
- Ndoya, H. H., & Tsala, C. O. (2021). What drive gender gap in financial inclusion? Evidence from Cameroon. African Development Review, 33(4), 674–687. https://doi.org/10.1111/1467-8268.12608
- Neaime, S., & Gaysset, I. (2018). Financial inclusion and stability in MENA: Evidence from poverty. Finance Research Letters, 24(May 2017), 230–237. https://doi.org/10.1016/j.frl.2017.09.007
- Neumark, D. (1988). Employers’ discriminatory behavior and the estimation of wage discrimination. The Journal of Human Resources, 23(3), 279–295. https://www.jstor.org/stable/145830
- Oaxaca, R. (1973). Male-female wage differentials in urban labor markets. International Economic Review, 14(3), 693. https://doi.org/10.2307/2525981
- Oaxaca, R. L., & Ransom, M. R. (1988). Searching for the effect of unionism on the wages of union and nonunion workers. Journal of Labor Research, 9(2), 139–148. https://doi.org/10.1007/BF02685237
- Oaxaca, R. L., & Ransom, M. R. (1994). On discrimination and the decomposition of wage differentials. Journal of Econometrics, 61(1), 5–21. https://doi.org/10.1016/0304-4076(94)90074-4
- Ogunleye, T. S. (2017). Financial inclusion and the role of women in Nigeria. African Development Review, 29(2), 249–258. https://doi.org/10.1111/1467-8268.12254
- Omar, A., & Inaba, K. (2020). Does financial inclusion reduce poverty and income inequality in developing countries? A panel data analysis. Journal of Economic Structures, 9(37). https://doi.org/10.1186/s40008-020-00214-4
- Ozili, P. K. (2020). Theories of Financial inclusion ( pp. 89–115). https://doi.org/10.1108/978-1-80043-095-220201008
- Park, C., & Mercado, R. J. (2017). Financial inclusion, poverty, and income inequality. The Singapore Economic Review, 1–22. https://doi.org/10.1142/S0217590818410059
- Powers, D. A., Yoshioka, H., & Yun, M.-S.-S. (2011). Mvdcmp: Multivariate decomposition for nonlinear response models. The Stata Journal: Promoting Communications on Statistics and Stata, 11(4), 556–576. https://doi.org/10.1177/1536867x1201100404
- Schwiebert, J. (2015). A detailed decomposition for nonlinear econometric models. Journal of Economic Inequality, 13(1), 53–67. https://doi.org/10.1007/s10888-014-9291-x
- Sha’ban, M., Girardone, C., & Sarkisyan, A. (2019). Financial inclusion: Trends and determinants. In E. Gualandri, V. Venturelli, & A. Sclip (Eds.), Frontier topics in banking (pp. 119–136). Palgrave Macmillan.
- Sharif, S. P., Naghavi, N., Waheed, H., & Ehigiamusoe, K. U. (2022). The role of education in filling the gender gap in financial inclusion in low-income economies. International Journal of Emerging Markets. https://doi.org/10.1108/IJOEM-07-2021-0991
- Sharma, A., Sumita Kukreja, M., & Professor, A. (2013). An analytical study: Relevance of financial inclusion for developing nations. Research Inventy: International Journal of Engineering and Science Issn, 2(6), 2278–4721. Www.Researchinventy.com
- Shihadeh, F. H. (2018). How individual’s characteristics influence financial inclusion: Evidence from MENAP. International Journal of Islamic & Middle Eastern Finance & Management, 11(4), 553–574. https://doi.org/10.1108/IMEFM-06-2017-0153
- Singh, N. (2019, April). Financial inclusion: Concepts, issues and policies for India. SSRN Electronic Journal, I-35406-INC–1. https://doi.org/10.2139/ssrn.3307903
- Sinning, M., Hahn, M., & Bauer, T. K. (2008). The Blinder-Oaxaca decomposition for nonlinear regression models. Stata Journal, 8(4), 480–492. https://doi.org/10.1177/1536867x0800800402
- Soumaré, I., Tchana, F. T., & Kengne, T. M. (2016). Analysis of the determinants of financial inclusion in central and West Africa. Transnational Corporations Review, 8(4), 231–249. ISSN:, 6444. https://doi.org/10.1080/19186444.2016.1265763
- Sujlana, P., & Kiran, C. (2018). A study on status of financial inclusion in India. International Journal of Management Studies, 5(2(3)), 96. https://doi.org/10.18843/ijms/v5i2(3)/12
- Triki, T., & Faye, I. (2012). Financial Inclusion in Africa - Financial_Inclusion_in_Africa.Pdf. Policy Research Working Paper (No. 978-9938-882-19–3; Issue June). http://www.afdb.org/fileadmin/uploads/afdb/Documents/Project-and-Operations/Financial_Inclusion_in_Africa.pdf
- World Bank. (2017). Employment and jobs study in Ethiopia. https://openknowledge.worldbank.org/handle/10986/32093
- World Bank, & ONE. (2013). LevelLing the field: Improving opportunities for women farmers in Africa. 53(9). https://www.google.com/url?sa=t&rct=j&q=&esrc=s&source=web&cd=&cad=rja&uact=8&ved=2ahUKEwiCuZ_ClK6AAxXaRvEDHRBzALkQFnoECB4QAQ&url=https%3A%2F%2Fdocuments1.worldbank.org%2Fcurated%2Fen%2F579161468007198488%2Fpdf%2F860390WP0WB0ON0osure0date0March0180.pdf&usg=AOvVaw17NNucKfjkTNyAs-yOFeQm&opi=89978449
- World Economic Forum. (2019). Global gender gap report 2020: Insight report. http://www3.weforum.org/docs/WEF_GGGR_2020.pdf
- World Economic Forum. (2021). Global gender gap report 2021: Insight report. https://www.google.com/url?sa=t&rct=j&q=&esrc=s&source=web&cd=&ved=2ahUKEwiBm5r59MvxAhWFmFwKHUQECrM4ChAWMAR6BAgJEAM&url=http%3A%2F%2Fwww3.weforum.org%2Fdocs%2FWEF_GGGR_2021.pdf&usg=AOvVaw2ieXL1lL8q3kKL_h16xe9i
- Yun, M. S. (2004). Decomposing differences in the first moment. Economics Letters, 82(2), 275–280. https://doi.org/10.1016/j.econlet.2003.09.008
- Yun, M. S. (2005a). Hypothesis tests when decomposing differences in the first moment. Journal of Economic and Social Measurement, 30(4), 295–304. https://doi.org/10.3233/jem-2005-0257
- Yun, M. S. (2005b). A simple solution to the identification problem in detailed wage decompositions. Economic Inquiry, 43(4), 766–772. https://doi.org/10.1093/ei/cbi053
- Yun, M. S. (2008). Identification problem and detailed Oaxaca decomposition: A general solution and inference. Journal of Economic and Social Measurement, 33(1), 27–38. https://doi.org/10.3233/jem-2008-0296
- Zins, A., & Weill, L. (2016). The determinants of financial inclusion in Africa. Review of Development Finance, 6(1), 46–57. https://doi.org/10.1016/j.rdf.2016.05.001
Appendices
Table A1. Chi-square test of association between gender and discrete explanatory variables
Table A2. Chi-Square test of association between gender and dependent variables