
Abstract
Engaging public participation is critical for visual assessment, aligning with SDG 17’s emphasis on multi-stakeholder partnerships for sustainable development. Incorporating public partnerships in assessing the aesthetic values of historical landscapes is vital for successful preservation. A sound and scientifically tested visual assessment with indicators measuring emotional and psychological attachment to surroundings is needed to achieve this. This study aims to identify reliable indicators by testing public perception, thus resulting in nine indicators derived from aesthetic-based theories: mystery, coherence, legibility, openness, disturbance, complexity, naturalness, and diversity. We conducted an online closed-ended questionnaire survey with 126 respondents using five refined images from the historical city of Melaka, Malaysia that showcase unique urban landscape features. Participants rated the significance of the nine indicators based on their preferences and perceptions. Different Item Functioning (DIF) analysis was used to determine valid indicators. The results showed that stewardship emerged as the most preferable indicator among the public, indicating high preference. Despite demographic differences, the study identified stewardship and complexity as the most prominent indicators representing public perception and preference for historical landscapes. This could be reflected in their cultural expectations of the value of heritage. Consequently, stewardship is suggested as an effective and appropriate indicator for future visual assessments of historical landscapes.
Introduction
Historical landscape is classified by Russell and Plann (Citation1989) as an environment that demonstrates a significant value of outstanding culture and heritage. This value added by Nakarmi et al. (Citation2023) and Provins et al. (Citation2008) could be identified in the existing buildings and ruins, open green spaces, gardens, and natural settings, such as forests and monuments of the place. The landscape has benefitted humankind in many ways. It is a symbol of belief and identity (Rosley, Citation2013, Citation2019), tourism attraction (Rangel-Buitrago et al., Citation2012), culture (Yuen, Citation2006), and part of people’s association (Wells & Baldwin, Citation2012). It is the most valuable asset to humankind yet in fragile condition. One of the major threats is due to people’s activities, such as urbanisation. The process led to mass altering and modifying the landscape, destroying the elements and characters strongly associated with historic value.
However, there are growing concerns about destroying the historical landscape worldwide. People are more conscious and aware of any modification and demolition of the surroundings and tend to protect them as part of their social contribution. An efficient tool is adapting the visual aesthetic assessment to cater to people’s need to engage in preserving and conserving their environment. This assessment relies on human perception and preference in navigating the changes and modifying the surrounding landscape (Chen et al., Citation2009; Ode Sang et al., Citation2022). The process is strongly associated with people’s attachment, and people’s bond with the area. According to Xenakis et al. (Citation2012), people’s perception tends to link with the function of people’s emotions, leading to an aesthetical appreciation of the environment, whereby a large and growing body of research has been investigated by many researchers (e.g. Brown et al., Citation1986; Carlson, Citation2002; Coughlin et al., Citation1982; Kaplan et al., Citation1989; Medeiros et al., Citation2023; Ode Sang et al., Citation2022; Parsons & Daniel, Citation2002).
The aesthetic value in historical landscapes has been pivotal in shaping the concept of preservation and conservation, especially in urban heritage sites. In landscape and urban studies, the aesthetic values of settings, such as the composition of buildings in their environment, have contributed positively to the aesthetic motivation and experience in tourism activities (Zhou et al., Citation2023). Aesthetic value enhances townscapes and urban heritage images, influencing both the tangible and intangible values of a place, such as cultural activities and spaces (Ahmad Nia & Atun, Citation2016), the social value of the community (Nia, Citation2021), and architectural and landscape design (Cerasi, Citation2005; Ioannidis et al., Citation2022; Ng, Citation2020). Ng (Citation2020), for instance, noted that older buildings in urban settings hold significant value to people due to their distinctive character, harmonious design, and complementarity with the natural landscape, fostering a sense of familiarity within the local community and demonstrating a high degree of aesthetic value. Understanding and appreciating the artistic worth of historical landscapes involves considering both subjective and objective factors that contribute to the overall aesthetic perception.
Aesthetic perception is derived from how people perceive the environment in terms of satisfying their emotional attachment and how nature stimulates their sense of pleasure (Laurie, Citation1979). It is believed that Plato and Aristotle developed an appreciation of beauty and aesthetics a millennium ago. Both philosophers derived the aesthetic part of a human desire to live in proportion and order (Lothian, Citation1999). Therefore, aesthetic perception and landscape are considered to be the entities that bind people together psychologically. As stated by the European Landscape Convention (ELC) in 2002, the landscape is ‘the way people perceive the environment, the interaction and action of humans and the result of the action on the surrounding and the interaction of natural and/or human factors’. This indicates that people’s interactions and perceptions shape the landscape and contribute to distinctive characters and identities. The degree of beauty for certain characters and identities of the landscape then contribute to the emotional response known as aesthetic perception. In this case, the degree of beauty in the landscape could only be measured if there is a capable indicator that allows the emotions and psychology of people to be part of the process.
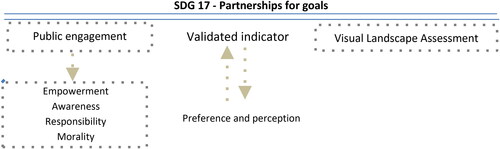
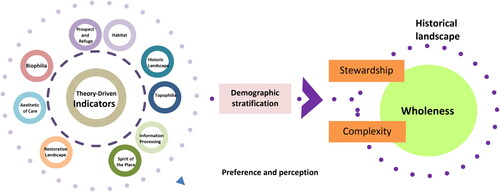
In visual landscape assessment, public engagement must be present to ensure their voices are acknowledged and contribute to the well-being of the people, landscape sustainability, and the success of a development (Enserink et al., Citation2022). This has been thoroughly addressed by SDG 17, which highlights ‘….multi-stakeholder partnerships as important vehicles for mobilising and sharing knowledge, expertise, technologies and financial resources to support the achievement of the sustainable development goals in all countries, …’. One is by empowering the public in any decision-making process, particularly in critical issues, such as heritage conservation and preservation strategies. Because of this, their insights are meaningful in understanding how landscape is connected to their daily life. In addition to empowerment, it activates awareness, responsibility, and moral development towards protecting their surroundings (Wang & Foley, Citation2023). The conceptual relationship between the establishment of visual landscape assessment and SDG 17 is shown in .
Figure 1. The theory-driven indicators.
Indicator of aesthetic perception
An indicator can be defined as a ‘variable used to indicate a state of a system; typically a measured property used as a surrogate for other attributes and conditions…’. (Leitão & Ahern, Citation2002). In visual aesthetic assessment, a set list of indicators is a benchmark used to measure emotional attachment and psychology (Bockstaller & Girardin, Citation2003), changes in the landscape (Dramstad et al., Citation2002), and seeking the quality of the landscape (Lothian, Citation1999). Thus, it is the assessment’s fundamental aspect and requires validation to ensure the assessment’s sound and success. It has been a trend in many related studies to adapt and implement the existing indicators in specific research. However, as debated by many other researchers, the exercises seem insufficient and relevant to the recent research. Fry et al. (Citation2009) and Tveit et al. (Citation2006) addressed that the process led to unreliable, inconsistent, and non-precise indicators due to a lack of underpinning concepts and related theories to support the outcome. On top of that is the lack of public engagement in projecting democracy in decision-making (Hagemann et al., Citation2020).
In this case, researchers, such as Girardin et al. (Citation1999) proposed that the process should begin with validating the relevant indicators derived from existing theories and hypotheses strongly associated with human perception and emotional attachment. Numerous studies by several researchers (e.g. Hedblom et al., Citation2020; Rosley, Citation2013; Rosley et al., Citation2013) in investigating the validated indicators of human perception have suggested some related aesthetic theories that are relevant to be adapted in the study. These indicators, known as theory-based driven indicators, investigate how people behave, respond, and perceive their environment concerning their emotional and psychological attributes. Thus, this will decrease the misleading and biased interpretations due to people’s capability and understanding of the subjects. As Rosley et al. (Citation2013) coined, aesthetic appreciation requires precise indicators to measure the complexity of actual landscape conditions.
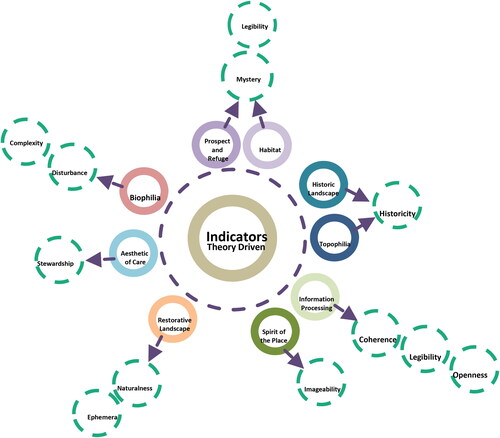
above represents 11 indicators that visualise the meaning and association of how people perceive their environment, derived from various theories discussing the interaction between people and place. Many researchers (e.g. Dramstad et al., Citation2002; Fry et al., Citation2009; Ode Sang & Tveit, Citation2012; Ode et al., Citation2008; Tveit et al., Citation2006) have suggested that indicators, such as naturalness, ephemera, imageability, coherence, legibility, openness, historicity, mystery, complexity, disturbance, and stewardship are common in visualising landscape characteristics. However, these indicators must accurately capture the real meaning of the aesthetic values embedded in the essence of the landscape settings (Bockstaller & Girardin, Citation2003). Therefore, the study employed a list of indicators proposed by Rosley (Citation2013), which was used to evaluate the visual quality of historic landscapes. These indicators were derived based on metadata analysis, delving into existing guidelines, previous related studies, and assessments for reviewing and comparing the relevance of the indicators while assessing the visual quality of a historic landscape. The selected indicators comprise diversity, complexity, coherence, disturbance, stewardship, legibility, naturalness, openness, and mystery.
Figure 2. The theory-driven indicators modified from Ode et al. (Citation2010).
Landscape variation, also known as diversity, tends to be similar to complexity. However, according to Rosley (Citation2013), diversity emphasises the physical arrangement of the landscape, arousing people’s excitement and pleasure. Stamps (Citation2002) found that the diversity of landscape attributes, such as pattern, order, and variety, elicits a higher degree of affection from people towards the environment. Therefore, diversity refers to the physical variation of cultural and ecological features that have existed in a particular location over time, including land cover types, habitats, and cultural features present across different historical periods. Research indicates that historical landscape components remain vital for current species diversity, suggesting that historical data should be considered in conservation planning and management to prevent ongoing loss of diversity. This understanding includes the number of landscape areas per element, spatial organisation of landscape attributes, diversity of land cover, and shape and size distribution indices. The structural diversity of a landscape, shaped by historical events, human interventions, and ecological processes, leads to complexity.
While diversity deals with several components, complexity delves into heterogeneous components co-existing in multiple interactions through evolutionary adaptation to become emergent properties in particular landscapes. Hence, each historical landscape is associated with the presence of diverse, interconnected components within a system. Kaplan et al. (Citation1989) suggested that complexity triggers the sense of exploration in human perception, seeking pleasure and beauty in the environment. Conversely, Ode et al. (Citation2008) describe complexity as an indicator of three dimensions—distribution, spatial organisation, and variation in shapes and patterns of the landscape. Landscape complexity assessment is often linked to the richness and variety of the landscape, influenced by historical evolution and human impact. Landscape complexity can be measured by examining structural aspects, such as habitat richness, land cover types, and fragmentation (Kellert, Citation1996; Stamps, Citation2004). This structural complexity is shaped by historical factors like human activities, land use changes, and ecological succession over time, contributing to the cultural and historical significance of the area. For instance, human settlements, historical landmarks, and traditional land use practices can add to the landscape’s overall complexity. In essence, complexity relates to the richness and diversity of attributes that make the landscape appealing and pleasant.
The combination of diversity and complexity in design, resulting in a harmonious projection commonly known as coherence. In historical landscapes, coherence implies similarity or harmony among different elements. It reflects the degree of consistency or alignment among various landscape components, like soil patterns, land use intensity, or cultural and ecological features. Coherence measures the integrated nature of the landscape, indicating how its elements fit together or complement each other. This concept is crucial in assessing historical landscapes’ changing character, offering insights into relationships and harmonies over time. Numerous studies (e.g. Karasov et al., Citation2020; Kuper, Citation2017; Qi et al., Citation2023; Sharafatmandrad & Khosravi Mashizi, Citation2021; Stamps, Citation2004; Weinberger et al., Citation2021) have identified a strong association between coherence and complexity. Coherence reflects landscape arrangement unity (Stamps, Citation2004) and structured composition (Herzog & Leverich, Citation2003) and includes repetition in colour and texture (Herzog & Bryce, Citation2007). In landscape perception, coherence represents a relationship between land use and natural attributes that ‘hang together’ as one entity.
Disturbance indicates alterations leading to imbalanced landscape composition. Tveit et al. (Citation2006) describe disturbance as significant intrusions affecting the area temporarily or permanently, diminishing its unique character. High disturbances might arise from human activities like mining, deforestation, and pollution, which shape individual populations’ structures and whole ecosystems’ character. Disturbances can alter spatial patterning and relationships between landscape elements, impacting coherence and diversity (Huang et al., Citation2021). Consequently, disturbance leads to insights about heterogeneity, scale, and thresholds, catalysing new paradigms in historical landscape investigation. A historical landscape cannot be considered stable if public participation is neglected, treating users as actors rather than contributors to preserving and maintaining particular areas’ quality. Areas characterised by specific time depth and historical landscape paths become significant historical landscapes.
Stewardship represents the ideal concept of a landscape’s well-being (Tveit et al., Citation2006), neatness, and upkeep (Davies & Santo-Tomás Muro, Citation2023; García-Martín et al., Citation2018; Ode Sang & Tveit, Citation2012). The visual attractiveness stimulated by stewardship has been found to foster people’s emotional and physical well-being due to its restorative association. Gottwald and Stedman (Citation2020) have elaborated stewardship into three dimensions: place characteristics, personal characteristics, and place meaning. Pimoljinda and Siriprasertchok (Citation2017) explained that stewardship in place characteristics have led to active participation among the local community in instilling their sense of belonging and protecting a place or landscape. Stedman et al. (Citation2007) coined this action as an emergence of social construction to protect the landscape and its meaning to the people. Personal characteristics, on the other hand, involve the motivation of individuals to safeguard the landscape’s well-being as their main interest. The sense of stewardship is closely associated with sociodemographic and psychological attributes (Gottwald & Stedman, Citation2020). Rosley et al. (Citation2013) explained that factors, such as education and income backgrounds depict high levels of awareness toward environmental issues and concern for safeguarding the landscape. Stewardship value also increases people’s attachment to a place. People prefer to associate themselves with well-organised places, as it represents their pride and helps elevate the community’s image psychologically. Ioannidis et al. (Citation2022) identified that the trend of geotagged aesthetic landscape photographs on social platforms and web applications manifests personal experience and effort to associate with a particular place. This people-place association reflects a strong relationship between place meaning and environmental stewardship (Scannell & Gifford, Citation2010), a sense of belonging (Solehin et al., Citation2014), and motivation to maintain the landscape in good condition (Bennett et al., Citation2018), and is also affected by cultural values and norms of a place (Li & Nassauer, Citation2020).
Herzog and Leverich (Citation2003) defined legibility as the ease of movement provided by distinctive landmarks as part of wayfinding in the built environment. It measures the degree of visual accessibility in the built environment. Kaplan et al. (Citation1989) identified legibility as one of four domain indicators crucial in assessing the aesthetic aspect of the environment due to its ability to stimulate cognitive and emotional engagement. For example, a large town park functions as a hub for activities due to its characteristics and qualities, which include legibility, enabling inhabitants to readily identify it as a destination for leisure and recreation. Connectivity provided by tree-lined reserves and streets facilitates movement and provides direction, offering a seamless transition to additional small green infrastructures like community pocket spaces. An investigation in the Malaysian context by Yap et al. (Citation2007) determined that crucial parameters for the effective design of green infrastructure include safety, comfort, impact on stress levels, aesthetic appeal, significance, health benefits, and environmental quality. Additionally, in a Western context, a seminal study by Tibbalds (Citation2001) suggests that diverse uses, human scale, consideration for place, humility, freedom of movement, and legibility characterise liveable towns and cities.
Naturalness portrays pristine wilderness and landscapes with minimal human modification and alteration. Investigating changes in high ecological settings, such as forests and woods, is a vital indicator. It has been widely used in studies associated with ecological preference (Groot & Born, Citation2003; Purcell & Lamb, Citation2006), rural management (Natori & Chenoweth, Citation2008; Suckall et al., Citation2009), forest and woodland management (Rotherham, Citation2007; Tyrväinen et al., Citation2007), and perceiving greenery in urban environments (Bjerke et al., Citation2006). Clayton (Citation2003) proposed that naturalness enhances one’s self-concept and place attachment, as humans tend to associate with the natural environment due to intrinsic value. This association, known as environmental identity or pro-environmental behaviour (Scannell & Gifford, Citation2010), has shown that natural settings and elements enhance the visual continuity of landscape settings within urban areas (Liu et al., Citation2023; Ma et al., Citation2021; Qi et al., Citation2023), thus enhancing diversity and people’s experiences (Chen et al., Citation2017; Wang et al., Citation2023). With rapid urbanisation and emerging environmental issues, naturalness via green urban infrastructures, including green linkages, urban parks and forests, green walls, and other types of green spaces, increases a healthy environment and visual attractiveness. A small touch of naturalness can attract people due to biophilic attachment (Solehin et al., Citation2014).
The relationship between humans and the landscape has endured for a significant period. According to Appleton’s Theory of Prospect and Refuge in 1975, humans have an innate tendency to form emotional connections with their environment, regardless of location. The theory posits that humans are inherently connected to the natural world and consistently strive for environmental comfort for survival and psychological well-being (Nasar et al., Citation1983). It explained the visual and environmental characteristics in terms of people’s perceptions of foregrounding, hiding, and escape (Zhu et al., Citation2023). This is where the ideas of both mystery and openness in visual quality are derived from. Prospect represents the concept of openness, which describes a high level of visibility and expansive space (Akpınar, Citation2021; Grahn & Stigsdotter, Citation2010), or in other words, the attributes of foregrounding. This indicator is seen as a variable to investigate inquisitiveness and curiosity in experiencing uncertain landscape conditions. El-Metwally et al. (Citation2021) suggested that prospect, presented by openness, symbolises visually a high level of safety and arouses a sense of pleasure in landscape design. A vista, for instance, provides an extensive line of sight that extends in a perspective manner and culminates in a focal point, with defined boundaries on either side, transitioning from the idea of openness for safety to an aesthetic function. In fact, openness gives a sense of direction as people are alerted to their wayfinding destination due to unrestricted visibility, promising a sense of security and aesthetic pleasure in emotionally perceiving their environment (Hami & Abdi, Citation2021).
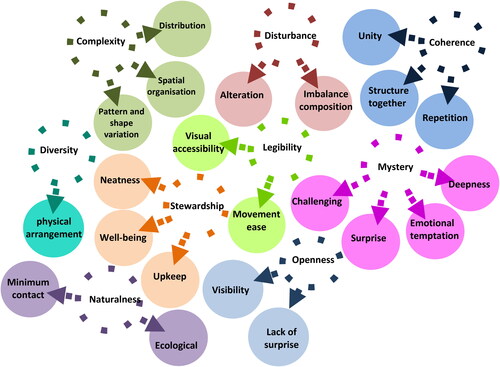
Refuge, on the contrary, represents the concept of a safe and enclosed environment. Initially, it was proposed to depict a safe spot for early human civilisation to hide from danger and unpredictable threats (Grahn & Stigsdotter, Citation2010; Rosley, Citation2013). Over time, refuge has evolved into a new dimension, emphasising people’s pleasure in the environment from an aesthetic perspective, as well as emotional and physical restorativeness (Akpınar, Citation2021; Asim et al., Citation2023). Hence, mystery is projected as an element of refuge due to its function in arousing psychological and aesthetic feelings, offering an inviting emotional temptation (Stamps, Citation2007), full of surprise (Nasar & Cubukcu, Citation2011), and a degree of depth (Stamps, Citation2004) in landscape arrangements. Mystery has been agreed upon as the most appropriate indicator for perceiving landscape scenes’ dynamic and static aspects. Nonetheless, many studies (Akpınar, Citation2021; Asim et al., Citation2023; El-Metwally et al., Citation2021; Hudson, Citation1993; Solehin et al., Citation2014) have concluded that mystery and openness are significant indicators as both complement one another in demonstrating positive approach behaviours and improving emotional regulation in people, strongly emphasising biophilic attachments. The entire concept of these indicators is summarised in .
Figure 3. The keyword composition of the indicators.
Validation process of indicators
The validation process of indicators requires a systematic methodology. As discussed by many researchers, the process needs to be able to produce indicators that are relevant, proven scientifically, practical, pragmatic, accessible, understandable, and most of all, reliable (Hak et al., Citation2012; Ode Sang et al., Citation2022). Therefore, the indicators must be inclusive and represent the same meaning despite the differences due to various people’s interpretations of the landscape.
Case study: Melaka, the historical city of Malaysia
Melaka is renowned for its thriving tourism sector. According to the Local Plan of Melaka City Council 2035, tourist arrivals in Melaka are expected to grow in the next five years, thus contributing to changes in landscape patterns, particularly in the Melaka Tengah District. This district is the most densely populated area in Melaka and is considered the tourism hub for both Melaka and Malaysia. Historically, along with Penang, a northern island state in the Malaysian peninsula, Melaka was designated as a World Heritage site by UNESCO on 7 July 2008. The UNESCO site includes the heart of Bandar Hilir’s old district area and its periphery, known for its outstanding landscape character, both in terms of intangible and tangible elements. The striking red of Stadthuys, a historic Dutch administration complex, A’ Famosa fort and remnants, the oldest Portuguese fort in Southeast Asia, and the 19th-century Chinese shophouses along the Melaka River are important landmarks of the city. These buildings are among the oldest surviving heritage structures in Melaka, despite the city having been colonised by various powers, such as the Portuguese, Dutch, British, and Japanese, before gaining independence in 1957 along with other states of Malaysia. Today, these buildings are considered some of the most important landmarks in Melaka’s tourism industry.
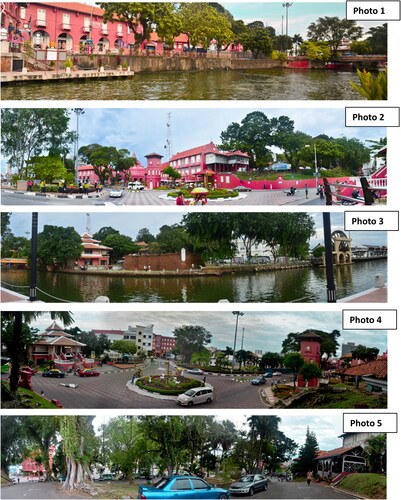
Photo sampling selection
This stage aimed to identify the most appropriate images for the actual survey. A photo-based interview or questionnaire is an effective method of exploring the meaning and value of a particular subject (Steen Jacobsen, Citation2007). A study by Jerrentrup and Nnanna (Citation2023) looking into social identity coined that photo-elicitation effectively engages people from different demographic backgrounds as it enables people to express their ideas and values easily. Initially, 15 images were proposed as photo sampling. The images were in the panoramic view of 120 degrees, which aimed to capture the surrounding environment (Nüsser, Citation2001), eye-level position (Ryan, Citation2002) from the scenic routes (Brush et al., Citation2000; Jaal & Abdullah, Citation2012; Kearney et al., Citation2008) located in the city of Melaka.
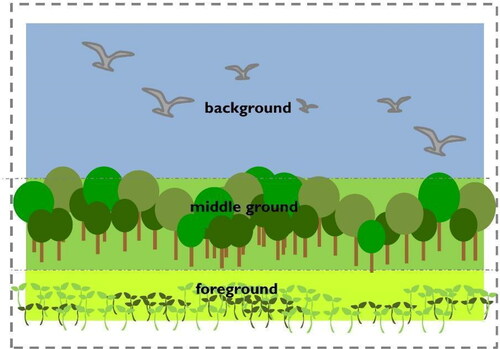
Furthermore, the photo strictly adhered to the proposed technique modified by Rosley (Citation2013) while capturing the essence of the historical landscapes. Aspects, such as waterbodies, buildings, and urban landscapes were included in the sampling images despite lengthy debates on biases (Herzog & Barnes, Citation1999; Kaplan & Kaplan, Citation1989; Litton, Citation1972; Ulrich, Citation1981, Citation1983) of these elements towards people’s preferences and perceptions. The images were designated to fulfill the different levels of scenes in the photographing technique, consisting of foreground, middle ground, and background, as shown in .
Figure 4. The composition of the photo-setting adopted from Rosley (Citation2013).
A group of experts and non-experts were invited to sort out the appropriate images for the actual survey. The experts comprised PhD candidates in the architecture and landscape architecture programme at Universiti Teknologi Malaysia. Each was selected due to their design background and knowledge in evaluating the visual and landscape interpretation. On the other hand, the non-experts were chosen randomly from non-design background schools, such as the Faculty of Social Science and the Faculty of Education within Universiti Teknologi Malaysia. Surprisingly, five redundant images of the case studies were selected by both parties and organised as the sample for the landscape visual assessment. The selected photos are shown in . These sampling photos were taken at the core of historic Melaka’s UNESCO zone, consisting of the Stadthuys building and remnants of A’ Famosa fort, the oldest Portuguese fort in Southeast Asia, overlooking the Melaka River. These outstanding buildings and their surrounding landscapes have been identified as the most appropriate for the photo sampling selection in the visual aesthetic assessment. Some of the reasons include their contrasting visual appearance and location along the scenic routes proposed by the local authority (Local Plan of Melaka City Council 2035).
Figure 5. A compilation images of areas in the historical district of Melaka comprised of the Stadhuys buildings (Photos 1, 2, 4, and 5), the Melaka River (Photos 1 and 3) and the remnants of A’ Famosa Fort (Photo 3).
During the pilot study, a select group of respondents was chosen based on two main criteria: individuals with a design background and familiarity with the location of the case study, Melaka. A snowball sampling technique was employed to obtain the right sampling population for the pilot study. In total, 80 respondents, who were university students majoring in design, were engaged at this stage. Additionally, the respondents confirmed that they had visited the city of Melaka, ensuring a sense of familiarity and experience with the site. Adopting a similar technique by Arriaza et al. (Citation2004) and integrating the online survey questionnaire was expected to be convenient and make it easy to reach the targeted respondents. The respondents were requested to respond to the degree of preference based on the Likert rating assessment. The group must rank the tested indicator based on the images, starting from the lowest degree −1 to the highest degree −5. It is common for any perceptual study to implement this technique due to its efficiency and ability to define the different meanings of the hierarchy represented by the small-scale range (Acar & Sakıcı, Citation2008; Kearney et al., Citation2008). This process is followed up by investigating the reliability and validity of the respondents and images used in the study.
Reliability and separation test
One of the common issues many researchers face is to predict the correct interval between the rating range to ensure the process is soundly proven (Rosley et al., Citation2013). Part of it, the constructed questionnaire, must address the intent of the tested indicators without any misleading and bias due to differences in people’s preferences and perception process. Coined by Donnelly et al. (Citation2007), the item, in this case, the images should represent the variety of the proposed indicators and vice versa. Therefore, the first stage of the validation process is to ensure that the ratings, images, indicators, and respondents can perform and contribute to the sound and success of the process.
Based on the Item Response Theory and Representational Measurement Theory, the Rasch Model analysis was used to perform the analysis as part of the study. In this stage, the validity and reliability of the indicators and items, i.e. images, are examined. During the analysis, the reliability value of the item and respondent should be between the range of 0.6–0.8 before the tested indicators are classified as reliable for further investigation. A part of it is the value of the separation index, which indicates the capability of respondents to differentiate the indicator’s meaning and function in the assessment.
displays the values of item reliability (IR), item separation (IS), person reliability (PR), and person separation (PS). The values for image 1 are IR: 0.95, IS: 4.5, PR: 0.77, and PS: 2.19. For image 2, the values are IR: 0.97, IS: 5.31, PR: 0.77, and PS: 2.42. Image 3 has values of IR: 0.97, IS: 5.67, PR: 0.71, and PS: 2.24. For image 4, the values are IR: 0.87, IS: 4.44, PR: 0.79, and PS: 2.93. Lastly, image 5 has values of IR: 0.97, IS: 6.08, PR: 0.73, and PS: 2.65. Based on these results, the item and person reliability values for all the images range between 0.87 and 0.97 for item reliability and 0.71 and 0.79 for person reliability. These values indicate that the item, in this case, the photo, is relevant and adequately assessed by the respondents. Additionally, the person reliability results suggest that the respondents’ responses to the image selection are reliable.
Table 1. Reliability and separation index.
Apart from this, the values of item separation managed to indicate a range between 4.44 and 6.08. The results explained that the selection of images could be divided into at least four different strata of difficulties, which were adequate for the study. As referred to Rosley et al. (Citation2013), the values of either item and person separation should at least not be lower than two to produce sufficient validation process results. In this case, the lowest value of person separation is 2.19, while the highest is 2.93, higher than the minimum required value. The results obtained from this analysis show that the respondents can be clustered into two different capabilities in measuring the provided indicators. The group of respondents detected either being able to identify the meaning and significance of the indicator or failing to do so.
Point measure correlation and Z standard test
In this part, the values of point measure correlation were referred to ensure the list of adapted indicators that can represent the essence of the meaning of the historical landscape theme. As Fry et al. (Citation2009) mentioned, the adapted indicators must be relevant and accurate to measure the different characters and attributes affecting human perception. As indicated further by Solehin et al. (Citation2014), the selection required wise consideration, and the respondents should assess the competence of the produced indicators.
shows the correlation of disturbance. It was found to show inconsistency during the analysis process. This stage provided insight into detecting the bias indicator. However, the indicator is only considered biased and irrelevant if it fulfills two fundamental aspects. First, the Point measured correlation (PTMEA-COR) value indicates negative values. Secondly, the Z standard value exceeds the proposed range, between −2 to +2. However, it will be an exception if the indicator responds to one of the criteria. It will be considered a relevant indicator and must be kept for the actual study. Regarding the values in the Point measured correlation (PTMEA-COR), indicator disturbance was reported to have negative values, respectively −0.03 for c1e_Hdis and −0.01 for c2e_Hdis. In addition, all the Z standard values of the indicator exceed or are lower than the acceptable range. For instance, the value of c5e_Hdis is 5.8, the highest Z standard value, while the lowest is 2.1, represented by c3e_Hdis. It can thus be suggested that the indicator disturbance should be dropped from the actual survey. The inconsistency of the indicator in the study may be due to biases and is difficult to be assessed by the respondents.
Table 2. Point measured correlation and Z standard.
In the end, only nine indicators were kept for the actual survey. These indicators are predicted to represent people’s perceptions in assessing the historical landscape. The study is then followed by indicating the significant level of the indicators by engaging public participation. As Alberts (Citation2007) mentioned, empowering the public as decision-makers increases people’s trust and awareness, resolves conflicts of interest, incorporates local values, and improves the quality of decisions. In perceptual study, public engagement is regarded to be the most crucial aspect to be considered. Their participation has significantly influenced the outcome of studies due to intrinsic values inherited by the locals. As addressed by Howley (Citation2011) and Howley et al. (Citation2012), the perception of the environment is attached to emotional aspects, such as a sense of belonging and familiarity. Thus, these values contributed to the distinctiveness of the findings.
In highlighting the issue, this study aims to provide insight into how the proposed indicators are validated through the perception and preference of public interpretation and judgments. A series of online surveys were conducted with 126 respondents. The respondents were strictly selected from those who had visited the case study to ensure their familiarity and attachment. This ensures that the study’s outcome can provide a better understanding of people’s attachment in the perception process. The respondents were requested to answer the two parts of the designated improvement questionnaire adapted from the pilot test. The first part focused on demographic factors, such as age, ethnicity, occupation, and educational level. This section aimed to investigate the similarity and dissimilarity in public perception. As discussed by many researchers (Bauer et al., Citation2009; Groot & Born, Citation2003; Paquette & Domon, Citation2001, Citation2003; Villagra Islas & Gastón Vergara, Citation2012), human attributes, known as a demographic factor, affect the people perception process. Therefore, a stratification random sampling was used to divide the respondents into different strata to represent the various factors in demographic background.
On the contrary, the second part investigated the significance level of the selected eight indicators endorsed as consistency and efficiency during the pilot test. A similar technique was adopted by Rosley et al. (Citation2013), whereby the respondents needed to rate the significance level of each indicator based on five different images portrayed in the different settings in the city of Melaka.
Part 1—Demographic stratification results
Based on the results in % (79 people) of the respondents are qualified with degree certification, and respondents with certificate level are the lowest group, comprising 7.1% (9 people). This is followed by respondents with an age range of between 21 and 25, making up the most significant population with a total of 72%, equivalent to 72 respondents. In the gender aspect, the study gathered quite a good sampling proportion. The male respondents outnumbered female respondents by an extra six respondents. The male respondents comprise 52.4% (66 people), while the rest, 47.6%, are females. On the other hand, Malays are the highest sampling population, consisting of 77% (97 people) of the total respondents. The lowest, comprising 6.4% (8 people), were classified as Others. In terms of familiarity, 56.3% (71 people) of the population resided in Melaka between 1 and 6 years. Only 6.5% of the total population is detected to reside in Melaka for fewer than seven years. Only a few respondents indicated they are natives of Melaka (7.1%, nine people), while most are considered non-natives of Melaka (92.9%, 117 people). Approximately half of the population reside in urban areas (57.1%, 72 people), while 23.8% (30 people) live in an urban fringe, and the rest, 19.1% (24 people), are settled in rural areas.
Table 3. Demographic profile of respondents.
Part 2—Indicator selection and perception results
Part two discussed the results of the perception process by the respondents. In this part, a correlation study between the demographic factors and the perception is being investigated. The process was run by a Different Item Functioning Analysis (DIF) to support the needs of multiple analyses. In DIF analysis, the indicators can be examined and divided into extremely difficult or easy for the respondents in rating the significance level of the indicators (Rosley et al., Citation2013; Solehin et al., Citation2014). In this case, the values of the t-test assist in detecting the discriminate indicators that cause response inconsistency from certain groups.
present the results of the DIF analysis and the values of the t-test. In this case, the acceptable value range for an indicator to be classified as valid and reliable is between −2.00 and +2.00. The negative value of the indicator in the DIF analysis indicates that the indicator is difficult to be assessed by the respondents and vice versa. However, the values should not exceed +2.00 or lower than −2.00, demonstrating that the indicator is biased and irrelevant to be measured in the study.
Table 4. The compilation results of the t-test.
Based on the results, the indicators can be divided into three groups based on the respondents’ perception: extremely easy to assess and extremely hard to evaluate, and lastly, indicators that different groups of people can consider. The results revealed that some indicators are classified as relatively easy and unable to measure people’s perceptions. For instance, a correlation between: (i) Mystery and Chinese ethnicity (2.31); (ii) Mystery and Indian ethnicity (2.24); (iii) Legibility and the age range of 31–35 (2.78); (iv) Coherence and the age range of 21–25 (2.43); (v) Openness and the age range of 41 and above (2.80); (vi) Legibility and non-native (3.65); (vii) Legibility and the period range of 1–5 months (4.57); (viii) Naturalness and non-native (2.14); (ix) and lastly, Diversity and Diploma certification (2.42) are the bias indicators due to their values exceeding the value of 2. In other words, these indicators tend to be loosely important for these demographic factors as they are unreliable.
On the other hand, correlation results of some indicators, such as the correlation between (i) Legibility and the age range of 26–30 (−2.20); (ii) Coherence and Indian ethnicity (−2.36); (iii) Coherence and Others ethnicity (−2.31); (iv) Mystery and non-native (−2.57); (v) Mystery and age range of 6–12 months (−2.36); and (vi) lastly, the correlation between Legibility and age range of 1–6 years (−2.09) are considered as indicators that are extremely hard to be assessed by the respondents. Their values, which are lower than negative 2, indicate that the indicators are inconsistent in representing people’s perceptions.
Interestingly, despite differences in demographic factors, indicators, such as Stewardship and Complexity represent people’s perception of the historical landscape. None of their t-test values exceed or fall below the acceptance range value. The findings suggest that respondents value the historical landscape for its ability to evoke delightful feelings and pride, indicating that all areas are perceived as valuable, satisfying, irreplaceable, and attractive in various ways. Interest and appreciation in the historic environment, enriched by diverse and distinct elements of built properties, naturalness, and openness, can evoke strong feelings of fascination. Awareness and a sense of stewardship arise from physical and psychological enlightenment gained through observation and participation in historical settings. Each site is valued by respondents on multiple levels as a source of history and heritage, restorative and renewal experiences, economic value, and knowledge and awareness, potentially leading to a strong feeling of protection. These findings imply that stewardship is considered a critical indicator in visualising historical and cultural landscapes. These results support Nassauer’s (Citation1992) argument that this indicator extends beyond the neatness and care of the physical landscape. Hence, stewardship implies a collective sense of responsibility to ensure that landscape resources are cared for, protected, and well-managed (Davies & Santo-Tomás Muro, Citation2023). According to Ode Sang et al. (Citation2022), low emotional engagement with a place results in a lack of active maintenance of the surrounding environment. This research suggests that the sense of stewardship could be projected through perceptual processes, as it relates to one’s inner self-esteem and self-efficacy, responding to the place’s distinctiveness and continuity, relevant to the image of the place (Rosley, Citation2019). In reference to the sampling images, it can be assumed that the transformation of the selected place from a backwater zone into a tourism hub contributed to the rise of the stewardship indicator in this study. This is reflected in the demographic sampling, emphasising the need for respondents to be familiar with the place. Therefore, the transformation of the place from worse to better conditions allows them to compare the level of stewardship before and after.
On the other hand, complexity aroused people’s perceptions due to several factors. This could be attributed to the richness and diversity of landscape features and elements projected by the sampling images. This study supports Shen et al. (Citation2023) findings that complexity is highly preferred in many landscapes, as it is often associated with design intensity and arrangement. Referring to the photo sampling, the well-organised landscape and artificial elements stimulated the visual exploration of the participants. The striking colour of the buildings pleasantly blended with the urban landscape setting; hence, it is understandable to support the significance of this indicator during the assessment. Li and Sahari (Citation2022) argue that an urban area’s colours, street images, and architectural components exemplify the charm and character that shape the city’s identity. Proper and balanced design intensity promotes the highest level of pleasure and preference for complexity (Jiang et al., Citation2021). In this particular scenario, complexity and its associated variables, such as visual richness, diversity, and variation, have consistently emerged as significant aesthetic indicators in the urban environment. Indeed, they constitute an integral part of the comprehensive amalgamation of natural and constructed attributes within the historic city. The determination of these factors is contingent upon overall accessibility, permeability, and spatial continuity, primarily focused around the linear arrangement of streets, walkways, edges, and landmarks. This implies a historically significant landscape, conveyed through the naturalness of vegetation and the variety of built heritage. This assertion was corroborated by Tzoulas and James (Citation2010), who asserted that the design of natural and urban environments profoundly impacts the well-being and behaviour of users. It has the potential to augment urban dwellers’ experiential engagements with a city’s attributes and qualities, as well as the liveability of its fabric. Hence, this study suggests that both traits are frequently cited as crucial properties that contribute to the establishment of a strong sense of stewardship.
According to Simmel (Citation2007), ‘landscape’ denotes the unity of the components that harmoniously co-exist as a ‘wholeness’ despite their variances. Hence, complexity and stewardship are viewed as indicators representing the connectedness of objects, both artificial and natural, flowing as one identity. Thus this was projected by the provided photos. While discussing the historical landscape, the foundation of this setting is how landscape acts as a canvas that simply portrays people and place interaction in the environment without one being overpowered by other elements. Historical landscape is a composition of characters bonded together and does not work separately. Simmel (Citation2007) argues that the landscape contains a lot of values that grow and evolve concurrently with people’s actions that shape a place, both externally and internally.
From a visual quality perspective, as proposed in , the concept of wholeness in the landscape is crucial in reflecting the success of design quality in harmony with nature. Wholeness ultimately indicates that the design elements visually and materially belong to the setting, in this case, the historical landscape. The well-managed diversity, measured by complexity and stewardship, is highly regarded as a measure to ensure that the preservation and restoration of a historical landscape are well integrated and effective in projecting that the place operates aesthetically and physically as one entity.
Figure 6. Model of visual landscape assessment in the historical landscape.
The study also highlighted the presence of various spaces, such as squares, esplanades, and riversides, that serve as recreational areas. These spaces attract crowds who engage in activities like relaxation, jogging, football, and commerce. The attraction is largely due to the well-maintained architecture and abundant greenery surrounding the historic urban areas, creating a delightful and unique atmosphere. Located near the riverside and the sea, Melaka stands out from other historic urban settings. It offers a unique and diverse view, setting it apart from the monotony of other cities. The quality of openness or void is essential in shaping a city’s unique identity, as it influences the development of all other qualities/attributes mentioned above.
On the other hand, the indicator validation process based on people’s perceptions is one way to engage people’s involvement in decision-making. It allows experts to understand how the locals perceived their surroundings from their emotions, psychology, and preferences. Even though it is clear that everyone has his perception of the landscape, there are similarities in certain aspects that connect human beings. This has been highlighted in the Biophilia Theory. The similarity occurs due to biophilic instinct affiliated humans to nature, regardless of cultural boundaries, beliefs, society, demographic factors, and values. Therefore, the study’s findings manifested the role of biophilic in human perception. The indicators—Complexity and Stewardship—reflect the public’s similarity in deciding the prominent indicator to assess the historical landscape.
Conclusion
The study’s primary outcome is to predict the similarity of public perception toward different settings in the historical landscape. Results show that respondents tended to prefer Stewardship and Complexity as their preference in the historical landscape. Both offer different meanings in terms of psychological and emotional attachment. A further discussion by Ode et al. (Citation2008) and Ode Sang and Tveit (Citation2012) divided two main aspects that contributed to the formation of this indicator. Stewardship is being assessed from the level of nature management and the condition of man-made structures in the landscape. These cues concluded that stewardship is strongly associated with the landscape’s success in being cared for by humankind. It has been widely seen as a pivotal indicator of human preference and perception. The indicator represents the sense of safety and care (Kahn, Citation1997) and how a man treats the landscape well (Tveit et al., Citation2006).
Empowering people’s perception as part of visual assessment has been acknowledged by many researchers as a fundamental aspect of perception study. In many studies, public perception has been considered unique compared to the experts’ judgment. The public tends to be more sensitive and alert to the changes occurring in their surrounding areas. This has resulted from the attachment that bonds the public and their environment. The psychological and emotional aspects, such as place attachment, sense of belonging, and sense of familiarity are some examples that connect people to their place.
On the contrary, the experts’ perception processes are more or less affected by the theoretical knowledge and expertise with a lack of emotional bond. Therefore, the public perception should be considered as important as the experts and thus aligned to the propagation of SDG 17, emphasising the empowerment of stakeholders. As addressed by Negev (Citation2012) and Ode Sang et al. (Citation2022), the public today is well equipped with the knowledge to monitor the changes in their surroundings. Not surprisingly, it has been a trend for future development to integrate the public as part of the decision-making group due to this reason. Pomeroy and Douvere (Citation2008) identified that the involvement of the public in the decision-making process increases a better understanding of how the locals are addressing the essence aspect of the area, decreases the conflicts between the public and experts, and identifies the existing relationship between the local and nature, and towards sustainability development.
The reason behind the selection of complexity as the dominant indicator is its multitude of characteristics in describing the landscape. Some researchers associated complexity with the high degree of landscape arrangement diversity. However, according to Papadimitriou (Citation2010), complexity in the landscape may correspond to different meanings and approaches. It can lead to a memory of place engagement, non-linear interactions, behaviours, and landscape changes. In this case, complexity has been perceived by the public as a revival of the past and memory attachment due to the condition of the place. This has been discussed by Ogborn (Citation1996) on how people’s memory is affected by the historical condition of the place. The process occurs in people’s appreciation of the complexity exhibited in the aesthetical values embedded in a place. Thus, it can be concluded that both these indicators create a sense of wholeness in visual landscape assessment as the indicators consciously fastened all the elements that spread out in a place, in such way, pleasant from the eyes of the beholders. Thus, this study provides a theoretical framework for assessing a specific landscape theme, whereby the framework can infer another landscape assessment and visual qualities in seeking the validated indicators. Thus, we strongly emphasise the need for public perception as part of the process due to their distinctive values and attachments to perceiving the landscape.
Disclosure statement
No potential conflict of interest was reported by the author(s).
Additional information
Notes on contributors

Muhamad Solehin Fitry Rosley
Muhamad Solehin Fitry Rosley is a research fellow at the Institute of the Malay World and Civilization (ATMA), Universiti Kebangsaan Malaysia. His research interests are heritage landscape conservation and visualisation. Currently, he is attached to several university grants expanding into landscape visualisation via Augmented reality. At ATMA, his research team advocates technology to preserve and conserve Malaysia’s cultural heritage, especially in intangible heritage, such as local wisdom and knowledge.
Nor Zalina Harun
Nor Zalina Harun is a senior research fellow at the Institute of the Malay World and Civilization (ATMA), Universiti Kebangsaan Malaysia. Her research interests are urban regeneration, urban morphology, landscape and cultural heritage, and improving social well-being through landscape planning.
Janatun Naim Yusof
Janatun Naim Yusof is a senior lecturer at Landscape Architecture Program,Universiti Teknologi Malaysia. Her research interests are landscape planning, enviromental psychology and children in landscape studies.
Syumi Rafida Abdul Rahman
Syumi Rafida Abdul Rahman is a research officer at Agro-Tourism Development and Funds Management Programme, Development and Property Management Centre, Malaysian Agricultural Research and Development Institute (MARDI). Her research interests are empowering public engagement in preserving and conserving the cultural landscape and agro-tourism.
References
- Acar, C., & Sakıcı, Ç. (2008). Assessing landscape perception of urban rocky habitats. Building and Environment, 43(6), 1153–1170. https://doi.org/10.1016/j.buildenv.2006.02.026
- Ahmad Nia, H., & Atun, R. A. (2016). Aesthetic design thinking model for urban environments: A survey based on a review of the literature. Urban Design International, 21(3), 195–212. https://doi.org/10.1057/udi.2015.25
- Akpınar, A. (2021). How perceived sensory dimensions of urban green spaces are associated with teenagers’ perceived restoration, stress, and mental health? Landscape and Urban Planning, 214(July), 104185. https://doi.org/10.1016/j.landurbplan.2021.104185
- Alberts, D. J. (2007). Stakeholders or subject matter experts, who should be consulted? Energy Policy, 35(4), 2336–2346. https://doi.org/10.1016/j.enpol.2006.08.006
- Arriaza, M., Cañas-Ortega, J. F., Cañas-Madueño, J. A., & Ruiz-Aviles, P. (2004). Assessing the visual quality of rural landscapes. Landscape and Urban Planning, 69(1), 115–125. https://doi.org/10.1016/j.landurbplan.2003.10.029
- Asim, F., Chani, P. S., Shree, V., & Rai, S. (2023). Restoring the mind: A neuropsychological investigation of university campus built environment aspects for student well-being. Building and Environment, 244(September), 110810. https://doi.org/10.1016/j.buildenv.2023.110810
- Bauer, N., Wallner, A., & Hunziker, M. (2009). The change of European landscapes: Human-nature relationships, public attitudes towards rewilding, and the implications for landscape management in Switzerland. Journal of Environmental Management, 90(9), 2910–2920. https://doi.org/10.1016/j.jenvman.2008.01.021
- Bennett, N. J., Whitty, T. S., Finkbeiner, E., Pittman, J., Bassett, H., Gelcich, S., & Allison, E. H. (2018). Environmental stewardship: A conceptual review and analytical framework. Environmental Management, 61(4), 597–614. https://doi.org/10.1007/s00267-017-0993-2
- Bjerke, T., Østdahl, T., Thrane, C., & Strumse, E. (2006). Vegetation density of urban parks and perceived appropriateness for recreation. Urban Forestry & Urban Greening, 5(1), 35–44. https://doi.org/10.1016/j.ufug.2006.01.006
- Bockstaller, C., & Girardin, P. (2003). How to validate environmental indicators. Agricultural Systems, 76(2), 639–653. https://doi.org/10.1016/S0308-521X(02)00053-7
- Brown, T., Keane, T., & Kaplan, S. (1986). Aesthetics and management: Bridging the gap. Landscape and Urban Planning, 13, 1–10. https://doi.org/10.1016/0169-2046(86)90002-2
- Brush, R., Chenoweth, R. E., & Barman, T. (2000). Group differences in the enjoyability of driving through rural landscapes. Landscape and Urban Planning, 47(1–2), 39–45. https://doi.org/10.1016/S0169-2046(99)00073-0
- Carlson, A. (2002). Allen Carlson’s Aesthetics and the Environment (Routledge, 2000). Philosophy & Geography, 5(2), 213–234. https://doi.org/10.1080/10903770220152425
- Cerasi, M. (2005). The urban and architectural evolution of the Istanbul Divanyolu: Urban aesthetics and ideology in ottoman town building. Muqarnas Online, 22(1), 189–232. https://doi.org/10.1163/22118993-90000089
- Chen, B., Adimo, O. A., & Bao, Z. (2009). Assessment of aesthetic quality and multiple functions of urban green space from the users’ perspective: The case of Hangzhou Flower Garden, China. Landscape and Urban Planning, 93(1), 76–82. https://doi.org/10.1016/j.landurbplan.2009.06.001
- Chen, W. (2009). Decode the city: A methodological study responding to the new trend of city “re-image” Montreal as a case. School of Urban Planning McGill University Montreal.
- Chen, Y., Gu, W., Liu, T., Yuan, L., & Zeng, M. (2017). Increasing the use of urban greenways in developing countries: A case study on Wutong greenway in Shenzhen, China. International Journal of Environmental Research and Public Health, 14(6), 554. https://doi.org/10.3390/ijerph14060554
- Clayton, S. (2003). Environmental Identity: A Conceptual and an Operational Definition. https://doi.org/10.7551/mitpress/3644.003.0005
- Coughlin, R. E., Dunlap, R. E., Kaplan, R., Sims, W. R., Steinitz, C., & Vaux, H. (1982). Assessing aesthetic attributes in planning water resource projects. Environmental Impact Assessment Review, 3(4), 406–417. https://doi.org/10.1016/S0195-9255(82)80048-6
- Davies, C., & Santo-Tomás Muro, R. (2023). Stewardship and green infrastructure in England. Planning perspectives informed through an investigation of urban green infrastructure. Journal of Environmental Planning and Management, 1–26. https://doi.org/10.1080/09640568.2023.2197557
- Donnelly, A., Jones, M., O’Mahony, T., & Byrne, G. (2007). Selecting environmental indicator for use in strategic environmental assessment. Environmental Impact Assessment Review, 27(2), 161–175. https://doi.org/10.1016/j.eiar.2006.10.006
- Dramstad, W., Fjellstad, W., Strand, G.-H., Mathiesen, H., Engan, G., & Stokland, J. (2002). Development and implementation of the Norwegian monitoring programme for agricultural landscapes. Journal of Environmental Management, 64(1), 49–63. https://doi.org/10.1006/jema.2001.0503
- El-Metwally, Y., Khalifa, M., & Elshater, A. (2021). Quantitative study for applying prospect-refuge theory on perceived safety in Al-Azhar Park, Egypt. Ain Shams Engineering Journal, 12(4), 4247–4260. https://doi.org/10.1016/j.asej.2021.04.016
- Enserink, M., Etteger, R. V., Brink, A. V. D., & Stremke, S. (2022). To support or oppose renewable energy projects ? A systematic literature review on the factors influencing landscape design and social acceptance. Energy Research & Social Science, 91, 102740. https://doi.org/10.1016/j.erss.2022.102740
- Fry, G., Tveit, M. S., Ode, Å., & Velarde, M. D. (2009). The ecology of visual landscapes: Exploring the conceptual common ground of visual and ecological landscape indicators. Ecological Indicators, 9(5), 933–947. https://doi.org/10.1016/j.ecolind.2008.11.008
- García-Martín, M., Plieninger, T., & Bieling, C. (2018). Dimensions of landscape stewardship across Europe: Landscape values, place attachment, awareness, and personal responsibility. Sustainability, 10(1), 263. https://doi.org/10.3390/su10010263
- Girardin, P., Bockstaller, C., & Werf, H. V. d (1999). Indicators: tools to evaluate the environmental impacts of farming systems. Journal of Sustainable Agriculture, 13(4), 5–21. https://doi.org/10.1300/J064v13n04_03
- Gottwald, S., & Stedman, R. C. (2020). Preserving ones meaningful place or not? Understanding environmental stewardship behaviour in river landscapes. Landscape and Urban Planning, 198(February), 103778. https://doi.org/10.1016/j.landurbplan.2020.103778
- Grahn, P., & Stigsdotter, U. K. (2010). The relation between perceived sensory dimensions of urban green space and stress restoration. Landscape and Urban Planning, 94(3–4), 264–275. https://doi.org/10.1016/j.landurbplan.2009.10.012
- Groot, W. T. D., & Born, R. J. G. V. D. (2003). Visions of nature and landscape type preferences: An exploration in The Netherlands. Landscape and Urban Planning, 63(3), 127–138. https://doi.org/10.1016/S0169-2046(02)00184-6
- Hagemann, F. A., Randrup, T. B., & Sang, Å. O. (2020). Challenges to implementing the urban ecosystem service concept in green infrastructure planning: A view from practitioners in Swedish municipalities. Socio-Ecological Practice Research, 2(3), 283–296. https://doi.org/10.1007/s42532-020-00054-3
- Hak, T., Kovanda, J., & Weinzettel, J. (2012). A method to assess the relevance of sustainability indicators: Application to the indicator set of the Czech Republic’s sustainable development strategy. Ecological Indicators, 17, 46–57. https://doi.org/10.1016/j.ecolind.2011.04.034
- Hami, A., & Abdi, B. (2021). Students’ landscaping preferences for open spaces for their campus environment. Indoor and Built Environment, 30(1), 87–98. https://doi.org/10.1177/1420326X19887207
- Hedblom, M., Hedenås, H., Blicharska, M., Adler, S., Knez, I., Mikusiński, G., Svensson, J., Sandström, S., Sandström, P., & Wardle, D. A. (2020). Landscape perception: Linking physical monitoring data to perceived landscape properties. Landscape Research, 45(2), 179–192. https://doi.org/10.1080/01426397.2019.1611751
- Herzog, T. R., & Barnes, G. J. (1999). Tranquility and preference revisited. Journal of Environmental Psychology, 19(2), 171–181. https://doi.org/10.1006/jevp.1998.0109
- Herzog, T. R., & Bryce, A. G. (2007). Environment and behavior in within-forest settings. Environment: Science and Policy for Sustainable Development, 39(6), 779–796. https://doi.org/10.1177/0013916506298796
- Herzog, T. R., & Leverich, O. L. (2003). Searching for legibility. Environment and Behavior, 35(4), 459–477. https://doi.org/10.1177/0013916503251455
- Howley, P. (2011). Landscape aesthetics: Assessing the general publics’ preferences towards rural landscapes. Ecological Economics, 72, 161–169. https://doi.org/10.1016/j.ecolecon.2011.09.026
- Howley, P., Donoghue, C. O., & Hynes, S. (2012). Exploring public preferences for traditional farming landscapes. Landscape and Urban Planning, 104(1), 66–74. https://doi.org/10.1016/j.landurbplan.2011.09.006
- Huang, X., Wang, H., Shan, L., & Xiao, F. (2021). Constructing and optimising urban ecological network in the context of rapid urbanisation for improving landscape connectivity. Ecological Indicators, 132, 108319. https://doi.org/10.1016/j.ecolind.2021.108319
- Hudson, B. (1993). The view from the Verandah: Prospect, refuge and leisure. Australian Geographical Studies, 31(1), 70–78. https://doi.org/10.1111/j.1467-8470.1993.tb00652.x
- Ioannidis, R., Mamassis, N., Efstratiadis, A., & Koutsoyiannis, D. (2022). Reversing visibility analysis: Towards an accelerated a priori assessment of landscape impacts of renewable energy projects. Renewable and Sustainable Energy Reviews, 161, 112389. https://doi.org/10.1016/j.rser.2022.112389
- Jaal, Z., & Abdullah, J. (2012). User’s preferences of highway landscapes in Malaysia: A review and analysis of the literature. Procedia-Social and Behavioral Sciences, 36, 265–272. https://doi.org/10.1016/j.sbspro.2012.03.029
- Jerrentrup, M. T., & Nnanna, N. (2023). Symbolic representations social media and photography in Nigeria. Cogent Arts & Humanities, 10(1). https://doi.org/10.1080/23311983.2023.2190240
- Jiang, B., He, J., Chen, J., Larsen, L., & Wang, H. (2021). Perceived green at speed: A simulated driving experiment raises new questions for attention restoration theory and stress reduction theory. Environment and Behavior, 53(3), 296–335. https://doi.org/10.1177/0013916520947111
- Kahn, P. (1997). Developmental psychology and the biophilia hypothesis: Children’s affiliation with nature. Developmental Review, 17(1), 1–61. https://doi.org/10.1006/drev.1996.0430
- Kaplan, R., Kaplan, S., & Brown, T. (1989). Environmental preference: A comparison of four domains of predictors. Environment and Behavior, 21(5), 509–530. https://doi.org/10.1177/0013916589215001
- Kaplan, S., & Kaplan, R. (1989). The visual environment: Public participation in design and planning. Journal of Social Issues, 45(1), 59–86. https://doi.org/10.1111/j.1540-4560.1989.tb01533.x
- Karasov, O., Vieira, A. A. B., Külvik, M., & Chervanyov, I. (2020). Landscape coherence revisited: GIS-based mapping in relation to scenic values and preferences estimated with geolocated social media data. Ecological Indicators, 111, 105973. https://doi.org/10.1016/j.ecolind.2019.105973
- Kearney, A. R., Bradley, G. a., Petrich, C. H., Kaplan, R., Kaplan, S., & Simpson-Colebank, D. (2008). Public perception as support for scenic quality regulation in a nationally treasured landscape. Landscape and Urban Planning, 87(2), 117–128. https://doi.org/10.1016/j.landurbplan.2008.05.005
- Kellert, S. R. (1996). The value of life: Biological diversity and human society. Island Press.
- Kuper, R. (2017). Evaluations of landscape preference, complexity, and coherence for designed digital landscape models. Landscape and Urban Planning, 157, 407–421. https://doi.org/10.1016/j.landurbplan.2016.09.002
- Laurie, M. (1979). A history of aesthetic conservation in California. Landscape Planning, 6(1), 1–49. https://doi.org/10.1016/0304-3924(79)90002-9
- Leitão, A. B., & Ahern, J. (2002). Applying landscape ecological concepts and metrics in sustainable landscape planning. Landscape and Urban Planning, 59(2), 65–93. https://doi.org/10.1016/S0169-2046(02)00005-1
- Li, J., & Nassauer, J. I. (2020). Cues to care: A systematic analytical review. Landscape and Urban Planning, 201, 103821. https://doi.org/10.1016/j.landurbplan.2020.103821
- Li, Y., & Sahari, F. (2022). The application of regional culture in urban public space design. Cogent Arts & Humanities, 9(1). https://doi.org/10.1080/23311983.2022.2116773
- Litton, R. B. (Ed.). (1972). Aesthetic dimensions of the landscape. John Hopkins University Press.
- Liu, W., Hu, X., Song, Z., & Yuan, X. (2023). Identifying the integrated visual characteristics of greenway landscape: A focus on human perception. Sustainable Cities and Society, 99(September), 104937. https://doi.org/10.1016/j.scs.2023.104937
- Lothian, A. (1999). Landscape and the philosophy of aesthetics: is landscape quality inherent in the landscape or in the eye of the beholder? Landscape and Urban Planning, 44(4), 177–198. https://doi.org/10.1016/S0169-2046(99)00019-5
- Ma, B., Hauer, R. J., Xu, C., & Li, W. (2021). Visualising evaluation model of human perceptions and characteristic indicators of landscape visual quality in urban green spaces by using nomograms. Urban Forestry & Urban Greening, 65(August), 127314. https://doi.org/10.1016/j.ufug.2021.127314
- Medeiros, A., Fernandes, C., Gonçalves, J. F., & Farinha-Marques, P. (2023). Optimising a landscape visual quality protocol. A Method for reducing respondent fatigue and obtaining site-specific indicators. MethodsX, 11(August), 102455. https://doi.org/10.1016/j.mex.2023.102455
- Nakarmi, G., Strager, M. P., Yuill, C., Moreira, J. C., Burns, R. C., & Butler, P. (2023). Assessing public preferences of landscape and landscape attributes: A case study of the proposed Appalachian Geopark project in West Virginia, USA. Geoheritage, 15(3), 85. https://doi.org/10.1007/s12371-023-00851-8
- Nasar, J. L., & Cubukcu, E. (2011). Evaluative appraisals of environmental mystery and surprise. Environment and Behavior, 43(3), 387–414. https://doi.org/10.1177/0013916510364500
- Nasar, J. L., Julian, D., Buchman, S., Humphreys, D., & Mrohaly, M. (1983). The emotional quality of scenes and observation points: A look at prospect and refuge. Landscape Planning, 10(4), 355–361. https://doi.org/10.1016/0304-3924(83)90041-2
- Nassauer, J. I. (1992). The appearance of ecological systems as a matter of policy. Landscape Ecology, 6(4), 239–250. https://doi.org/10.1007/BF00129702
- Natori, Y., & Chenoweth, R. (2008). Differences in rural landscape perceptions and preferences between farmers and naturalists. Journal of Environmental Psychology, 28(3), 250–267. https://doi.org/10.1016/j.jenvp.2008.02.002
- Negev, M. (2012). Knowledge, data and interests: Challenges in participation of diverse stakeholders in HIA. Environmental Impact Assessment Review, 33(1), 48–54. https://doi.org/10.1016/j.eiar.2011.10.002
- Ng, C. F. (2020). Perception and evaluation of buildings: The effects of style and frequency of exposure. Collabra: Psychology, 6(1), 1–10. https://doi.org/10.1525/collabra.324
- Nia, H. A. N. (2021). The role of urban aesthetics on enhancing vitality of urban spaces. Khulna University Studies, 18, 59–77.https://doi.org/10.53808/KUS.2021.18.02.2112-E
- Nüsser, M. (2001). Understanding cultural landscape transformation: A re-photographic survey in Chitral, eastern Hindukush, Pakistan. Landscape and Urban Planning, 57(3–4), 241–255. https://doi.org/10.1016/S0169-2046(01)00207-9
- Ode Sang, Å., & Tveit, M. S. (2012). Perceptions of stewardship in Norwegian agricultural landscapes. Land Use Policy, 31, 557–564. https://doi.org/10.1016/j.landusepol.2012.09.001
- Ode Sang, Å., Thorpert, P., & Fransson, A. M. (2022). Planning, designing, and managing green roofs and green walls for public health – An ecosystem services approach. Frontiers in Ecology and Evolution, 10, 1–16. https://doi.org/10.3389/fevo.2022.804500
- Ode, Å., Hagerhall, C. M., & Sang, N. (2010). Analysing visual landscape complexity: Theory and application. Landscape Research, 35(1), 111–131. https://doi.org/10.1080/01426390903414935
- Ode, Å., Tveit, M. S., & Fry, G. (2008). Capturing landscape visual character using indicators: Touching base with landscape aesthetic theory. Landscape Research, 33(1), 89–117. https://doi.org/10.1080/01426390701773854
- Ogborn, M. (1996). History, memory and the politics of landscape and space: Work in historical geography from autumn 1994 to autumn 1995. Progress in Human Geography, 20(2), 222–229. https://doi.org/10.1177/030913259602000207
- Papadimitriou, F. (2010). Conceptual modelling of landscape complexity. Landscape Research, 35(5), 563–570. https://doi.org/10.1080/01426397.2010.504913
- Paquette, S., & Domon, G. (2001). Trends in rural landscape development and sociodemographic recomposition in southern Quebec (Canada). Landscape and Urban Planning, 55(4), 215–238. https://doi.org/10.1016/S0169-2046(01)00154-2
- Paquette, S., & Domon, G. (2003). Changing ruralities, changing landscapes: Exploring social recomposition using a multi-scale approach. Journal of Rural Studies, 19(4), 425–444. https://doi.org/10.1016/S0743-0167(03)00006-8
- Parsons, R., & Daniel, T. C. (2002). Good looking: In defense of scenic landscape aesthetics. Landscape and Urban Planning, 60(1), 43–56. https://doi.org/10.1016/S0169-2046(02)00051-8
- Pimoljinda, T., & Siriprasertchok, R. (2017). Failure of public participation for sustainable development: A case study of a NGO’s development projects in Chonburi province. Kasetsart Journal of Social Sciences, 38(3), 331–336. https://doi.org/10.1016/j.kjss.2016.08.016
- Pomeroy, R., & Douvere, F. (2008). The engagement of stakeholders in the marine spatial planning process. Marine Policy, 32(5), 816–822. https://doi.org/10.1016/j.marpol.2008.03.017
- Provins, A., Pearce, D., Ozdemiroglu, E., Mourato, S., & Morse-Jones, S. (2008). Valuation of the historic environment: The scope for using economic valuation evidence in the appraisal of heritage-related projects. Progress in Planning, 69(4), 131–175. https://doi.org/10.1016/j.progress.2008.01.001
- Purcell, A. T., & Lamb, R. J. (2006). Preference and naturalness: An ecological approach. Landscape and Urban Planning, 42(1), 57–66. https://doi.org/10.1016/S0169-2046(98)00073-5
- Qi, Z., Duan, J., Su, H., Fan, Z., & Lan, W. (2023). Using crowdsourcing images to assess visual quality of urban landscapes: A case study of Xiamen Island. Ecological Indicators, 154(July), 110793. https://doi.org/10.1016/j.ecolind.2023.110793
- Rangel-Buitrago, N., Correa, I. D., Anfuso, G., Ergin, A., & Williams, A. T. (2012). Assessing and managing scenery of the Caribbean Coast of Colombia. Tourism Management, 35, 41–58. https://doi.org/10.1016/j.tourman.2012.05.008
- Rosley, M. S. F. (2013). Indicator validation in landscape visual quality assessment based on experts and stakeholders perception. Universiti Teknologi Malaysia.
- Rosley, M. S. F. (2019). The image and identity of Muar as the Modern Royal Town of the Johor Sultanate, Malaysia: From the perspective of place identity. http://etheses.whiterose.ac.uk/25025/
- Rosley, M. S. F., Lamit, H., & Abdul, S. R. (2013). Perceiving the aesthetic value of the rural landscape through valid indicators. Procedia-Social and Behavioral Sciences, 85, 318–331. https://doi.org/10.1016/j.sbspro.2013.08.362
- Rotherham, I. D. (2007). The implications of perceptions and cultural knowledge loss for the management of wooded landscapes: A UK case-study. Forest Ecology and Management, 249(1–2), 100–115. https://doi.org/10.1016/j.foreco.2007.05.030
- Russell, J. A. (1989). The genesis of historic landscape conservation in Australia. Landscape Planning, 17(4),305–312. https://doi.org/10.1016/0169-2046(89)90084-4
- Ryan, R. L. (2002). Preserving rural character in New England: Local residents’ perceptions of alternative residential development. Landscape and Urban Planning, 61(1), 19–35. https://doi.org/10.1016/S0169-2046(02)00066-X
- Sargentis, G. F., Siamparina, P., Sakki, G. K., Efstratiadis, A., Chiotinis, M., & Koutsoyiannis, D. (2021). Agricultural land or photovoltaic parks? The water—energy—food nexus and land development perspectives in the Thessaly plain, Greece. Sustainability, 13(16), 8935. https://doi.org/10.3390/su13168935
- Scannell, L., & Gifford, R. (2010). The relations between natural and civic place attachment and pro-environmental behavior. Journal of Environmental Psychology, 30(3), 289–297. https://doi.org/10.1016/j.jenvp.2010.01.010
- Sharafatmandrad, M., & Khosravi Mashizi, A. (2021). Temporal and spatial assessment of supply and demand of the water-yield ecosystem service for water scarcity management in arid to semi-arid ecosystems. Water Resources Management, 35(1), 63–82. https://doi.org/10.1007/s11269-020-02706-1
- Shen, Y., Wang, Q., Liu, H., Luo, J., Liu, Q., & Lan, Y. (2023). Landscape design intensity and its associated complexity of forest landscapes in relation to preference and eye movements. Forests, 14(4), 761. https://doi.org/10.3390/f14040761
- Simmel, G. (2007). The philosophy of landscape. Theory, Culture & Society, 24(7–8), 20–29. https://doi.org/10.1177/0263276407084465
- Solehin, M., Rosley, F., Rafida, S., & Rahman, A. (2014). Biophilia theory revisited: Experts and non-experts perception on aesthetic quality of ecological landscape. Procedia-Social and Behavioral Sciences, 153, 349–362. https://doi.org/10.1016/j.sbspro.2014.10.068
- Stamps, A. E. (2004). Mystery, complexity, legibility and coherence: A meta-analysis. Journal of Environmental Psychology, 24(1), 1–16. https://doi.org/10.1016/S0272-4944(03)00023-9
- Stamps, A. E. (2007). Mystery of environmental mystery: Effects of light, occlusion, and depth of view. Environment and Behavior, 39(2), 165–197. https://doi.org/10.1177/0013916506288053
- Stamps, A. E.III. (2002). Entropy, visual diversity, and preference. The Journal of General Psychology, 129(3), 300–320. https://doi.org/10.1080/00221300209602100
- Stedman, R. C., Lathrop, R. C., Clark, B., Ejsmont-Karabin, J., Kasprzak, P., Nielsen, K., Osgood, D., Powell, M., Ventelä, A. M., Webster, K. E., & Zhukova, A. (2007). Perceived environmental quality and place attachment in North American and European temperate lake districts. Lake and Reservoir Management, 23(4), 330–344. https://doi.org/10.1080/07438140709354022
- Steen Jacobsen, J. K. (2007). Use of landscape perception methods in tourism studies: A review of photo-based research approaches. Tourism Geographies, 9(3), 234–253. https://doi.org/10.1080/14616680701422871
- Suckall, N., Fraser, E. D. G., Cooper, T., & Quinn, C. (2009). Visitor perceptions of rural landscapes: a case study in the Peak District National Park, England. Journal of Environmental Management, 90(2), 1195–1203. https://doi.org/10.1016/j.jenvman.2008.06.003
- Tibbalds, F. (2001). Making people friendly towns: Improving the public environment in towns and cities. Spon Press.
- Tveit, M., Ode, Å., & Fry, G. (2006). Key concepts in a framework for analysing visual landscape character. Landscape Research, 31(3), 229–255. https://doi.org/10.1080/01426390600783269
- Tyrväinen, L., Mäkinen, K., & Schipperijn, J. (2007). Tools for mapping social values of urban woodlands and other green areas. Landscape and Urban Planning, 79(1), 5–19. https://doi.org/10.1016/j.landurbplan.2006.03.003
- Tzoulas, K., & James, P. (2010). Peoples’ use of, and concerns about, green space networks: A case study of Birchwood, Warrington New Town, UK. Urban Forestry & Urban Greening, 9(2), 121–128. https://doi.org/10.1016/j.ufug.2009.12.001
- Ulrich, R. S. (1981). Natural versus urban scenes. Environment and Behavior, 13(5), 523–556. https://doi.org/10.1177/0013916581135001
- Ulrich, R. S. (1983). Aesthetic and affective response to natural environment. In I. Altman & J. F. Wohlwill (Eds.), Behavior and the natural environment. Human behavior and environment (Vol. 6). Springer. https://doi.org/10.1007/978-1-4613-3539-9
- Villagra Islas, P., & Gastón Vergara, D. (2012). Perceived visual landscape changes in a fire prone environment: A multi-method approach. Journal of Environmental Psychology, 32(2), 144–157. https://doi.org/10.1016/j.jenvp.2012.01.001
- Wang, J., & Foley, K. (2023). Promoting climate-resilient cities: Developing an attitudinal analytical framework for understanding the relationship between humans and blue-green infrastructure. Environmental Science & Policy, 146(May), 133–143. https://doi.org/10.1016/j.envsci.2023.05.010
- Wang, R., Browning, M. H. E. M., Kee, F., & Hunter, R. F. (2023). Exploring mechanistic pathways linking urban green and blue space to mental well-being before and after urban regeneration of a greenway: Evidence from the Connswater Community Greenway, Belfast, UK. Landscape and Urban Planning, 235(March), 104739. https://doi.org/10.1016/j.landurbplan.2023.104739
- Weinberger, A. B., Christensen, A. P., Coburn, A., & Chatterjee, A. (2021). Psychological responses to buildings and natural landscapes. Journal of Environmental Psychology, 77(August), 101676. https://doi.org/10.1016/j.jenvp.2021.101676
- Wells, J. C., & Baldwin, E. D. (2012). Historic preservation, significance, and age value: A Comparative phenomenology of historic Charleston and the nearby new-urbanist community of I’On. Journal of Environmental Psychology, 32(4), 384–400. https://doi.org/10.1016/j.jenvp.2012.06.002
- Xenakis, I., Arnellos, A., & Darzentas, J. (2012). The functional role of emotions in aesthetic judgment. New Ideas in Psychology, 30(2), 212–226. https://doi.org/10.1016/j.newideapsych.2011.09.003
- Yap, Y. C., Usman, M. S., Tahir, M. M., & Zainal Abidin, I. (2007, August 24–26). Assessment of Perbadanan Putrajaya Office ground based on urban open space design guideline. In Proceeding of the 3rd WSEAS International Conference on Energy, Environment, Sustainable Development and Landscaping, Greece (pp. 331–337).
- Yuen, B. (2006). Reclaiming cultural heritage in Singapore. Urban Affairs Review, 41(6), 830–854. https://doi.org/10.1177/1078087406289187
- Zhou, L., Li, Y., Cheng, J., Qin, Y., Shen, G., Li, B., Yang, H., & Li, S. (2023). Understanding the aesthetic perceptions and image impressions experienced by tourists walking along tourism trails through continuous cityscapes in Macau. Journal of Transport Geography, 112, 103703. https://doi.org/10.1016/j.jtrangeo.2023.103703
- Zhu, M., Teng, R., Wang, C., Wang, Y., He, J., & Yu, F. (2023). Key environmental factors affecting perceptions of security of night-time walking in neighbourhood streets: A discussion based on fear heat maps. Journal of Transport & Health, 32, 101636. https://doi.org/10.1016/j.jth.2023.101636