
Abstract
A rapid, sensitive and reliable LC-MS/MS method for the determination of galantamine in plasma was developed and validated for the pharmacokinetic study of galantamine hydrobromide 8 mg prolonged-release capsules. The plasma sample was prepared by simple liquid-liquid extraction with dichloromethane. Chromatographic separation was performed on a Hypurity C4 (150 x 4.6 mm, particle size 5.0 µm) using isocratic acetonitrile: 10 mM ammonium formate (90:10) as a mobile phase at a flow rate of 0.8 mL/min. Galantamine was detected by mass spectrometry using the electrospray ion source in the selected reaction monitoring mode. Carbamazepine was used as an internal standard (IS). The extraction recovery was 105.45–111.84% for galantamine and 107.35% for IS. Linearity was found within the calibration range of 0.39–62.5 ng/mL. The intra-day and inter-day accuracy were achieved with the mean concentrations of the quality control samples as 91.92–100.97% and 94.29–102.07%, respectively. The intra-day and inter-day precision were expressed as %CV of 1.34–6.11% and 3.31–5.01%. The long-term stability study showed that galantamine was stabled in plasma for at least 50 days at −30°C. This validated method was proven to be useful for the pharmacokinetic study of galantamine hydrobromide in healthy Thai volunteers. After the oral administration of one tablet in fasting conditions, Tmax and Cmax were found to be 5.61 ± 1.71 hours and 25.96 ± 4.18 ng/mL, respectively, whereas T1/2 was found to be 9.89 ± 1.48 hours.
PUBLIC INTEREST STATEMENT
Galantamine, a cholinergic agent, is one of the approved drugs for the treatment of mild to moderate Alzheimer’s disease (AD). With a dual mechanism of action, reversible competitive inhibitor of acetylcholinesterase and allosteric modulator of nicotinic receptor, galantamine is an effective drug which was widely used. Various formulations of galantamine are available in forms of oral solutions, tablets and capsules. Since the use of galantamine is increased, new formulations and/or generic formulations are required. Pharmacokinetic and bioequivalence studies are also essential as a tool in drug development. These studied required a sensitive and robust bioanalytical method. In this study, a rapid HPLC-MS/MS method for quantification of galantamine in human plasma with simple solvent-solvent extraction was developed, validated and applied in the pharmacokinetic study of 8 mg galantamine hydrobromide release capsules in healthy Thai volunteers.
1. Introduction
Galantamine, a tertiary alkaloid isolated from Caucasian snowdrops, is one of the important acetylcholinesterase inhibitors used for the treatment of mild-to-moderate Alzheimer’s disease (Heinrich & Teoh, Citation2004). With a dual mode of action as an inhibitor of acetylcholinesterase and as a modulator of nicotinic acetylcholine receptors, galantamine exhibited efficacy in the treatment of Alzheimer’s disease (Lilienfeld, Citation2002). Various product preparations of galantamine are available on the market, such as immediate-release tablets, prolonged-release capsules and solutions. The structure of galantamine is shown in Figure .
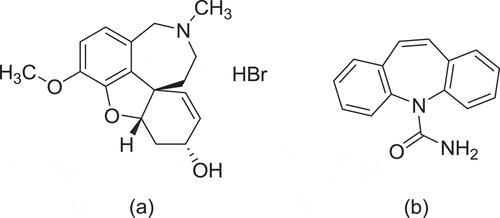
Figure 1. Chemical structures of (a) galantamine HBr and (b) carbamazepine (IS).
The analytical methods of galantamine in rat tissue and plasma, as well as in human plasma, have been widely published. The determination of galantamine in human plasma and serum by using an HPLC-UV detector was presented by Tencheva et al. and Claessens et al. (Claessens et al., Citation1983; Tencheva et al., Citation1987). However, they used multiple steps in their sample extraction methods and the lower limit of quantification (LLOQ) was found to be relatively high, 100 ng/mL and 10 ng/mL, respectively. An analytical method using fluorescence as a detector was presented by Zhang et al. with a lower LLOQ (2 ng/mL) and a calibration range of 2–160 ng/mL, and by Maláková et al. with a linearity range of 0.8–19.66 µmol/mL. (Maláková et al., Citation2007; Zhang et al., Citation2007). Quantifications of galantamine in heparinized plasma using LC-MS/MS showed the lower limit of quantification and/or the wider range of the calibration curve, as presented in Table (Nirogi et al., Citation2007; Park et al., Citation2012; Suresh et al., Citation2014; Verhaeghe et al., Citation2003). However, there is no standard method for the quantification of galantamine in human plasma.
Table 1. Summary of published analytical methods for determination of galantamine by LC-MS/MS
Since the use of galantamine in Alzheimer’s patients has increased, new formulations, including new generic formulations, are required. Pharmacokinetic studies or bioequivalence studies of these formulations need an accurate, precise and robust bioanalytical method. In this study, we presented another sensitive and rapid method for the quantification of galantamine with LC-MS/MS, using carbamazepine as the IS. The developed analytical method was fully validated according to the EMA recommendation on the guidelines on bioanalytical method validation (Citation2011). This method was appropriated for the bioanalysis of galantamine in human plasma in the pharmacokinetic study of 8 mg galantamine prolonged-release capsules in healthy Thai volunteers.
2. Materials and methods
2.1. Chemical and reagents
Galantamine HBr (99.8% purity, Zhejiang Yixin Pharmaceutical, China) and carbamazepine (100.2% purity, Zhejiang, China). Water (RCI Labscan, Thailand), acetonitrile (J.T. Baker, USA), ammonium formate (Sigma-Aldrich, USA) and methanol (Macron Fine Chemicals, USA) composed during the mobile phase were of HPLC grade. The dichloromethane (Fisher Scientific, United Kingdom) used for the plasma sample extraction was of analytical grade.
2.2. HPLC-MS/MS analysis
2.2.1. Instrumentation
An API 3200 Mass Spectrometer with an electron electrospray ionization (ESI) source (AB Sciex, Singapore), an HPLC Agilent 1260 System that consisted of a model 1260 Bin solvent delivery unit, a 1260 Hip on-line degasser, a 1260 Hip ALS autoinjector and a 1260 TCC column oven (Agilent, United States) were used for the LC-MS/MS analysis. The data were acquired and processed using Analyst software (Version 1.6.2).
2.2.2. Chromatographic condition and optimization
The chromatographic separation was optimized with variations in the column, mobile phase and flow rate. The optimal condition was achieved by using a Hypurity C4 column (150 mm x 4.6 mm i.d., 5.0 μm) fitted with a guard column (10 mm x 4.6 mm i.d., 5.0 μm) (Thermo Electron Corporation, USA). The column temperature was controlled at 35°C. Elution was carried out using acetonitrile and 10 mM ammonium formate (90:10 v/v) with a flow rate of 0.8 mL/min. The injection volume was 10 μL.
Quantification was achieved by using an MS/MS detection in a positive ion mode. The MS/MS parameter is shown in Table . The calibration curve was constructed from the peak area ratios of galantamine and IS versus a carbamazepine concentration with a weight of 1/x2.
Table 2. MS/MS parameters for determination of galantamine and carbamazepine (IS)
2.3. Preparation of the standards and quality control samples
The stock solution of galantamine (390 μg/mL) was prepared in 80% acetonitrile and the stock solution of carbamazepine (500 μg/mL) was prepared in 90% methanol. All of the stock solutions were protected from light, stored in a controlled temperature cabinet at 5 ± 3°C and used within 14 days after the preparation.
The calibration standards and quantity control (QC) samples were prepared by spiking 10 μL of the appropriate concentration of galantamine solution into 90 μL of blank human plasma. Eight galantamine plasma concentrations of 0.39, 0.78, 3.90, 7.80, 19.50, 39.10, 54.70 and 62.50 ng/mL were used to construct a calibration curve, whereas the galantamine samples at concentrations of 1.17, 5.85, 23.40 and 46.80 ng/mL were used as low (LQC), medium 1 (MQC1), medium 2 (MQC2) and high QC (HQC) samples, respectively.
2.4. Plasma and sample processing
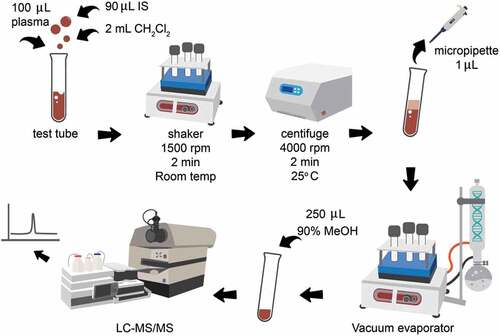
The test sample was prepared by adding 90 μL of the IS working solution (3 μg/mL) into 100 μL of the plasma sample. The sample extraction was done by adding 2 mL dichloromethane into the plasma sample, then shaking it using a Vibramax 110 shaker at 1500 rpm for 2 min at room temperature, followed by centrifugation for 2 min at 4000 rpm at 25°C. A portion of 1 mL of the organic phase was collected, dried under reduced pressure and then reconstituted with 250 μL of 90% methanol. An aliquot of 10 μL was injected into the analytical column. The extraction procedure was performed, as shown in Figure .
Figure 2. Extraction procedure.
2.5. Bioanalytical method validation
The analytical method was validated according to the recommendation of the EMA on the guideline on bioanalytical method validation (EMA, Citation2011). The parameters for validation are as follows: specificity, selectivity, co-medication, matrix effect, LLOQ, recovery, precision, accuracy, robustness and stability studies.
2.5.1. Specificity, selectivity, co-medication and the matrix effect
The specificity and selectivity were studied in six blank plasma samples obtained from six different subjects. Co-medication with caffeine, chlorpheniramine maleate and paracetamol was also investigated by adding these drugs to the plasma samples. The obtained chromatograms should also have been free of the interference peaks appearing at the retention times of galantamine and IS. The matrix factors (MFs) of the galantamine and IS were calculated for each source of the matrix, as the ratio of the peak area in the presence of the matrix (measured by analyzing the blank matrix spiked after extracting the galantamine) to the peak area in the absence of the matrix (a pure solution of galantamine). The IS normalized MF was calculated by dividing the MF of the galantamine by the MF of the IS. The CV of the IS-normalized MF calculated from the eight matrix sources should not have been greater than 15%. This determination was conducted with the LQC and HQC samples.
2.5.2. Linearity and LLOQ
To evaluate the linearity, the calibration curves were prepared from eight calibration standards ranging from 0.39 to 62.50 ng/mL. The suitable weighing factor of linear regression was evaluated as x, 1/x and 1/x2. The lower limit of quantification (LLOQ) sample was evaluated at a concentration of 0.39 ng/mL, with an acceptance of accuracy within the range of 80–120% and a precision within 20%. Moreover, the signal to noise (S/N) of the LLOQ should have been more than 5.
2.5.3. Precision and accuracy
The precision and accuracy were determined from four levels of QC samples within a single batch (intra-day, n = 5) and in three different batches (inter-day, n = 15). The accuracy was expressed by (observed concentration)/(nominal concentration) x 100% and the precision by %CV. The acceptance criteria for the accuracy values should have been within 85–115% for the QC samples, except for the LLOQ, which should have been within 80–120%. The acceptance criteria for precision should not have exceeded 15% for the QC samples, except the CV value for the LLOQ, which should not have exceeded 20%.
2.5.4. Extraction recovery
The extraction recovery of galantamine at concentrations of 1.18, 5.87, 23.50 and 47.00 ng/mL, and of carbamazepine (IS) at a concentration of 273 ng/mL was evaluated by comparing the detector response of the galantamine or IS from an extracted sample to that of the galantamine or IS from an unextracted sample that represented 100% recovery.
2.5.5. Dilution integrity
Dilutions of the samples at a concentration of 112 ng/mL as two- and four-fold were studied for dilution integrity (n = 5 for each study). The accuracy of the back-calculated concentrations of galantamine should have been within 85–115% and the overall CV should not have exceeded 15%.
2.5.6. Robustness
Analyses with two different column lot numbers (nos. 6039 and 10,854) of Hypurity C4 and with a different mobile phase composition (% acetonitrile± 2%) were studied for robustness with the LQC and HQC samples (n = 5 for each level).
2.5.7. Stability studies
The stability of the stock solutions of the galantamine (390 µg/mL) and IS (500 µg/mL) was studied at 25 ± 5°C for 6 hours and 5 ± 5°C for 14 days. The stock solutions were diluted to a proper concentration of 78 ng/mL for the galantamine and 300 ng/mL for the IS before the LC-MS/MS analysis. The stability of the working solution was also performed at 25 ± 5°C for 6 hours and at 5 ± 5°C for 7 days.
The stability study of galantamine in human plasma was conducted at 1.17 and 46.90 ng/mL (LQC and HQC samples). The freeze-thaw stability was studied after five cycles. The short-term stability was determined at 25 ± 5°C for 5 hours, whereas the long-term stability was studied at −30 ± 5°C for 50 days. The stability of the dry extract was determined at 25 ± 5°C for 5 hours and for autosampler stability at 25 ± 5°C for 48 hours. The whole blood stability was studied at 0 ± 5°C for 5 hours.
2.5.7.1. Application in pharmacokinetic study
The validated method was applied to determine galantamine concentrations in plasma samples 0–72 h after the administration of an 8 mg galantamine hydrobromide prolonged-release capsule (Janssen-Cilag SpA, Italy) in 23 healthy Thai volunteers, after the protocol had been approved on 18 July 2014 by the Research Ethics Committee, Faculty of Medicine, Chiang Mai University, Chiang Mai, Thailand (EC approval no. 260/2014). The mean age of the volunteers was 24.7 ± 4.8 years, and their mean weight was 59.8 ± 9.2 kg. All of the volunteers gave their written informed consent to participate in this study according to the principles of the Declaration of Helsinki. The serial blood samples (7 mL) were collected into sodium heparin-containing tubes at 0.0, 1.0, 2.0, 3.0, 4.0, 4.5, 5.0, 5.5, 6.0, 6.5, 7.0, 7.5, 8.0, 9.0, 10.0, 12.0, 24.0, 36.0 and 48.0 hours after the administration of the galantamine capsule. The plasma was separated by centrifugation at 3500 rpm at 4°C for 10 min and stored at −30°C until analysis.
The pharmacokinetic parameters were determined from the plasma concentration-time data. The elimination half-life (T1/2) was calculated using a non-compartment model from Winnonlin® 6.3 computer software (Phoenix™, Singapore). The pharmacokinetic parameters were analyzed including Cmax, Tmax, AUC0-inf, AUC0-48h and T1/2. Cmax and Tmax, which were obtained from the actual data. AUC0-48h was calculated according to the linear trapezoidal rules. AUC0-inf was estimated from AUC0-48h.
3. Results and discussion
3.1. Optimization of the sample preparation and LC-MS/MS condition
The sample extraction was started with a protein precipitation, but this method showed a high matrix effect. The sample preparation was changed to a liquid-liquid extraction with dichloromethane, which is a simple and inexpensive extraction procedure.
For the separation process, the C18 column was first used in the separation of the galantamine and the internal standard. However, a matrix effect was found to occur. To overcome this problem, the column was changed into a C4 column. It was found during the development process that using ammonium formate in the mobile phase showed greater sensitivity than when using ammonium acetate.
Carbamazepine was chosen as a suitable internal standard because it provided a stable extraction recovery and proper retention time.
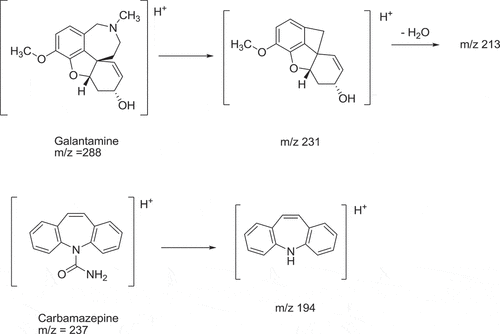
To determine the selectivity of the MS-MS detection, the mother and daughter ions were scanned. The predominant ion in the Q1 spectrum was (M + H)+, which was used as the precursor ion to obtain the product ion spectra. The most sensitive mass transition was from m/z 288 to 213 for the galantamine and from m/z 237 to 194 for the IS. The major product ion at m/z 213 could probably have been generated by a cleavage of the azepine ring, followed by the loss of a water molecule (Figure ) (Nirogi et al., Citation2007). The major product at m/z 194 of carbamazepine was probably generated due to the loss of the amide group (Abdel-Hamid & Phillips, Citation2003).
Figure 3. Proposed protonated molecular ion of galantamine and carbamazepine (IS) and fragmentation of daughter ion.
3.2. Bioanalytical method validation for plasma
3.2.1. System suitability test
This study commenced with a system suitability test. The retention times of the galantamine and carbamazepine were demonstrated to be %CV 0.29 and 0.00, and the %CV peak areas of both substances were 0.70 and 0.84. The peak area ratio was 1.13.
3.2.2. Specificity, selectivity, co-medication and the matrix effect
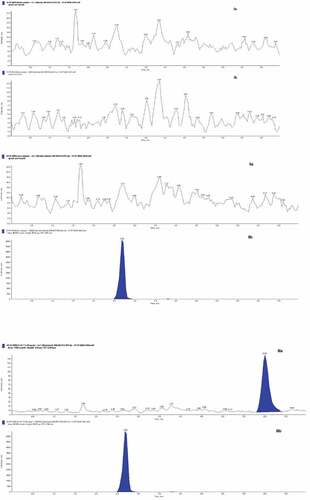
The chromatograms obtained from six different sources of drug-free normal plasma showed that no interfering peas from endogenous compounds were observed at the retention of the galantamine and IS. Concomitant drugs, i.e., caffeine, chlorpheniramine maleate and paracetamol, also showed no interference peaks. The retention times of the galantamine and carbamazepine were approximately 6.00 and 2.69 minutes, respectively. The total chromatographic run time was 7.0 minutes. The matrix study showed the MF of the galantamine and carbamazepine were close to 1 (1.04 and 1.05), demonstrating no ion suppression effect. The coefficient of variation (%CV) of the IS normalized MF was 8.78 and 6.21, respectively. Figure shows a typical chromatogram of the blank human plasma (I), blank plasma spiked with IS (II) and blank plasma spiked with galantamine at the lower limit of quantification (LLOQ, 0.39 ng/mL) and IS (III).
Figure 4. Representative of MRM ion-chromatograms of galantamine (a) and carbamazepine IS (b) (I) human blank plasma, (II) human blank plasma spiked with 300 ng/mL IS, (III) human blank plasma spiked with 0.39 ng/mL galantamine (at LLOQ level) and 300 ng/mL IS.
3.2.3. Linearity and LLOQ
The calibration curve constructed with eight calibration standards (0.39–62.50 ng/mL) had a reliable and reproducibility by plotting the peak area ratio of the galantamine to the carbamazepine versus the plasma galantamine concentrations. A weighting factor of 1/x2 produced the best fit for the concentration-detector response relationship. The coefficients of determination (r2) of the three-day analysis were found to be >0.99. The accuracy of the back-calculated concentration of the galantamine in the calibration curve was 96.58–106.35%. The LLOQ sample at 0.39 ng/mL showed the result within the criteria (accuracy as 101.64% and %CV as 3.85). The lowest value of S/N was found to be 13.70 (n = 5). Table shows the precision and accuracy data of the back-calculated concentration of the calibration samples for galantamine in human plasma (n = 3).
Table 3. Precision and accuracy data of back-calculated concentration of calibration samples for galantamine in human plasma
3.2.4. Precision and accuracy
The precision and accuracy results of the QC samples determined from five replicates on the same day (intra-day), and on three different days (inter-day) are presented in Table . All of the assay values were within the acceptance criteria.
Table 4. Intra-day and inter-day data of galantamine quality control (QC) samples in human plasma
3.2.5. Extraction recovery
The percentages of the extraction recovery of the LQC, MQC1, MQC2 and HQC samples were 105.45, 106.74, 110.84 and 109.67, respectively, and their precisions (%CV) were 3.32, 1.75, 1.78 and 3.46%, respectively. For the IS, the percentage of recovery was 107.35 with 4.55 %CV, compared with the samples pre-extraction standard and post-extracted plasma samples.
3.2.6. Dilution integrity
After four-fold and two-fold dilutions of the sample prepared at 112.32 ng/mL with pooled plasma and then evaluated for the dilution integrity study, the precisions (%CV) were 4.55% and 2.92%, respectively, while the accuracy percentages were found to be 105.04% and 100.42%, respectively.
3.2.7. Robustness
The precision and accuracy of the galantamine analyzed by different analytical columns showed that the results were within the acceptance criteria. The accuracy and precision of the observed concentrations of the LQC samples in the test conditions using column lot number 10,854 were 98.64 and 4.88% respectively, whereas those of the HQC samples were 100.28% and 3.63%, respectively.
Although the retention time of the galantamine and IS analyzed at different ratios of acetonitrile during the mobile phase, sufficient separation of the galantamine and IS peaks from each other, and from other interference peaks, were achieved in the chromatogram. Using 88% of acetonitrile, %CV was 10.00 and 6.22% for the LOC and HQC samples, and the % accuracy was 101.3 and 91.28%. Using 92% of acetonitrile, the %CV was 4.25 and 4.12% for the LQC and HQC samples and the % accuracy was 95.90 and 96.43%.
Thus, the robustness of the analytical method was demonstrated over the evaluation ranges of all of the tested factors.
3.2.8. Stability studies
The galantamine and IS stock solution showed stability at 25 ± 5°C for 6 hours, with the % deviation of the peak areas being −1.79 and 0.43, respectively. After being kept at 5 ± 5°C, the stock solutions of the galantamine and IS were also stable for at least 14 days. The percentages of the deviations of the peak areas of the stock solutions of the galantamine and IS were 5.04 and 7.48, respectively. The working solutions of the galantamine and IS were also stable under study at 25 ± 5°C for 6 hours and at 5 ± 5°C for 7 days, while the % deviations of the galantamine at a concentration of 0.39 ng/mL were −3.16 and 5.66; at a concentration of 62.4 ng/mL they were −1.84 and −0.20; and those of the IS at a concentration of 300 ng/mL were 1.96 and 0.09, for the LQC and HQC and IS, respectively.
The stability of galantamine in human plasma at 1.17 and 46.90 ng/mL (LQC and HQC samples) under various conditions were studied and the results are shown in Table . All of the stability results show that the deviation was within ±10% of the concentration compared with a freshly prepared sample. Therefore, galantamine in human plasma was stable after five freeze-thaw cycles of stability; dry extract stability (25 ± 5°C for 5 hours); autosampler stability (25 ± 5°C for 48 hours); short-term stability (25 ± 5°C for 5 hours); long-term stability (−30 ± 5°C for 50 days); and whole blood stability (−0 ± 5°C for 5 hours). These results indicate the reliable stability behavior under the experimental conditions of this regular analytical procedure.
Table 5. Stability data of galantamine quality control (QC) samples in plasma (five replicates for each experiment)
3.3. Application of the method to a pharmacokinetic study
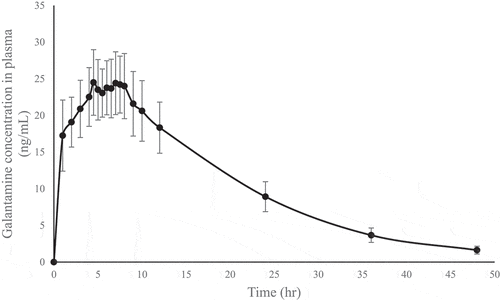
The validated method was successfully used to quantitate galantamine concentrations in human plasma samples obtained from a pharmacokinetic study of galantamine 8 mg prolonged-release capsules in healthy Thai volunteers. The mean plasma concentration-time profile after the oral administration of one capsule in fasting conditions is shown in Figure . The pharmacokinetic parameter showed a mean of Tmax and Cmax of 5.61 hours (ranging from 1.0 to 8.0 hours) and 25.96 ng/mL (ranging from 18.82 to 33.59 ng/mL), respectively. T1/2 was found to be 9.89 hours, and the AUC0-t and AUC0-inf values obtained were 503.47 ng.h/mL and 518.51 ng.h/mL, respectively.
Figure 5. The mean plasma concentration-time profile of galantamine after the oral administration of one capsule galantamine hydrochloride prolonged-release capsule in fasting conditions.
4. Conclusions
An LC-MS/MS method for the determination of galantamine in human plasma using a simple liquid-liquid extraction was developed and validated. This method is rapid, sensitive and specific for the determination of galantamine in human plasma with a high degree of accuracy and precision. Within a calibration range of 0.39–62.50 ng/mL, this method is suitable for application in pharmacokinetic studies of galantamine 8 mg prolonged-release capsules. This study also provided the pharmacokinetic data for galantamine 8 mg prolonged-release capsules in healthy Thai volunteers.
Acknowledgements
The authors acknowledge Atlantic Laboratories Corp., Ltd. for their support of this study.
Additional information
Funding
Notes on contributors
Darunee Hongwiset
Dr. Darunee Hongwiset completed her doctoral degree from Heinrich-Heine-Universität Düsseldorf, Germany, after receiving M.S. in Pharmaceutical Chemistry from Chulalongkorn University (CU) and B.Pharm. from Chiang Mai University (CMU). Associated Prof. Dr. Songwut Yotsawimonwat completed his B.Pharm., M.S. and Ph.D. from CMU. He is well versed in pharmaceutical technology research. Associated Prof. Chokchai and Assistance Prof. Dr. Chuleegone Sornsuvit finished his and her graduation from Mahidol University in the field of Pharmaceutical Care. Miss Saowarunee Sangsrijan graduated from Faculty of Sciences, CMU. She is an expert in bioanalysis and bioequivalence study. We are staffs in Faculty of Pharmacy, CMU, and also in Pharmacy Service Center. We are interested in pharmaceutical development and bioanalytical study, especially in bioavailability and bioequivalence study.
References
- Abdel-Hamid, M. E., & Phillips, O. A. (2003). LC–MS/MS determination of carbamazepine, pindolol, and theophylline in human serum. Journal of Liquid Chromatography & Related Technologies, 26(12), 1937–12. https://doi.org/10.1081/JLC-120021762
- Claessens, H. A., van Thiel, M., Westra, P., & Soeterboek, A. M. J. (1983). High-performance liquid chromatographic determination of galanthamine, a long-acting anticholinesterase drug, in serum, urine and bile. Journal of Chromatography B: Biomedical Sciences and Applications, 275(2), 345–353. https://doi.org/10.1016/S0378-4347(00)84380-7
- European Medicines Agency. (2011). Committee for Medicinal Products for Human Use (CHMP). In Guideline on bioanalytical method validation.
- Heinrich, M., & Teoh, H. L. (2004). Galanthamine from snowdrop-the development of a modern drug against Alzheimer’s disease from local Caucasian knowledge. Journal of Ethnopharmacology, 92(2–3), 147–162. https://doi.org/10.1016/j.jep.2004.02.012
- Lilienfeld, S. (2002). Galantamine-a novel cholinergic drug with a unique dual mode of action for the treatment of patients with Alzheimer’s disease. CNS Drug Reviews, 8(2), 159–176. https://doi.org/10.1111/j.1527-3458.2002.tb00221.x
- Maláková, J., Nobilis, M., Svoboda, Z., Lísa, M., Holcapek, M., Kvetina, J., & Palicka, V. (2007). High-performance liquid chromatographic method with UV photodiode-array, fluorescence and mass spectrometric detection for simultaneous determination of galantamine and its phase I metabolites in biological samples. Journal of Chromatography B, 853(1–2), 265–274. https://doi.org/10.1016/j.jchromb.2007.03.025
- Nirogi, R. V. S., Kandikere, V. N., Mudigonda, K., & Maurya, S. (2007). Quantitative determination of galantamine in human plasma by sensitive liquid chromatography–tandem mass spectrometry using loratadine as an internal standard. Journal of Chromatographic Science, 45(2), 97–103. https://doi.org/10.1093/chromsci/45.2.97
- Park, Y. S., Kim, S. H., Kim, S. Y., Kim, Y. H., Lee, M. H., Yang, S. C., & Kang, J. S. (2012). Quantification of galantamine in human plasma by validated liquid chromatography-tandem mass spectrometry using glimepride as an internal standard: Application to bioavailability studies in 32 healthy Korean subjects. Journal of Chromatographic Science, 50(9), 803–809. https://doi.org/10.1093/chromsci/bms074
- Suresh, P. S., Mullangi, R., & Sukumaran, S. K. (2014). Highly sensitive LC-MS/MS method for determination of galantamine in rat plasma: Application to pharmacokinetic studies in rats. Biomedical Chromatography, 28(12), 1633–1640. https://doi.org/10.1002/bmc.3191
- Tencheva, J., Yamboliev, I., & Zhivkova, Z. (1987). Reversed-phase liquid chromatography for the determination of galanthamine and its metabolites in human plasma and urine. Journal of Chromatography B: Biomedical Sciences and Applications, 421, 396–400. https://doi.org/10.1016/0378-4347(87)80424-3
- Verhaeghe, T., Diels, L., de Vries, R., De Meulder, M., & de Jong, J. (2003). Development and validation of a liquid chromatographic-tandem mass spectrometric method for the determination of galantamine in human heparinised plasma. Journal of Chromatography B, 789(2), 337–346. https://doi.org/10.1016/S1570-0232(03)00129-6
- Zhang, L. J., Fang, X. L., Li, X. N., Wang, Q. S., Han, L. M., Zhang, Z. W., & Sha, X. Y. (2007). Pharmacokinetics and bioequivalence studies of galantamine hydrobromide dispersible tablet in healthy male Chinese volunteers. Drug Development and Industrial Pharmacy, 3(3), 335–340. https://doi.org/10.1080/03639040600868011