
Abstract
Unintended pregnancy is a common global public health problem associated with significant health risks and social costs with 85 M occurring in 2012. Innumerable health surveys have shown increased contraceptive use and access, despite not meeting demand leading to unmet need for contraception. This paper scrutinizes inequity in unmet need among married women of reproductive age using PMA2020/Kenya survey data. Cross-sectional design with multi-stage cluster random sampling technique involving random selection of nine Counties, 120 enumeration areas and 42 households was adopted. Face-to-face interviews using digital platform was done in seven survey rounds from 2014 to 2018 generating 35,185 interviews. Strongly balanced panel data with 2,154 respondents per wave was analyzed using Stata® Ver 14.2. Unmet need was high amongst pubescents (23.2%), higher parity (22.6%), rural residency (22.6%), informal education (36.0%) and poorest (24.8%). Concentration index was negative (−0.11, SE = 0.01), implying poor households have unmet need unlike rich households. Unadjusted and adjusted odds ratio was estimated to rise by 0.44 (95%CL = 0.35–0.57, p-value < 0.05) and 0.69 times (95%CL = 0.34–1.42, p-value > 0.05) with increased poverty levels. Creating contraceptive uptake demand must reciprocate unfailing supply of inexpensive methods targeting adolescents, higher parity, less educated and poorest. Consider involving spouses when discussing contraceptive methods, associated side effects and individual health concerns.
PUBLIC INTEREST STATEMENT
Performance Monitoring and Accountability 2020 (PMA2020) was a 5-year project that used innovative mobile technology to support low-cost, rapid-turnaround surveys to monitor key indicators for family planning and water and sanitation. The project was implemented by local universities and research organizations in 11 Countries, deploying a cadre of female resident interviewers trained in mobile-assisted data collection. PMA2020/Kenya was carried out in 9 counties in 2014 and 2015 and in 11 counties from 2016 to 2018. PMA2020/Kenya was led by the Ministry of Health in collaboration with International Centre for Reproductive Health Kenya (ICRHK), National Council for Population and Development, and Kenya National Bureau of Statistics. Overall direction and support was provided by the Bill & Melinda Gates Institute for Population and Reproductive Health at the Johns Hopkins Bloomberg School of Public Health. PMA2020 was funded by Bill and Melinda Gates Foundation. For more information, please visit www.pma2020.org
1. Introduction
The United Nations Sustainable Development Goal 3.7 mandated all member countries to provide universal access to Sexual and Reproductive Health (SRH) services, encompassing family planning methods, information, education and integration of SRH into national strategies and programs by 2030 (UN, Citation2015). This declaration was arrived at from various evidence-based reports which stated that unintended pregnancy especially among pubescent women, is a common global public health problem, which is associated with significant health risks and social costs. Adolescents who have had one unintended pregnancy are at high risk for a rapid, repeat pregnancy (defined as a subsequent pregnancy within 2 years) whose informed rates among teenagers range from 20% to 50% (WHO, Citation2015). Previously, Sedgh et al. (Citation2014) estimated that about 85 million unintended pregnancies occurred in 2012 while Bongaarts (Citation2016) affirmed that 39% (74 million) of annual pregnancies in developing Countries are unplanned with half of them ending as abortions. Moreover, a report by Mumah et al. (Citation2014) revealed that two in every five pregnancies in Kenya are unintended because they were either mistimed or unwanted. These proportions elucidate the need for incessant, sustainable and accessible family planning programs to reduce unwanted pregnancies among women which can be achieved through effective contraceptive uptake and use.
Extant literature on the demographic impact of family planning programs focuses on their role of increasing contraceptive uptake and use, which, in turn, accelerates fertility decline. Paradoxically, Bongaarts (Citation1999) argued that, it is not clear whether family planning efforts increase demand for contraception or they reduce unmet need for contraception. Contemporary discourses on SRH expounds on the family planning programs’ impact towards fertility decline due to increased contraceptive use whereas the conventional Demographic Transition Theory (DTT) stated that socio-economic development motivated fertility decline. The DTT, also known as “demand theory”, argued that, in medieval times the agricultural societies were characterized by high fertility to counterbalance high mortality. As societies modernized, developed and gained technological knowhow, economic and social changes amplified new prospects and opportunities in life. This led to low mortality, improved living standards, ambition for small families and perception that urban life was epitome of living. Education attainment became the lucid point of view and families endeared educating all their children, subsequently increasing the associated cost of rearing a child and decreased their perceived economic contribution in terms of labor and old-age security. Moreover, women found new liberation from familial chores to participate in economic activities, and, emerging economic roles were less compatible with childbearing resulting into reduced family size occasioning the demand and adoption of contraceptives (Bryant, Citation2007; Notestein, Citation1945, Citation1953).
Circa 1970 and 1980, modern contraceptives were highly recommended in developing Countries culminating into tremendous increase in number of Countries enacting policies supporting family planning programs from 2 to 115 (UN, 2004). Corroboratively, Singh and Darroch (Citation2012) estimated that in developing countries, there were 645 million women using modern contraceptive methods and, 222 million women had unmet need for contraception. The use of modern contraceptive was envisaged to have averted 218 million unintended pregnancies comprised of 55 million unplanned births, 138 million abortions and 25 million miscarriages. The persistent proportion of unmet need for contraception and numerous unplanned pregnancies has laid bare the need for governments and donor agencies to invest in family planning programs. A report by Kols (Citation2008) asserted that on one hand, contraceptive uptake is known to reduce infant mortality, HIV/AIDS spread, poverty while on the other hand, contraceptive uptake promotes gender equality, accelerates socioeconomic development and protects environment. However, studies by Fotso, Izugbara, Saliku, and Ochako (Citation2014) and Ochako et al. (Citation2015) indicated that myths and misconceptions, fear of side effects, perceived association with promiscuity, lower wealth status, religious prohibitions and cultural philosophies remain major hindrances to contraception uptake among Women of Reproductive Age (WRA).
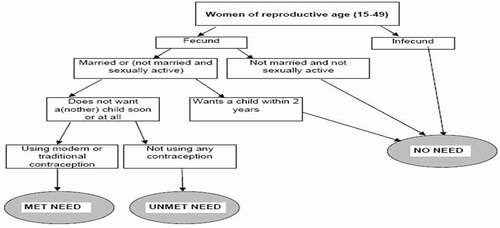
In vast demographic studies’ literature, unmet need for contraception exists when women desire to postpone their next birth for over 2 years (spacing) or not have any more children (limiting) and are not using any method of contraception. Married women of reproductive age (MWRA) who are sexually active and non-contraceptive users are considered to have unmet need for spacing if they; (1) do not want to become pregnant within the next 2 years, are unsure if or when they want to become pregnant, (2) are pregnant or postpartum amenorrheic with a mistimed pregnancy. On the other hand, MWRA who are sexually active and non-contraceptive users are considered to have unmet need for limiting if they (1) do not want more children or (2) are pregnant with unwanted pregnancy, or postpartum amenorrheic for next 2 years following unwanted birth. (Bongaarts, Citation2014; UN, Citation2014; WHO, Citation2015). The diagrammatic representation is shown in .
Figure 1. Diagrammatic illustration of contraception needs among women of reproductive age
1.1. Problem statement
Modern contraceptive prevalence rates (mCPR) in Kenya have been increasing steadily over recent years. This is evidenced by the Kenya Demographic and Health Survey (KDHS) 2014 report which estimated the mCPR among MWRA at 53.0% (KNBS, Citation2014), and, at 53.3% and 60.7% in round 1 (KER1) and round 7 (KER7) respectively by the PMA2020/Kenya survey data (ICHRK & BMGIPRH, Citation2014, 2019). Even though there has been increased uptake in family planning services, the supply still does not fulfill the demand, leading to women having unmet need for contraception (WHO, Citation2015).
In this study, contraceptive prevalence rate is the percentage of women who are currently using at least any on type of contraceptive method which are classified as either modern or traditional. Modern methods include female and male sterilization, intrauterine device (IUD), implant, injectables, oral contraceptive pills, male and female condoms, vaginal barrier methods (including the diaphragm, cervical cap, and spermicidal foam, jelly, cream, and sponge), lactational amenorrhea method (LAM) and emergency contraception. Traditional methods of contraception include rhythm (e.g., fertility awareness-based methods, periodic abstinence) and withdrawal.
The understanding of unmet need for contraception (spacing or limiting) revolves around a woman of reproductive age who is avoiding pregnancy and at the same time not using any contraceptive method. The KDHS 2014 report estimated total unmet need for contraception (spacing and limiting) among MWRA at 18.0% (KNBS, Citation2014), whereas PMA2020/Kenya data estimated unmet need for contraceptives at 24.7% in round 1 and 13.5% in round 7 (ICHRK & BMGIPRH, Citation2014, 2019). Comparing these two analogous surveys, there is a decline in total unmet need for contraception which can be attributed to confounding factors such as fertility desires, engaging in a solemn courtship or household wealth disparity. Despite the laudable decrease in unmet need for contraception, the overarching concern is whether there is equity in decline across social economic divide especially with respect to household wealth status. In corroborating this discourse, Gillespie et al. (Citation2007) noted that, there is inequity in unwanted births due to unmet need for contraception with poorest population having more than twice (1.2) unwanted births than wealthiest population (0.5).
1.2. Justification for the problem
In the 2012 London summit on family planning, more than 20 countries committed to address policy, financing, delivery and socio-cultural barriers that impede women in accessing contraceptive information, services and supplies (FP, Citation2013). It is in this premise that Family Planning 2020 (FP2020) was launched and set an overarching goal to reach out to 120 million new contraceptive users among WRA by 2020 through formation of Performance Monitoring and Accountability 2020 (PMA2020) working groups. In this regard, Kenya as a working group, signed and committed to be in tandem with FP2020 by declaring; to increase married women Contraceptive Prevalence Rate (CPR) from 46% to 56% by 2015, and provide accurate and timely data through PMA2020/Kenya surveys for accountability to the FP2020 commitment.
It is paramount to understand the characteristics of women as they pass through various reproductive age events during their fertility transition. This can be achieved by understanding their demographic characteristics, fertility desires, contraceptive use and uptake, important reproductive age events and reasons for not using family planning methods. Conscious that reproductive transitions are strong pillars for family planning, it is imperative to disentangle and understand trends, inequity and barriers to unmet need for contraception among WRA.
1.3. Research objective
With respect to contraception needs, women of reproductive age can be categorized as having; met need, unmet need, no unmet need or no need for family planning. This paper therefore targets to scrutinize inequity in unmet need for contraception among MWRA using PMA2020/Kenya survey data collected from 2014 to 2018 from nine Counties in Kenya. In achieving this objective, the paper will specifically describe demographic profile, examine trends, estimate inequity and identify barriers associated with unmet need for contraception among MWRA.
1.4. Conceptual framework
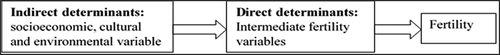
Majority of demographic studies on causes and variation in fertility levels measure the direct influence of socioeconomic factors on fertility where in many instances, the relationship differs in magnitude and direction with respect to variation in locations and period. The Bongaarts (Citation1978) framework for analyzing proximate determinants of fertility, indicates that indirect determinants influence direct determinants which ultimately influence fertility levels as shown in .
Figure 2. Bongaarts framework for analyzing the proximate determinants of fertility
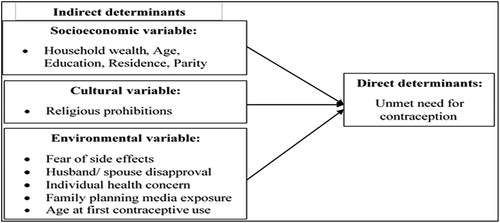
The conceptual framework for this study is adopted from Bongaarts (Citation1978) framework but only delves on relationship between indirect and direct determinants. The direct determinants include; cultural variables (cultural prohibition), socioeconomic variables (household wealth, age, parity, education attainment), and, environmental variables (fear of side effects, husband disapproval, individual health concern, age at first contraceptive use and exposure to family planning media). The direct determinants include unmet need for contraception as shown in .
Figure 3. Conceptual framework
2. Data and methods
The author defines events undertaken when conducting PMA2020/ Kenya survey from 2014 to 2018 which was initially conducted in nine counties until 2015 when two more counties were added. However, this study focusses on initial nine counties until survey rounds completion.
2.1. Survey design
The PMA2020/Kenya survey adopted a cross-sectional approach to collect quantitative data from targeted population biannually between 2014 and 2015, and annually between 2016 and 2018 culminating into seven survey rounds with each round abbreviated as KER.
2.2. Sample size
The Kenya National Bureau of Statistics (KNBS) was solely responsible for the generation of the sampling techniques and sample size owing to its mandate as the sole Government Statistical Agency. The factors for consideration of the sample size included, county level CPR estimates, available resources (financial), population proportion to size, and stratification by rural/urban residency. Considering all these factors, the survey resources allowed a sample of 9 countiesFootnote1 and 120 enumeration areas (EA) with 42 household targeted for each EA. This resulted into achieving 5,040 samples which would translate into having 5,040 completed interviews per household head. However, the number of completed female questionnaire could vary in both ways based on number of eligible female respondents per selected household.
2.3. Sampling technique
Using the KNBS sampling frame, a multi-stage random sampling technique was used with the first stage being the selection of the nine Counties 1, the second stage was the selection of 13 EAs in each of 6 counties and 14 EAs in each of Kiambu, Bungoma and Nairobi. The third stage involved random selection of 42 households in each of the EA.
2.4. Ethical approval
The PMA2020/Kenya survey successfully sought ethical approval from Kenyatta National Hospital-University of Nairobi Ethics and Research Committee and National Commission for Science, Technology and Innovation.
2.5. Training research staff for data collection
Qualified adult female who resided in EAs within selected counties were recruited and engaged as resident enumerators. All the project staff were engaged in a 2-week didactic and residential training which aimed at equipping them with comprehensive instructions on research ethics, consenting process, how to operate Open Data Kit (ODK). ODK is an open-source data management software, which allows user to program the survey tool into a digital platform, restrict access to collected data through username and password, allow strict adherence to skip routines, reduce data collection errors, and, saves time and cost of data entry. To improve hands-on with smart phone, role plays were performed and pilot testing was done in neighboring households in EA not marked for PMA2020/Kenya survey. All research staff were cautioned not to offer personal advice on family planning methods but respondent who showed interests were referred to a health facility.
2.6. Survey administration
On identifying eligible respondents, written informed consent was sought and all interviews were conducted in private and open space convenient to both respondent and resident enumerator. All respondents were informed of the study objectives, procedures, risks, confidentiality and benefits of their responses. Face-to-face data collection was done on digital platform in both English and Swahili dialect. All successively completed interviews were uploaded into a central ODK aggregate cloud server in real time whose access was password protected and only accessible to core project team members.
2.7. Survey instrument
The PMA2020/Kenya survey used standardized survey tools similar to those used in demographic and health surveys for resemblance across implementing countries and for correspondence with existing national surveys. The household questionnaire solicited for basic household information while the female questionnaire solicited for family planning indicators.
2.8. Target population
The target population was household head and all WRA aged 15–49 years. However, those who refused to consent or had cognitive frailty were excluded from participation.
2.9. Description of variables
Age at first contraceptive use: This is the median at first use of any contraceptive method.
Age: Includes all women of reproductive age from 15 to 49 years.
Contraceptive need: This is derived from WRA contraceptive method desires which include meet need, unmet need, no need and infecund/ at menopause stage.
Contraceptive use: Includes all women who are using any birth control method.
County of residence: This refers to the randomly selected county as per sampling strategy.
Education level: Refers to highest education level attained by the WRA.
Exposure to family planning media: This computed from WRA who have heard, seen, or read a family planning advert on radio, television or print media in past few months.
Number of children at first contraceptive use: This refers to children ever born per WRA just before use of any birth control method.
Parity: This variable is computed from children ever born per WRA.
Reasons for non-use: This was evaluated using a continuum of questions with binary responses of yes (1) or no (0). They include and not limited to; fear of side effects, disapproval by spouse; religious prohibitions and individual health concern.
Residential setting: This refers to residing in either urban or rural setting in respective county. Wealth quintile: This variable is computed from a variety of questions which evaluate ownership of items and household structure characteristics. Statistical principal component analysis was used to compute aggregate score per household which derives the five quintiles.
2.10. Statistical method
Statistical analysis was performed using Stata® version 14.2. The Hausman test (Torres-Reyna, Citation2007) was adopted to test whether to use fixed or random effects whose criteria is to use fixed effects if Chi-square is significant (p-value < 0.05) or random effects if the reverse is true (Greene, Citation2008). In this paper, the Chi-square p-value = 0.065 which is an implication to use random effects.
The analysis procedure involved univariate analysis by computing measures of central tendency, bivariate analysis for performing tests for independence and concentration indices (CI) for estimating inequities. Kakwani (Citation1977) stated that concentration indices are used to measure inequity of one variable over the distribution of another, whose context has been extensively used to identify existence of inequity between socioeconomic and health variables, and, examine its prominence with respect to time or region. Kakwani et al. (Citation1997), averred that CI does not quantify the degree of social economic inequity but measures and compares the degree of social economic inequity. The CI ranges from −1 to +1 where conventionally, a negative value is an indication that a bad condition is disproportionately concentrated among the poor but sparsely concentrated among the rich. When the CI gets a positive value, it’s an indication that a good condition is less among the poor but more concentrated among the rich. A value of zero indicates lack of inequity while a value tending to one signifies increasing inequity (O’donnell et al., Citation2007). Further, estimation of barriers to unmet need for contraception were computed using logistic regression while controlling for demographic characteristics.
3. Results
This paper reports calculations which were done at 95% level of confidence with priori probabilities less than 5% deemed statistically significant and are presented based on the weighted sample.
3.1. Fertility indicators among married women of reproductive age by survey rounds
The aggregated dataset comprised of 35,185 successful interviews forming a panel data with seven survey rounds. A panel data is described as data-set entailing measuring variables of interest that change over time unlike the subject or entity itself. A strongly balanced panel data was achieved with each wave having 2,154 respondents. Using the total weighted sample of 14,470 WRA, three in every five (60.3%, 0.8%) were married or in union while the rest were unmarried (not in union, divorced, separated). Further, within the MWRA sample, the contraceptive prevalence rate (CPR) was estimated at 60.2% (1.0%), modern contraceptive prevalence rate (mCPR) at 58.6% (1.0%), demand for contraception at 78.1% (0.9%) and demand satisfied by modern methods at 74.6% (1.0%). On important reproductive age events, the median age at first contraceptive use was estimated at 23.0 years after having birthed two children as shown in .
Table 1. Fertility indicators among MWRA by PMA2020/Kenya survey rounds
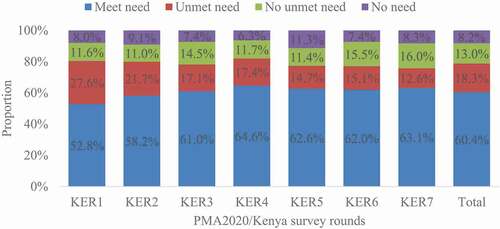
With respect to contraception needs among married women of reproductive age, three in every five (60.4%, 1.0%) had met needs, 18.3% (0.8%) had unmet need, 13.0% (0.7%) had no need for contraception while 1 in every 12 (8.2%, 0.6%) were infecund or at menopausal stage. The distribution in each PMA2020/Kenya survey round is shown in .
Figure 4. Contraception needs among MWRA across PMA2020/Kenya survey rounds
3.2. Demographic profile of MWRA with unmet need for contraception
Trends of unmet need for contraception with respect to MWRA demographic profiles and their respective test of independence using Fisher’s test was conducted as shown in . The average unmet need for contraception was estimated at 18.3% (0.8%). The highest estimate was recorded at KER1 (27.3%) and the lowest estimate at KER7 (12.5%) which has been decreasing significant (p-value = 0.000) across the survey rounds. The unmet need for contraception had varied estimates across the various age categories and survey rounds. The highest estimates was among MWRA aged 15–19 years (23.2%) and lowest among MWRA aged 25–29 years (16.3%). Other than adolescent aged 15–19 years, there is a persistent significant decrease in unmet need for contraception among MWRA aged 20–49 (p-value<0.05) as shown in .
Table 2. Trends of unmet need among MWRA using PMA2020/Kenya surveys round
With respect to children ever born, MWRA with parity of four or more children had the highest unmet need for contraception (22.6%) and lowest for those with parity of 0–3 children (15.7%). Further analysis reveals that there is significant decrease (p-value<0.05) in unmet need for contraception within parity categories among MWRA’s across seven rounds. In terms of residential setting, unmet need for contraception is higher among rural residents (22.6%) as compared to urban residents (15.7%). This not withstanding, there is continued significant decrease in unmet need for contraception in both residential settings (p-value<0.05) across the survey rounds. For County of residence, the highest unmet need for contraception was recorded in Kilifi (28.4%) and the lowest in Nyamira (10.2%). Across the seven survey rounds, there is continued significant decrease (p-value<0.05) in unmet need for contraception in all sampled counties except Kericho, Nairobi and Nyamira counties.
On education attainment, unmet need for contraception was more pronounced among MWRA who had no formal education (36.0%) and lowest among those with tertiary education (12.0%). Other than those with tertiary education level, there is statistically significant decrease (p-value < 0.05) in unmet need for contraception across survey rounds. Within the wealth categories, unmet need for contraception was pronounced among MWRA within the lowest wealth quintile (24.8%) and lowest for those within the highest wealth quintile (14.6%). Other than MWRA who are at the middle wealth category, there is significantly decrease (p-value<0.05) in unmet need for contraception as shown in .
3.3. Estimating inequity in unmet need for contraception using concentration indices
The concentration indices (CIs) and associated standard errors (SE in brackets) for residential settings and County of residence across the seven PMA2020/Kenya survey rounds are shown in . On average the CI was estimated at −0.11 (SE = 0.01) which is negative an indication that unmet need for contraception is permeating among less wealthy households than in more wealthy households. On matters of residential settings, it is also evident that unmet need for contraception is higher among poorer population both in urban (CI = −0.04, SE = 0.01) and rural (CI = −0.10, SE = 0.02) settings despite higher inequity being in rural settings. Across the counties of residence, unmet need for contraception had varied concentration indices across the survey rounds. Both Nairobi (CI = 0.04, SE = 0.04) and Siaya (CI = 0.02, SE = 0.04) counties have positive concentration indices, which is an indication that unmet need for contraception is more concentrated among the wealthy population unlike with less wealthy population. On the other hand, Bungoma, Kericho, Kiambu, Kilifi, Kitui, Nandi and Nyamira counties have negative concentration indices which is an indication that unmet need for contraception is more concentrated among the less wealthy population unlike with the wealthy population. However, Kitui county has the highest inequity dominance (CI = −0.21, SE = 0.04) while Nyamira has the least dominance (CI = −0.02, SE = 0.05). Peculiarly, Kiambu county depicts unusual trends of inequity in unmet need for contraception. During the first survey rounds (KER1), the results indicate equity in unmet need for contraception (CI = 0.00, SE = 0.2). However, there is an increase in inequity in unmet need for contraception among less wealthy in subsequent survey rounds from KER2 (CI = −0.02, SE = 0.1) to KER7 (CI = −0.72, SE = 0.3).
Table 3. Concentration indices in each survey round by county and residential setting
3.4. Examining barriers to unmet need for contraception
Further analysis was done to compute both un-adjusted and adjusted odds ratio for unmet need for contraception while taking into consideration the perceived confounding factors of social demographic variables. From the analysis, the unadjusted odds ratio (UOR) for unmet need for contraception was estimated to rise by 0.44 times (95%CL = 0.35–0.57, p-value<0.05) with increase in poverty levels. However, when social demographic profile and perceived barriers to unmet need were used as control variables the adjusted odds ratio (AOR) indicate that unmet need for contraception was estimated to increase by 0.69 times (95%CL = 0.34–1.42, p-value > 0.05) as shown in .
Table 4. Odds ratio for inequity in unmet need for contraception
With demographic profiles, the AOR for unmet need for contraception was expected to increase by 0.77 times (95%CL = 0.67–0.88, p-value < 0.05) as age increases and marginally increase by 0.66 times (95%CL = 0.43–1.03, p-value < 0.1) with change from urban to rural residency. The AOR for unmet need for contraception significantly increases threefold with perceived reasons for not using family planning methods. The associated AOR for these barriers include; fear of side effects (AOR = 3.67, 95%CL = 2.36–5.70, p-value < 0.05), husband/spouse is opposed (AOR = 3.74, 95%CL = 1.50–9.32, p-value < 0.05) and health concerns (AOR = 3.2, 95%CL = 2.11–4.87, p-value < 0.05). Additionally, the AOR for unmet need for contraception is expected to significantly rise by 1.05 times as the age at first contraceptive use increases (95%CL = 1.01–1.09, p-value < 0.05). However, the AOR for unmet need for contraception on religious strictures, exposure to family planning media and number of children ever born prior to first contraceptive use occurred due to chance as shown in .
4. Discussion
Contraceptive uptake is influenced by two synergetic contexts namely supply and demand. In this study, 60.3% women of reproductive age are married out of which three in every five (58.6%) are using modern contraceptives, four in every five (78.1%) are in demand of contraceptive and the modern contraceptive methods are satisfying 74.6% of the demand. Contextually, unmet need is the proportion of women who are sexually active, do not want to become pregnant and they are not using contraceptive methods, which can be computed as the difference between the demand for contraception and use of any method of contraception (Bongaarts, Citation2014). Unmet need is a valuable family planning program indicator as it depicts how well a Country is achieving its’ population’s demand for contraception. In this study, one in every five (18.3%) married woman of reproductive age have unmet need for contraception. Additionally, the findings indicate that higher proportion of unmet need for contraception is synonymous with younger women (15–19 years) at 23.2%, higher parity women (22.6%), rural settings residence (22.6%), being informally educated (36.0%) and being in the lowest wealth status (24.8%). Moreover, this report indicates that women are using family planning methods for their first time at 23 years having already given birth to two children. These results are corroborated by previous studies which concluded that even a slight variation in education level, urban residence or parity have a high likelihood of improved contraceptive uptake which in turn decreases unmet need for contraception (Austin, Citation2015; Khan et al., Citation2008). Similarly, Asamoah et al. (Citation2013) asserted that enhancing modern contraceptives access among women with unmet need for contraception improves maternal and child health and reduces mortalities through decimating unintended pregnancies.
The concept of inequity can be instrumental when developing and marshalling resources meant for health interventions that are specifically directed to those ranked as poor within the population. Gillespie et al. (Citation2007) complemented this assertion by articulating that equity analysis is invaluable in regions synonymous with high fertility among the poor and regions marked with poor family planning coverage leading to dismal contraceptive uptake and associated increasing unwanted fertility. In this study, inequity in unmet need was evident among women of reproductive age who were ranked as poor (CI = −0.11, SE = 0.01) which could be attributed to their high fertility and low contractive uptake. Both Nairobi and Nyamira have unmet need for contraception being more concentrated among wealthy, while the rest showed inequity is more among the poor population. However, Kiambu county has gradually increasing dominance of inequity in unmet need for contraception among the poor which should be a health concern to the health practitioners. The benign modalities of dealing with inequity is to improve access to reproductive health information and service provision to couples and emphasize on health benefits accrued from planned families.
For barriers to unmet need for contraception, fear of side effects, husband disapproval, associated health concerns and age at first use of family planning have been strongly specified as deterrents to unmet need for contraception. In fertility and contraception discourses, Coale (Citation1973) averred that contraceptive use must be within couple’s calculus of conscious choice, contraceptive methods must be perceived as beneficial, acceptable, reliable and practically accessible. Therefore, an effective family planning program should fetch beyond provision of contraceptive services by addressing social obstacles to use, and should be within precincts of “ready, willing, and able” concept (Bongaarts, Citation2016; Greene, Citation2008).
5. Conclusion
This study has revealed that creating demand for contraceptive uptake must be reciprocated by a system where there is unfailing supply of inexpensive and satisfactory methods. Family planning programs should amplify their contraceptive methods uptake sensitization campaign among women who are at adolescent age, residing in rural areas, with higher parity, with low education and in lower wealth status. Improved effectiveness of contraceptives in necessitating fertility decline, should be initiated at early age as women start their fertility transitions. Further, family planning programs should upscale discussion on contraceptive methods including; associated side effects, include couples on family planning discussions and demystify fears associated with individual’s health concern.
Data availability
The data used in this study can be accessed from PMA2020 website to registered users via https://www.pma2020.org/about-data or https://www.pma2020.org/request-access-to-datasets
Disclosure of potential conflicts of interest
The author declares no conflict of interest when analyzing, reporting or disseminating this data.
Additional information
Funding
Notes on contributors
Gerald Mahuro
Gerald Mahuro is a research scientist and a PhD student in University of Nairobi specializing in population studies (demography). He has research interest on matters social sciences based on his published journal articles. He was PMA2020 core team member as ICRHK data analyst for the PMA2020/Kenya round 5 in 2017.
Professor Murungaru Kimani, is an Associate Professor in the University of Nairobi, College of Humanities and Social Science, Population Studies and Research Institute. Professor Murungaru is an expert in population studies with over 30 publications regarding population health.
Notes
1. Bungoma, Kericho, Kilifi, Kiambu, Kitui, Nairobi, Nandi, Nyamira and Siaya.
References
- Asamoah, B. O., Agardh, A., & Östergren, P.-O. (2013). Inequality in fertility rate and modern contraceptive use among Ghanaian women from 1988–2008. International Journal for Equity in Health, 12(1), 37. https://doi.org/https://doi.org/10.1186/1475-9276-12-37
- Austin, A. (2015). Unmet contraceptive need among married Nigerian women: An examination of trends and drivers. Contraception, 91(1), 31–16. https://doi.org/https://doi.org/10.1016/j.contraception.2014.10.002
- Bizuneh, G., Shiferaw, S., & Melkamu, Y. (2008). Unmet Need and Evaluation of Programme Options to Meet Unmet Need for Contraception in Ethiopia, 2000 and 2005: Further Analysis of the 2000 and 2005 Ethiopia Demographic and Health Survey. Macro International.
- Bongaarts, J. (1978). A framework for analyzing the proximate determinants of fertility. Population and Development Review, 4(1), 105–132. https://doi.org/https://doi.org/10.2307/1972149
- Bongaarts, J. (1999). The fertility impact of changes in the timing of childbearing in the developing world. Population Studies, 53(3), 277–289. https://doi.org/https://doi.org/10.1080/00324720308088
- Bongaarts, J. (2014). The impact of family planning programs on unmet need and demand for contraception. Studies in Family Planning, 45(2), 247–262. https://doi.org/https://doi.org/10.1111/j.1728-4465.2014.00387.x
- Bongaarts, J. (2016). Development: Slow down population growth. Nature, 530 (7591), 409–412. Bongaarts, J., & Bruce, J. (1995). The causes of unmet need for contraception and the social content of services. Studies in Family Planning, 57-75. https://doi.org/https://doi.org/10.1038/530409a
- Bryant, J. (2007). Theories of fertility decline and the evidence from development indicators. Population and Development Review, 33(1), 101–127. https://doi.org/https://doi.org/10.1111/j.1728-4457.2007.00160.x
- Coale, A. J. (1973). The demographic transition. Paper presented at the international population conference, International Union for the Scientific Study of Population. Liege, (Liege, 1973), p69.
- Fisher, R. A. (1970). Statistical Methods for Research Workers (14 ed.). Hafner Publishing. https://www.cabdirect.org/cabdirect/abstract/19351601205
- Fotso, J. C., Izugbara, C., Saliku, T., & Ochako, R. (2014). Unintended pregnancy and subsequent use of modern contraceptive among slum and non-slum women in Nairobi, Kenya. BMC pregnancy and childbirth, 14(1), 224
- FP. (2013). London summit on family planning: summaries and commitments. Paper presented at the family planning summit 2012, London. http://www.familyplanning2020.org/sites/default/files/London_Summit_Commitments_12-2-2013.pdf
- Gillespie, D., Ahmed, S., Tsui, A., & Radloff, S. (2007). Unwanted fertility among the poor: An inequity?. Bulletin of the World Health Organization, 85(2), 100–107. https://doi.org/https://doi.org/10.2471/BLT.06.033829
- Greene, W. H. (2008). Econometric analysis (6 ed.). Upper Saddle River, N.J: Prentice Hall. Hammerslough, C. R. (1992). Proximity to contraceptive services and fertility transition in rural Kenya. International Family Planning Perspectives, 54–58.
- ICHRK, & BMGIPRH. (2014). Performance Monitoring and Accountability 2020 (PMA2020) Survey round 1, PMA2014/Kenya-R1. ICRHK, Nairobi.
- ICHRK, & BMGIPRH. (2019). Performance Monitoring and Accountability 2020 (PMA2020) Survey round 7, PMA2019/Kenya-R7. ICRHK, Nairobi.
- Kakwani, N. C. (1977). Measurement of tax progressivity: An international comparison. The Economic Journal, 87(345), 71–80. https://doi.org/https://doi.org/10.2307/2231833
- Kakwani, N. C., Wagstaff, A., & Van Doorslaer, E. (1997). Socioeconomic inequalities in health: Measurement, computation, and statistical inference. Journal of Econometrics, 77(1), 87–103. https://doi.org/https://doi.org/10.1016/S0304-4076(96)01807-6
- Khan, S., Bradley, S., Fishel, J., & Mishra, V. (2008). Unmet need and the demand for family planning in Uganda. In Further analysis of the Uganda Demographic and Health Surveys 1995-2006, 1-43. https://dhsprogram.com/pubs/pdf/FA60/FA60.pdf
- KNBS. (2014). Kenya demographic and health survey. KNBS, Nairobi. Retrieved from https://dhsprogram.com/pubs/pdf/fr308/fr308.pdf
- Kols, A. (2008). Reducing unmet need for family planning: Evidence-based strategies and approaches. Outlook, 25(1), 1.
- Mumah, J., Kabiru, C. W., Mukiira, C., Brinton, J., Mutua, M., Izugbara, C. O., … Askew, I. (2014). Unintended pregnancies in Kenya: A country profile. APHRC, Nairobi.
- Notestein, F. W. (1945). Population: The long view. Food for the World, 36–57.Chicago: Chicago University Press.
- Notestein, F. W. (1953). Proceedings of the eighth international conference of agricultural economists. held at kellogg center, michigan state college, USA.
- O’donnell, O., Van Doorslaer, E., Wagstaff, A., & Lindelow, M. (2007). Analyzing health equity using household survey data: A guide to techniques and their implementation. The World Bank.
- Ochako, R., Mbondo, M., Aloo, S., Kaimenyi, S., Thompson, R., Temmerman, M., & Kays, M. (2015). Barriers to modern contraceptive methods uptake among young women in Kenya: A qualitative study. BMC Public Health, 15(1), 118. https://doi.org/https://doi.org/10.1186/s12889-015-1483-1
- Sedgh, G., Singh, S., & Hussain, R. (2014). Intended and unintended pregnancies worldwide in 2012 and recent trends. Studies in Family Planning, 45(3), 301–314. https://doi.org/https://doi.org/10.1111/j.1728-4465.2014.00393.x
- Singh, S., & Darroch, J. E. (2012). Adding it up: Costs and benefits of contraceptive services. In Guttmacher Institute and UNFPA, 1269-1286.
- Torres-Reyna, O. (2007). Panel data analysis fixed and random effects using stata (v. 4.2). Data & Statistical Services, Priceton University, 112. http://dss.princeton.edu/training/
- UN. (2014). World contraceptive use 2014 (POP/DB/CP/rev2014). Retrieved from https://www.un.org/en/development/desa/population/publications/dataset/contraception/wcu2014/Metadata/WCU2014_UNMET_NEED_metadata.pdf
- UN. (2015). Sustainable Development Goals.http://www.un.org/sustainabledevelopment/health/
- WHO.(2015) Retrieved from. Annual technical report: 2014: department of reproductive health and research, including UNDP/UNFPA/WHO/World Bank Special Programme of Research Training in Human Reproduction (HRP). Retrieved fromhttps://apps.who.int/iris/handle/10665/171613
- WHO. (2015). Annual technical report: 2014: department of reproductive health and research, including UNDP/UNFPA/WHO/World Bank Special Programme of Research Training in Human Reproduction (HRP). Retrieved from https://apps.who.int/iris/handle/10665/171613
- WHO. (2015). Annual technical report: 2014: department of reproductive health and research, including UNDP/UNFPA/WHO/World Bank Special Programme of Research Training in Human Reproduction (HRP). Retrieved from https://apps.who.int/iris/handle/10665/171613