
 ?Mathematical formulae have been encoded as MathML and are displayed in this HTML version using MathJax in order to improve their display. Uncheck the box to turn MathJax off. This feature requires Javascript. Click on a formula to zoom.
Abstract
Abstract: Tuberculosis (TB) is still a public health problem and amongst the top 10 leading causes of death. The objective of this study is to analyze the survival time of TB patients and identify the risk factors that influence their survival in Pawe Hospital during the treatment period. The data for this study are obtained from TB patients registered books from September 2009 to January 2010 under Directly Observed Treatment, Short-course (DOTS) at the health centers in Pawe Hospital. The analytical methodologies used were the Kaplan–Meier to estimate the survival time and Cox’s regression model to identify the covariates that have a statistically significant effect on the survival longevity of TB patients. The estimation of the model parameters was done by partial maximum likelihood procedures. The multivariate analysis of the Cox regression model gives that age, category (patient category), initial weight and HIV status have statistically significant effects on the survival longevity of TB patients. On the other hand, sex, marital status, and history of previous treatment have no impact on the survival experience of TB patients. The study shows that 84.5% of the patients were still alive at the end of 8 months of anti-TB treatment. Based on the result of the study, different factors are identified for the death of TB. Patients recommended that TB co-infected people should have awareness about the hazard of the risk factors identified in this study, and health workers should be cautious when a patient has lower Initial weight and HIV-positive status.
PUBLIC INTEREST STATEMENT
Tuberculosis is one of the leading causes of mortality among infectious diseases worldwide. For effective tuberculosis control, it is a prerequisite to detect the cases as early as possible and to ensure that the tuberculosis patients complete their treatment and get cured. Despite the availability of effective medicine to treat the condition, many people still die from the condition. Thus, it is essential to the improvement of tuberculosis patients’ healthcare in that it provides feedback based on statistical compilations and analyses of, for example, disease occurrence, medication and procedure success, and recovery rates. In addition, this study provides background demographic data on an individual basis. The authors recommended that tuberculosis co-infected people should have awareness of the hazard of the risk factors identified in this study, and health workers should be cautious when a patient has lower Initial weight and HIV-positive status.
1. Background of the study
Tuberculosis (TB) is still a public health problem and amongst the top 10 leading causes of death in the world about 1.3 million people died due to TB and an additional 0.4 million people died due to TB among HIV-positive patients (WHO, Citation2017). In the world an estimated 10 million people developed TB, among them 0.92 million people were HIV-positive (WHO, Citation2018). TB is one of the most serious public health challenges worldwide. Globally, around 10.4 million people develop TB and 1.8 million people die from it (0.4 million of these also have HIV) (WHO, Citation2016). Sub-Saharan Africa, including Ethiopia, has the highest prevalence of TB infection in the world. In 2015, a World Health Organization (WHO) report showed that Ethiopia ranked seventh out of 22 countries with the highest TB burden (WHO, Citation2016).
In 2016 alone, 1.5 million TB deaths were recorded globally of which Africa shares close to three fourth. According to WHO TB report, 20 countries share 85% of all estimated TB cases worldwide and Ethiopia falls under this category, which indicates high TB burden in the country (WHO, Citation2017, Citation2019; Tola et al., Citation2019). Ethiopia is one of the 30 high TB, TB/HIV and multi-drug-resistant (MDR-TB) burden countries in the world with more than 126,000 reported cases in 2016; and despite achieving a treatment success rate of more than 90%, 30% of cases remain undetected (The 12th National TB Research, Citation2017). According to WHO 2014 and 2015 report, the prevalence and incidence of all forms of TB were 211 and 224 per 100,000 of the population, respectively.
Infections are broadly classified into pulmonary TB (PTB) that accounts 85% of all TB cases and extrapulmonary TB (EPTB) that compromises the remaining 15% of all TB cases (FMOH, Citation2008). HIV infection has been identified as a major risk factor for developing TB, and It is estimated that 50–60% of HIV-infected people will develop TB disease in their lifetime in contrast with HIV-negative persons, whose lifetime risk is only 10% (FMOH, Citation2008). One European clinic-based study reported a worse survival profile for persons with PTB) compared to an EPTB group.
A report from South India showed that 39 (6%) of 676 TB patients died during treatment period and higher death rates were independently associated with weight <35 kg and history of previous treatment (Santha et al., Citation2000). In the study done by Vasantha et al. (Citation2008) in Tiruvallur district, sex, age, category, education, occupation, body weight at initiation of treatment (<35 kg), history of previous anti TB treatment, smoking and drinking habits, type of DOT providers were found to be risk factors for death during the treatment period. A study conducted in Russia reported 183 (9.6%) deaths among 1916 TB patients. Old age, history of previous treatment for TB, multi-drug resistance TB, and alcoholism have significance effect for death during treatment period (Mathew et al., Citation2006). Abrham Keraleme (2009) found that the survival probabilities of TB patients with low initial weight were low.
1.1. Statement of the problem
TB is a serious health problem in Pawe Hospital in Benishangul-Gumuz region affecting highly the socioeconomic and health status of the study area at large so that we are interested to conduct a study on whether the survival pattern of TB patients treated under directly observed Treatment at Pawe Hospital. Also was interest to find out whether TB risk varies spatially within health centers or not under the variables taken into consideration.
It is only recently that the FDRE has begun to openly critique preexisting policies. In order to implement basic health provision at possible lower cost, the community and NGOS are encouraged to work in collaboration with the government. However, in some disadvantaged areas of the country like Benishangul-Gumuz, many citizens have been denied of basic health centers due to various factors like, lack of access, lack of awareness about the benefit and use of health center, demographic and socioeconomic problems.
It is only recently that the Pawe Hospital statistics data shows that TB is the leading cause of morbidity, the second cause of hospital admission (after deliveries and malaria), and the third cause of death in Pawe Hospital after malaria. In order to investigate the above-stated problems, the following basic questions were set.
How to develop the survival pattern of TB patients under direct treatment?
How to identify the factors that facilitate the death of TB patients?
The main objective of the study was to analyze the survival time pattern of TB patients and identify the risk factors that influence their survival in Pawe Hospital districts of Benishangul-Gumuz, Ethiopia. Specifically, to compare the survival of TB patients with respect to their TB categories, survival of TB patients with HIV (=/+ve and -ve) with respect to their categories. To identify risk factors for death of TB patients during treatment period.
2. Data and methodology
2.1. Data sources
The data for this study was obtained from TB unit in Metekel Zone Pawe Hospital which consists of seven wards. The Directly Observed Treatment, Short-course (DOTS) strategy has been implemented in this area since 2000. There are 20 governmental health centers (HCs) participating in the program. During 21 September 2009–10 January 2010, about 1007 TB patients were registered for the treatment under DOTS at the HCs in Metekel zone Pawe Hospital.
All the patients diagnosed with TB at one of these HCs are given DOT in accordance with National Tuberculosis and Leprosy Control Programmed (NTLCP) policies. According FMOH (Citation2008), every dose of treatment is to be directly observed during the intensive phase (IP). This phase consists of three or more drugs for the first 8 weeks for new cases and 12 weeks for re-treatment cases and at least two drugs to be taken for 4–6 months during continuation phase. The drug must be collected every month and self-administered by the patient, except for re-treatment cases. TB is a curable disease that can be treated with a combination of several drugs for 6–12 months. Most commonly TB is treated with isoniazid plus three other drugs consisting rifampicin, pyrazinamide, and ethambutol. Promoting directly observed treatment short courses (DOTS) helps to ensure the right drugs are taken at the right time for the full duration of treatment and has a paramount importance in increasing TB treatment success rate (Otu, Citation2013; Karumbi & G, Citation2015; WHO, Citation2017).
2.2. Sample size and sampling technique
The sample size was determined by using sample size determination formula for time to event data (Chow et al., Citation2008). The following assumptions are considered for the sample size determination: Zα/2 is the critical value of standard normal distributed variable at 5% significance level, Zβ is the critical value of standard normal distributed variable at 20% of β and β is the probability of type two error, b is log (hazard ratio), p1 is the proportion of number of patients in the first category, p2 is the proportion of number of patients in the second category, and d represents proportion of the event. The proportion of recovered patients from obstetric fistula (d = 0.817) was taken from a previous study conducted at Addis Ababa Abreham (Citation2009). Finally, the required sample was 637 patients. In total, 1,007 TB were treated in the hospital, from 21 September 2009 to 10 January 2010, of which 637 patients were selected randomly.
Scheme 1. Schematic/diagrammatic representation of survival model for tuberculosis patients

2.3. Data collection technique
The data were collected from the TB clinic unit registration book review. The Unit Registers reviewed contain basic information such as patient’s age, sex, address, category, TB type, drug regimen, date treatment started, treatment follow-up, follow-up sputum result, and treatment outcomes.
Category and treatment outcome were collected from TB register maintained by treatment unit. Category I is defined as all new cases that are sputum smear positive or seriously ill patients with smear negative or extrapulmonary disease. Category II patients are cases who have had previous anti-TB treatment. Category III regimen is prescribed to new patients who are smear negative or EPTB and are not seriously ill.
2.4. Variables
The response (dependent) variable is continuous and describes the length of treatment time in days. The explanatory (independent) variables of interest in this analysis include socioeconomic, demographic, and characteristics of disease and treatment profiles. They are mentioned here below.
2.5. Methods for data analysis
The analytical methodologies used were Kaplan–Meier to estimate the survival time, and Cox’s regression model was employed to identify the covariates that have a statistical significant effect on the survival longevity of TB patients.
3. Result
3.1. Descriptive statistics
The medical cards of 637 patients total 99 (15.54%) are death cases. A death proportion seems lower for females (14.08%) than for males (17.23%). The single group showed the highest percentage (16.17%) with respect to death proportions than the other two groups and HIV-positive have highest proportion of death (26.5%). Category I TB patients have the highest death proportion (31.29%) as compared to the other two groups while Category III TB patients show the lowest death rate. A patient who took the treatment for the first time, which is a new case, seems to have lower death proportion (15.41%) than other groups (18.52%) and PTB patients’ death proportion (24.14%) seems larger than EPTB patient. All the results have been summarized in and .
Figure 1. Schematic/diagrammatic representation of survival model for tuberculosis patients
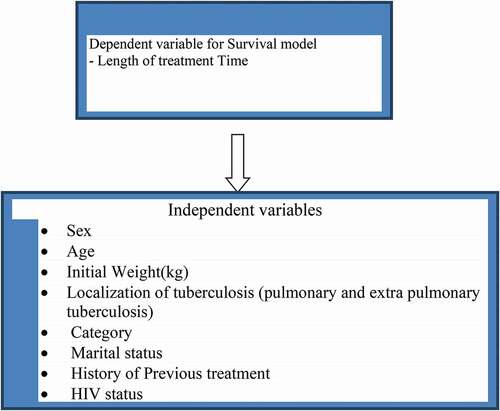
Table 1. Demographic and health factors of categorical covariates TBPD, 2020
4. Comparison of survival experience
We investigate whether the observed differences in data summary among different factors are statistically significant or not with the help of Kaplan–Meier survival estimates test. The Kaplan–Meier estimator survival curve gives the estimate of survivor function among different groups of a covariates to make comparisons. Separate graphs of the estimates of the Kaplan–Meier survivor functions are constructed for different categorical covariates. In general, the pattern that one survivorship function lying below another means the group defined by the lower curve has the lowest chance to survive than the group defined by the upper curve.
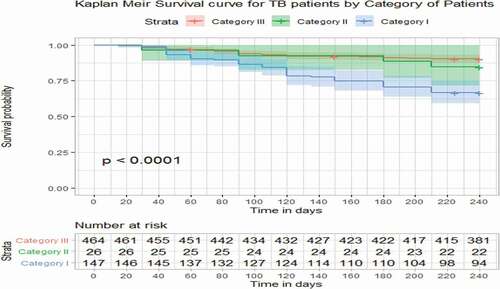
also supports that there is a difference in survival function between categories and further identifies that, in general Category III patients survive longer than the other two. Whereas Category I patients have the lowest chance to survive.
Figure 2. Survival curves of TB patients under three categories, 2020
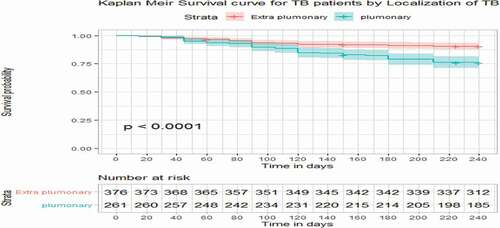
In it again supports that there is a difference in survival function between EPTB and PTB patients and further shows that extrapulmonary patients survive better than PTB patients especially after the patients are treated for about 3 months.
Figure 3. Survival curves of extrapulmonary and pulmonary TBPD, 2020
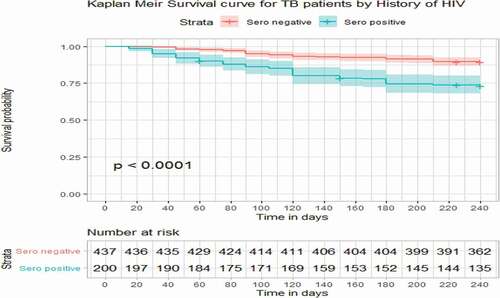
shows that there is a difference in survival function between HIV-negative TB patients and HIV-positive TB patients (HIV-negative TB patients survive better than HIV-positive TB patients especially after the patients are treated for about 3 months).
Figure 4. Survival curves of TB patients under HIV-positive and HIV-negative, 2020
shows that localization of TB, category of TB patient and HIV status are statistically not equal in experiencing the death event, whereas sex, marital status, and history of previous treatment are statistically the same in experiencing the event death. The log-rank test results suggest that localization of TB, category of TB patient, and HIV status are significant covariates whose different levels have an impact in the survival longevity of TB patients, while sex, marital status, and history of previous treatment do not have an impact. Different groups of category, localization of TB, and HIV status to compare the survival probability of TB patients are given below.
Table 2. Equality of survival experience among the different groups of covariates, 2020
4.1. Bivariate analysis
For each covariate, we will use a bivariate Cox proportional hazards model analysis that contains a single independent variable in order to have an idea about each covariate. Likelihood ratio chi-square test is used to test the significance of bivariate relationship.
In bivariate analysis, using likelihood ratio chi-square test, the variables that are found to be significant (p-value 0.2 is used as a criterion for significance) are age of a patient (Age), initial weight of a patient (Intwt), localization of TB (TB type), category of a patient (Cat), history of previous treatment (ptreat), and HIV status (Hiv). Age of a patient, initial weight, localization of TB, category, and HIVb status, with p-value less than 0.05 (standard level of significance) have relatively strong associations to the death of TB patients. summarizes the findings of bivariate analysis.
Table 3. Bivarate analysis results for each covariate, 2020
5. Checking for the linearity of covariates in the model
The next step is to examine the scale of continuous covariates in the preliminary main effects model. A number of techniques are available, all of which are designed to determine whether the data support the hypothesis that the effect of the covariate is linear in the log hazard and, if not, which transformation of the covariate is linear in the log hazard. Now we use the graphical method of testing linearity for continuous covariates. As described in Section 3, the Martingale residuals may be plotted against covariates to detect for the correctness of the functional form. The following R software output shows the resulting graph.
The following graphs show the plot of Martingale residual versus covariates. For each of the covariates, namely age, initial weight of TB patient and interaction of HIV status by age, the plots do not show systematic patterns or trends and the resulting smoothed plots [locally weighted polynomial regression (LOWESS)] are approximately straight line. Therefore, the plots of Martingale residual confirm that age and initial weight of a patient have an approximate linear relationship with the survival time.
shows computer output of the result of the fitted hazards model. Based on the result, we look for predictors having statistical significant relationship with the hazards (death of TB patients). All the covariates, namely age, category (site of patient), initial weight, and HIV, are significant.
Table 4. Results of final proportional hazard model stratified by category of TB patients, 2020
The values of the Wald statistics for individual β coefficients support that the estimated values are significantly different from zero at α = 0.05 level of significance for all the above four covariates. The remaining variables that were used in the bivariate analysis are found to be nonsignificant. We consider the model that contains these covariates as a preliminary final model, and it could be the final model after we check proportionality assumptions.
6. Overall goodness of fit
We use as a measure of overall goodness of model fit. As defined in Section 3, it is given as
where N = 637 is the total number of observation in the model
LLo = 539.6465 is the log partial likelihood for model zero
L L βˆ = 500.183 is the log partial likelihood for the fitted model with p covariates.
For the fitted model in Table5 : the value is
= 0.116.
The model displayed in has passed all the tests for a good fitting model.
Table 5. Variables in the preliminary final model, 2020
7. Interpretation and presentation of a final model
The model fit to the TB data, shown in contains two continuous linear covariates (age and initial weight of a patient), one dichotomous covariate (HIV status) and an interaction between a continuous and a dichotomous covariate (age and HIV status).
The estimated covariate coefficient = −0.09389 for the continuous risk factor initial weight implies that the hazards ratio is 0.9104. This shows the change of hazard rate for every 1 kg increase in initial weight. For a better interpretation, we consider the change of the hazard rate for every 5 kg increase in initial weight. The estimated hazard ratio for a 5 kg increase in initial weight of TB patients is 0.63= exp(5 * −0.09389). The interpretation is that patients with 5 kg increase in initial weight, the probability of survival increased by about 28%, holding all others fixed .
Figure 5. Plots of Martingale residuals computed for continuous covariates age and initial weight, 2020
Age and HIV status are present in the model, with both main effects. Since HIV status is at two levels, we present hazard ratios for age at each HIV status rather than for HIV status at each age. The estimated log hazard as a function of the variables Age, HIV, and Hivage, holding initial weight fixed is given as
Log (Age, HIVstatus, x) =
Age +
HIV +
HIV x Age +
Z
The next expression for the difference of an increase of say 10 years of age holding HIV fixed is
Log R(Age + 10, HIVstatus, x) =
(Age +10) +
HIV +
HIV x Age +
Z
−[Age +
HIV +
HIV x Age +
x]
=10 + 10
HIV
Finally, the estimated hazard ratio for an increase of 10 years of Age at HIV = 0 is
R(Age + 10,Age,HIV = 0) =
=1.45
And at HIV = 1 the hazard ratio is
R(Age + 10,Age,HIV = 1) =
=1.18
The interpretation is that being older by 10 years at HIV-ve increases the rate of death by about 45%. Whereas at HIV+ve, the rate of death is increased only by 18%. This shows that death due to HIV is less dependent on Age.
8. Discussion
WHO defines TB mortality as the number of TB cases dying during treatment, regardless of the cause. Death caused by TB is preventable and management can be modified at the time of highest risk for death if known (WHO, 2008). It is now recognized that both TB and HIV contribute to each other’s progress. Patients co-infected with TB and HIV has higher mortality rates in comparison with those infected with one or the other.
The survival rates in this study were found to be 68.71%, 84.62%, and 89.44% in categories I, II, and III, respectively. The survival rates reported in another study were 96%, 94%, and 97% in categories I, II, and III, respectively (Vasantha, 2008).
From the study, we found that the factors that significantly affects the survival pater of a patient is age and it has been identified as an important risk factor for death in TB patients. This result is in accordance with the study of (Santha et al., Citation2000), Higher death rates have been noted in the elderly patients and concomitant diseases like cardiovascular diseases, diabetes mellitus, and malignancy have been found to be frequently present in the older patients with TB (Mohammed, Citation2011; Santha et al., Citation2000). In agreement of these studies in Pawe Hospital , apart from the increased physiological risk of death, the vague symptoms in the elderly, diagnostic problems, and concomitant illness could be some of the contributing factors for the increased death rate in the elderly.
Similarly, category (site of patient) is the stronger predictor in Pawe Hospital for death and has an impact in the survival longevity of TB patient. It is known that category (site of patient) has a higher risk of TB patients in agreement with the previous study by Vasantha et al. (Citation2008). In addition to those factors, initial weight is considered a significant risk factor for death of TB patients. The finding illustrates that the hazard of TB patients with low initial weight is higher for patients who had high initial weight. The result is comparable with earlier study by Abreham (Citation2009) and Vasantha et al. (Citation2008). In our study in the given study period and for a given data set, extrapulmonary patients survive better than PTB patients. Hence, our study concises with the study with one European clinic-based study that reported a worse survival profile for persons with PTB compared to an EPTB group.
9. The limitations of the study
Even though this study provides useful insights into how the emic perspective about TB can hinder progress toward the survival experiences of TB in study area, it is important to note a few limitations. The major limitation of the study goes with the problems related to the use of secondary data. As different literature pointed out, there are different factors that are assumed to have impacts on the survival of TB patients such as alcoholism and smoking status. However, data on these variables could not be available in hospital records, so these variables were not integrated in this study.
Abbreviations
DOTS: Directly Observed Treatment, Short-course; FMOH: Federal Ministry of Health HIV: Human Immunodeficiency Virus; IP: Intensive Phase; LOWESS: Locally Weighted Polynomial Regression; MDR: Multi-Drug Resistant; NTLCP: National Tuberculosis and Leprosy Control Program; TB: Tuberculosis; WHO: World Health Organization
Disclosure of potential conflicts of interest
The author(s) declare they have no competing interests.
Ethical considerations
All procedures performed in studies involving human participants were in accordance with the ethical standards of University of Gondar Institution and the University Research Committee declarations with comparable ethical standards for confidentiality.
Acknowledgements
We wish to extend our thanks to all individuals involved in the study from the University of Gondar Referral Hospital, Ethiopia.
Availability of data and materials
The data sets analyzed during the current study are available from the corresponding author on reasonable request.
Additional information
Funding
Notes on contributors

Endeshaw Assefa
Mr. Endeshaw Assefa is a Lecturer in University of Gondar, College of Natural and Computational Sciences, Department of statistics Gondar, Ethiopia. He holds a Master of Science in biostatistics (MSc. biostatistics) and a Bachelor of degree in statistics (BSc, Statistics). He served as a Monitoring and Evaluation Specialist in the Productive Safety Net Program (PSNP) of Dabat District, Amhara province, Ethiopia. He is currently engaged in teaching statistics courses at Undergraduate, Research Supervision in the said areas and levels, and community engagement, among others. His major research areas are; Econometrics/Statistical method/biostatistics and others.
References
- The 12th National TB Research, (2017). Annual Conference and Commemoration of World TB Day
- Abreham, K. (2009) Survival pattern of tuberculosis patients treated under directly observed treatment short course in Addis Ababa.
- Chow, S.-C., Shao, J., & Wang, H. (2008). Sample size calculations in clinical research. In B. Jones, J.-P. Liu, & K. E. Peace (Eds.), Comparing time-to-event data (2nd ed.).
- FMOH. (2002). Manual tuberculosis and leprosy prevention and control programs. Addis Ababa.
- FMOH. (2008). Manual of tuberculosis and leprosy prevention and control programs. Addis Ababa.
- Gross, A. J. A. C., & A, V. (1975). Survival distribution. John Wiley and Sons Inc.
- Hembroff, L. A. A. M., & E, D. (1984). Status characteristics: Degrees of task relevance and decision processes. Social Psychology Quarterly, 47(4), 337–13. https://doi.org/https://doi.org/10.2307/3033636
- Karumbi, J., & G, P., (2015). Directly observed therapy for treating tuberculosis (Review). Cochrane Database of Systematic Reviews.
- Lawless, J. F. (1982). Statistical models and methods for life time data. John Wiley and Sons, Inc.
- Mathew, T. A., A., O. T., Shin, S. S., Gelmaova, I., Balbuea, D. A., Atwood, S., Peremitin, G. G., Strelis, A. K., & Murray, M. B. (2006). Causes of death during tuberculosis treatment in Tomsk Oblast, Russia. The International Journal of Tuberculosis and Lung Disease: The Official Journal of the International Union against Tuberculosis and Lung Disease, 10(8), 857–863.
- Miller, R. G. (1981). Survival analysis A global goodness of fit statistics for the proportional hazards model. In T. Moreau, J. O’Quigley, & M. Mesbsh (Eds.), Applied statistics (Vol. 34, pp. 212–218). (1985). John Wiley and Sons.
- Mohammed. (2011). Risk factors of active tuberculosis in people living with HIV/AIDS in southwest Ethiopia: A case control study. Ethiopian J Health Sci, 21, 131–139.
- Otu, A. A. (2013). Is the directly observed therapy short course (DOTS) an effective strategy for tuberculosis control in a developing country? Asian Pacific Journal of Tropical Disease, 3(3), 227–231. https://doi.org/https://doi.org/10.1016/S2222-1808(13)60045-6
- Santha, T., R., G., Frieden, T. R., Chandrasekaran, V., Subramani, R., Gopi, P. G., Selvakumar, N., Ganapathy, S., Charles, N., Rajamma, J., & Narayanan, P. R. (2000). Risk factors associated with default, failure and death among tuberculosis patients treated in a DOTS programme in Tiruvallur District. Int J Tuberc Lung Dis 2002, South India, 6, 780–788.
- Tola, A., Minshore, K. M., Ayele, Y., & Mekuria, A. N. (2019). Tuberculosis treatment outcomes and associated factors among TB patients attending public hospitals in Harar town, Eastern Ethiopia: A five-year retrospective study. Hindawi Tuberculosis Research and Treatment.
- Vasantha, M., Gopi, P. G., & Subramani, R. (2008). Survival of tuberculosis patients treated under DOTS in a rural tuberculosis unit (TU).
- Waldman, E. A., P. L., A. A. B., Komatsu, N. K., De Figueiredo, S. M., Taniguchi, M., & Rodrigues, L. C. (2002). Profile of tuberculosis patients progressing to death. city of Sao Paulo.
- WHO. (2007). Global tuberculosis control program report. World Health Organization.
- WHO. (2016). Global tuberculosis report 1211 Geneva 27, Switzerland: Contract No.: WHO/HTM/TB/2016.13
- WHO, (2017). Global tuberculosis report.
- WHO. (2018). Global tuberculosis report (Vol. 23).
- WHO. (2019). Guidelines on tuberculosis infection prevention and control
- WHO, Strategy on TB (2017). END TB BY 2030.