
 ?Mathematical formulae have been encoded as MathML and are displayed in this HTML version using MathJax in order to improve their display. Uncheck the box to turn MathJax off. This feature requires Javascript. Click on a formula to zoom.
Abstract
The impact of remittances on household expenditure inequality is extensively documented in the development literature. Yet, it is relatively less focused on its effect at the household level. In the context of Pakistan, higher labour migration offers enough scope to examine the expenditure inequality across the remittance-receiving and non-receiving households. This study analyzes the effect of external and internal remittances on expenditure inequality of households in Pakistan. The study uses data from PSLM—HIES 2018–2019 survey. The quantile regression results suggest an unequal expenditure distribution across the household. The external remittance-receiving household is significantly higher in expenditure per capita across the distribution vis-à-vis internal migrant or without migrant households. The study concluded that the current level of endowment is higher in the external remittance-receiving household, which is a significant source of expenditure gap across the household categories. The aftermath of the mean decomposition model suggests that the relatively higher income of the external remittance-receiving household significantly contributes to the expenditure gap across the household categories. The findings from quantile decomposition suggest that external remittances cause more discrimination for the affluent household than the poor ones. The study’s implication suggests some policy measures to ease the access to international migration to improve the expenditure distribution.
Public Interest Statement
This study investigates the Effect of Internal and External Remittances on Expenditure Inequality in Pakistan. By applying different econometric approaches, the study concluded that external remittance-receiving household is significantly higher in expenditure per capita across the distribution vis-à-vis internal migrant or without migrant household. The external remittance is a potential source of expenditure inequality across household groups. This project will help policymakers achieve some targets of the 10th goal of sustainable development goals (SGCs), which deal with reduced inequalities. The study will help researchers and development economists understand different sources of inequality across the household and expenditure distributions in the presence of non-labour income (remittance) receipts. The study will suggest some policy measures by considering efficiency and equity. The findings will also help in observing the differences in expenditure due to lack of access to international migration.
1. Introduction
Household consumption expenditure is an important component among all other components of gross domestic product (GDP). All forms of consumption constitute about two-thirds of GDP (Mankiw, Citation2019, p. 67). While for developing countries, this figure is above two-thirds of GDP. For instance, Pakistan’s consumption expenditure-to-GDP ratio was 82% in 2020 (World Bank, Citation2020). However, at the household level in Pakistan, the expenditure-to-income ratio ranges from 91% to 97% across the different quantile groups (PSLM/HIES 2018–2019). This higher consumption-to-GDP ratio at the macro level and expenditure-to-income ratio at the household level indicates that Pakistan is a consumption-oriented economy where individuals give more preferences to consumption than saving.
Pakistan's last two decades were growth-led periods with positive economic growth (IMF Economic Outlook, Citation2018). Although Pakistan has experienced consumption-led growth over the decades, the expenditure distribution at the bottom did not improve or worsen. It has been observed that over the last two decades, the Gini coefficient (based on per capita expenditure) has increased from 0.252 to 0.294 (UNDP’s Pakistan National Human Development Report UNDP’s Pakistan, Citation2020). Moreover, the expenditure share of the bottom 20% also decreased as the Palma ratio outstretched from 3.701 in 2002 to 4.610 in 2019, and the Pashum ratio also increased from 0.401 to 0.489 during the same period implying that the value of the Gini-coefficient went up. Although the current level of inequality is lower than in other lower middle-income countries, but increase in Palma and Pashum ratio over the time is indicating a decreasing share of bottom quantile as well as worsening income distribution. The worst income distribution is a potential source of poverty. Poverty is a major problem in Pakistan; however, despite enormous resources and human potential, the reference country cannot attain a tolerable living standard (Jamal, 2018). The primary source of this inequality in Pakistan is poverty because poor household cannot meet their basic needs, and the vicious cycle of poverty remains in place.
Remittances were not recognized as essential for developing economies in the early history of development economics. However, for the developing economies, in the globalized world, remittances from abroad seemed to contribute to poverty reduction in the process of development (Adams, Citation2004; Bouoiyour & Miftah, Citation2014; Cuecuecha & Adams, Citation2016; Dey, Citation2015). Remittances at the household level decrease poverty by raising the household income. On the flip side, the inflow of remittances, through its indirect effect, decreases poverty by accelerating economic growth, stabilizing the inflation and exchange rate, and supporting the financial market (Murodova, Citation2018). It is a well-established fact that remittances widen the disparities between rich and poor households if remittances are sent disproportionately to better-off households while contracting if remittances are sent to worse-off households (Dey, Citation2015). An exception to the effect of remittances on poverty, the distributional effect of remittances remains relatively untapped at the household level. The present study attempts to address this void using household survey data.
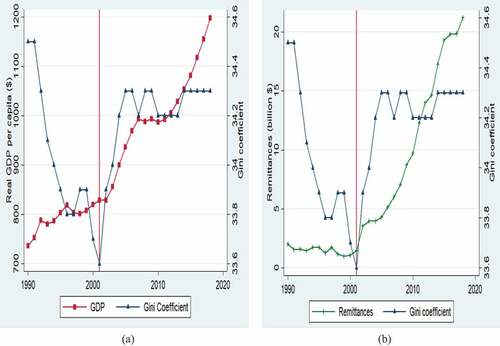
The GDP per capita of Pakistan increases from 1990 to 2016, along with an increase in income inequality (see, Figure ). It implies that the effect of economic growth did not transmit and indicates the failure of the “trickle-down” effect. The economy of Pakistan is also a victim of a sharp increase in remittances after 2001. Notwithstanding the income inequality of Pakistan increases monotonically. However, this increase in income inequality keeps a broad relevance for academicians, researchers, and policymakers. Despite its importance, few attempts have been made to its practical side at the household level. The existing literature is abundant on remittances and inequality nexus in Pakistan at the macro-level (see, Siddiqui & Kemal, Citation2006; Kalim & Shahbaz, Citation2009; Kousar et al., Citation2019; many others) but scant at the household level. To the best of our knowledge and using the available information, the study of Adams and Mahmood (Citation1992) is close to our study in the context of dealing with remittances and expenditure inequality. Nevertheless, their study is related to estimating the Gini coefficient in the presence of internal and external remittance receipts for rural areas of three districts of Pakistan.
Figure 1. (a) GDP per capita and income inequality. (b) Remittances and income inequality.
However, the present study attempts to investigate the effect of internal and external remittances on expenditure inequality at the household level by using the modern econometric approach and nationally representative household survey. For empirical analysis, this study will use Pakistan social and living standard measurement (PSLM/HIES) survey conducted in 2018–2019. We will apply quantile regression, quantile decomposition, and mean decomposition approaches to gain insight into the expenditure inequality.
The objectives of the study are fourfold. First, it estimates and compares the expenditure level at external, internal, and non-receiving households across the distribution using quantile regression. Second, using the mean decomposition approach, it assesses how much of the expenditure differential is among the household groups due to endowment and coefficient effects. Third, it decomposes the share of each covariate on the expenditure gap across the household groups. Finally, the quantile decomposition approach decomposes the expenditure disparity due to the endowment and coefficient effect among the household groups across the distribution. This project may help policymakers achieve some targets of the 10th goal of sustainable development goals (SGCs), which deals with reduced inequalities. The study may help researchers and development economists understand different sources of inequality across the household and expenditure distributions in the presence of non-labour income (remittance) receipts. The study suggests some policy measures by considering efficiency and equity. The study’s research findings may help observe the differences in expenditure due to lack of access to international migration.
2. Literature review
Many theories have been made in an attempt to explain the complex and multi-dimensional nature of the problem of inequality. These theories pointed to economic, political, and social aspects responsible for household expenditure inequality. Among these theories, for instance, the human capital theory was propounded by Becker (Citation1962); the redistribution of political power towards the poor put forward by Lenski (Citation1966, pp. 44 f.); social segregation theory described by Koch and Valdés (Citation2008). However, the theory related to migration and the resulting outcome is the New Economics of Labour Migration (NELM) theory proposed by Stark and Bloom (Citation1985). It states that the decision to send a family member abroad for work is the sole decision of the household rather than the individual. The household send a family member abroad to diversify their sources of income, reduce risk and locate sources of credit and capital. The money remitted by the emigrants is a source of household income which in turn higher the socio-economic status of the household relative to its reference group.
The existing literature on the effect of remittances on income distribution is almost puzzling. For instance, some studies suggest that remittances positively affect income inequality (Devkota, Citation2014; Duval & Wolff, Citation2013; Hobbs & Jameson, Citation2012; Salifu et al., Citation2016). It depicted that international migration is similar to adopting new production technology, increasing productivity and widening the income gap. The impact of remittances on widening the income distribution states that households receiving remittances are not poor, and receiving remittances improve their expenditure status more dramatically than the non-receiving household (Adams et al., Citation2008). Moreover, the migration of a household member is subject to financial constraints and can be afforded by the household from the upper-middle or top of the income distribution. This further implies that remittances will likely widen income inequalities in migrant-source areas (Anyanwu, Citation2011). Analogously, Nilsson and Ramadan (Citation2020) found that immigration increases inequality in destination countries (Italy and Spain) and source countries (Iraq and Jordan).
However, remittances negatively affect income inequality and contribute to narrowing the inequality gap at household and national levels (Bang et al., Citation2016; Jones, Citation2013). In a similar study, Tsaurai (Citation2018) found that human capital development and remittances complement each other and found that remittances negatively affect income inequality in relatively higher human capital development counties. The study of Arslan and Taylor (Citation2010) found that migration prevalence has reversed the un-equalizing effects of international remittances at the national level. Moreover, the equalizing change in the marginal effects of remittances was the highest in the region where an increase in international migration is higher. Similarly, it is also observed that districts with a higher share of transfer income are associated with lower income inequality (Shams & Kadow, Citation2020).
Contrary to remittances’ positive and negative effects on income inequality, Bang et al. (Citation2018) found that remittances do not affect the expenditure inequality in the 13th to 35th quantiles. The marginal effect of remittance is seen to follow an approximate U-shape over the household expenditure distribution until the 89th quantile; after that, it drops sharply. It implied that remittances decrease expenditure inequality in the low-income and high-income classes than in the middle class.
The decomposing effect of remittances and migration varies on region, ethnicity, and economic status. While Howell (Citation2017) found that migration significantly boosts income for all ethnic groups, decomposition analyses further reveal that migration increases inequality between ethnic groups despite reducing spatial inequality. Past studies have found that the differentials in educational attainment and geographical location accounted for a large part of expenditure inequality (Akita & Miyata, Citation2008:148). In this context, the study of Balisacan and Fuwa (Citation2004) found that spatial inequality, including both rural–urban disparity and regional disparities, accounted for approximately 19% to 11% and is decreasing over time. Moreover, the contribution of family size to expenditure inequality increases over time. It is revealed that a household head’s educational attainment can explain about one-third of the total expenditure inequality from 1985 to 2000. In addition, a household head’s employment status and access to infrastructure were also significant factors in determining expenditure inequality (see, Balisacan & Fuwa, Citation2004: 12; Kang, Citation2011).
The classical theories on internal migration by Lewis (Citation1954), Sjaastad (Citation1962), Lee (Citation1966), and Harris and Todaro (Citation1970) crystallized the factors responsible for rural to urban migration and contributed to the process of economic development. These theories state that the migration process is subject to disequilibrium in the labour market, cost and returns, push and pull factors, and differences in earning across the sectors. These theories further state that migration contributed to economic development by escaping poverty. Among the available classical theories, the new economics of labour migration proposed by Stark and Bloom (Citation1985) is most relevant in our study. This theory states that a member’s migration is a household’s decision to diversify its income portfolio because migrants send money back to hedge against the risk and ease liquidity constraints.
The empirical literature suggests that internal remittances decrease poverty (Ackah & Medvedev, Citation2012; Awuse et al., Citation2020; Housen et al., Citation2013; Molini et al., Citation2016). Internal remittances often have substantially smaller monetary value than international remittances, but in many rural communities in low-income nations, even small amounts of cash could have high utility and prove vital in rural development and poverty reduction (Deshingkar & Farrington, Citation2006). Nevertheless, it increases the income inequality of the household (Adams et al., Citation2008; Bayraktar & Özyılmaz, Citation2017). The internal remittance-receiving household spent more on education and food than a vis-à-vis non-receiving household (Randazzo & Piracha, Citation2019). It is corroborated that lower wages are a push factor in the migration process, and higher returns to migration are associated with a higher socioeconomic position in the region of origin. Contrarily, internal remittances decrease the income inequality among the household and increase the expenditure on health and education (Ahmed et al., Citation2021). It implies that the size of remittances possesses a significant share in household income, and a higher remittance share in household income does not affect the inequality outcome.
3. Methodology
3.1. Quantile regression
In the study, we interested to estimate the effect of differences in characteristics on the differentials in the household expenditure distribution between the remittance-receiving and non-receiving households. The effect of these characteristics on the expenditure distribution across the household groups is estimated using the quantile regression model (see, Koenker & Bassett, Citation1978; Koenker & Hallock, Citation2001). We preferred quantile regression on ordinary least square because estimates of the OLS are based on the mean of the dependent variable’s conditional distribution and ignore the differential impact of exogenous variables along the conditional distribution (See figure for disrtibution of dependant variable). Moreover, if exogenous variable influence the parameters of the conditional distribution of the dependent variable other than the mean, then OLS will be inadequate to meet the research agenda (Martins & Pereira, Citation2004). The estimates of the quantile are robust than the estimates of the OLS model in the presence of the outlier and it has been observed that expenditure per capita comprises outliers. We shall compare the differences in expenditure per capita in remittance-receiving and non-receiving household at the lower, middle, and upper quantile. For this purpose, quantile regression is more suitable because it provides insights on the different points of a conditional distribution. The conditional quantile function given the covariates X can be expressed as follows:
Where is the natural log of the expenditure per capita,
is a vector of covariates (demographics of household, characteristics of household head),
vectors of different quantile coefficient,
refers to the specific quantile and the subscript i represents the ith household. The conditional quantile regression assumes the linearity of the y on X across the quantile, and the conditional quantile of y can be estimated for the specific percentile,
.
3.2. Blinder-Oaxaca decomposition
We estimate the factors contributing to the expenditure gap using the Blinder-Oaxaca decomposition technique proposed by (Blinder, Citation1973; Oaxaca, Citation1973). Let and
be the natural log of expenditure per capita of the remittance-receiving and non-receiving households. Given the covariates X, the regression model can be expressed as follows:
Where, is a vector of covariates (demographics of household, characteristics of household head),
vectors of parameters,
is an error term,
refers to the remittance-receiving household (
) and non-receiving household (N
).
Let is an estimate for
and estimated by using the least square method from the sample of remittance-receiving and non-receiving households,
is estimated by
. Then, the average expenditure gap between the remittance-receiving and non-receiving households is:
Where is a vector of coefficient estimated by the least square method from the pooled sample of remittance-receiving and non-receiving households (Neumark, Citation1988).
and
are vectors of the coefficients estimated by least square from the sample of remittance-receiving and non-receiving household, respectively.
and
are vectors comprising the mean value of the covariates of the remittance-receiving and non-receiving households, respectively. The first term of the Equationequation 4
(4)
(4) explains the difference in the average expenditure per capita due to differences in household characteristics (endowment or quantity effect), and the second term is the differences in expenditure due to differences in coefficient (coefficient effect or price effect).Footnote1
3.3. Quantile decomposition
Another objective of the study is to decompose inequality differences ( between the remittance-receiving and non-receiving households at any quantile
. For this purpose, we use the quantile decomposition approach proposed by Melly (Citation2006). This approach is an extension of the Blinder (Citation1973) and Oaxaca (Citation1973) decomposition technique which was based on the average effects. Given the covariates X, the regression model can be expressed as follows:
Where R = remittance-receiving household, NR = non-receiving household. The first term of the equation explains the difference in the expenditure per capita due to differences in coefficient, and the second term is the differences in household characteristics at any quantile. We use the Stata command rqdeco to estimate the parameter of the quantile regression model.Footnote2
4. Data and descriptive analysis
4.1. Data source
The data used in the analysis is sourced from the Pakistan Bureau of Statistics (PBS) official website. We used the Pakistan Social and Living Standard–Household Integrated Economic (PSLM—HIES 2018–2019) Survey. In the current round of PSLM—HIES 2018–2019 merged the PSLM and HIES survey, whereas, before 2019, PBS surveyed PSLM and HIES separately. The current round of PSLM—HIES survey covered 24,809 households. While after removing the missing observation, the sample size available for analysis is 20,568 households in urban and rural areas of four provinces named Punjab, Khyber Pakhtunkhwa, Sindh, and Balochistan. It is a comprehensive survey consisting of information on household characteristics related to socio-economic status, total expenditure, food insecurity experience scale, household income from all sources, remittances, and other transfer receipt. In addition, the dataset comprises individual related characteristics, i.e. household residents, including demographics, age, education, labour force status, occupation, health, ICT usage, and gender autonomy. However, most of the variables used in the study are almost household level than the individual level. In the analysis, most variables are binary outcomes, and some are continuous. The definition of the variables used in the analysis is given in Table .
Table 1. Definition of the variables used in analysis
4.2. Descriptive analysis
Descriptive statistics in Table depict that most of the variables are binary, and the mean value of the binary variable shows the proportional share of outcome coded 1 in the total. For instance, the mean value of urban indicates that a smaller proportion of internal and external migrants belong to urban areas than rural ones. The average annual income per capita in our sample is reported by household is almost 69,969PKR, which is consistent with the estimates of the World Bank, which depicts that the GNI of Pakistan is almost 60,019PKR.Footnote3 However, this upward biasness can be adjusted after proper weighting estimating the household sample’s income per capita. The monthly income of the external remittance-receiving household is higher than the internal remittance and non-remittance receiving household. It supports the idea that returns to migration are higher than native country jobs (Borjas, Citation1989). The monthly minimum wage in 2018 was 15,000PKR in Pakistan.Footnote4 Likewise, the size of the monthly internal remittance is just above the minimum wage rate. While monthly remittance received is two-fold the minimum wage, indicating higher returns to migration than staying in the country. At the same time, internal remittances are just above the minimum wage level, indicating that higher returns are also associated with internal migration.
Table 2. Descriptive analysis of variables
The migration of a member is associated with higher income which in turn increases the living standard of migrant households (Salifu et al., Citation2016). This fact can be confirmed from Table that expenditure per capita is higher in internal/external remittance-receiving households than the non-receiving household. The monthly per capita expenditure of 4050PKR is a poverty threshold for 2019.Footnote5 The expenditure per capita in the internal/external remittance-receiving household is higher than in the non-receiving household. The non-receiving household is relatively more vulnerable because they are marginal to the poverty threshold. The interesting fact from Table reveals that per capita external remittances are above the poverty threshold level, implying that remittances are sufficient to uplift a household from poverty in the absence of other non-remittance income. Similar observed for the internal remittances, but solely internal remittances per capita are just below the level threshold of poverty and in the presence of other sources of income may also uplift households from poverty.
4.3. External remittances, internal remittances and expenditure over the decile
To examine the importance of the remittances in the household’s income, we presented Figure on the share of remittances per capita in household income per capita over the quantile generated based on expenditure per capita. It depicts that internal and external remittances contributed more than half of the total household income. The external remittance contributes 50% to 70% of the household’s total income over the quantile. Moreover, for higher quantile, the contribution of external remittance is also relatively higher. It implies that affluent groups can afford the migration to a developed country, resulting in higher remittances and a higher share of total income. Interestingly, in the internal remittance-receiving household, a lower quantile depicts a higher share of internal remittances in total income and a higher quantile with a lower share of internal remittances.
Figure 2. (a) Share of external and internal remittances per capita in total household income per capita. (b). Income and expenditure per capita across the household group. (c). Income, expenditure, remittances and non-remittance income in external remittances receiving household. (d). Income, expenditure, remittances, and non-remittance income in internal remittances receiving household.
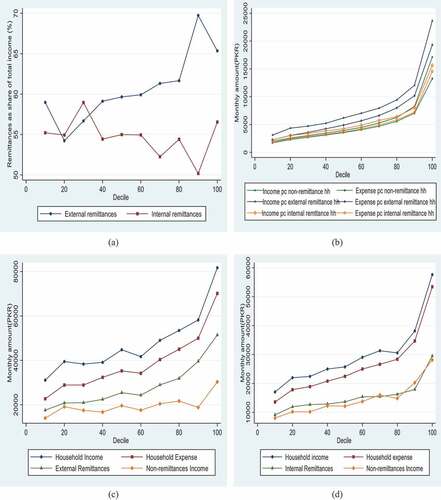
We present average per capita household income and expenditure in the external, internal and non-receiving households at a given quantile in Figure . It is observed that across the household categories, the level of income and expenditure per capita is higher in the external remittance-receiving household than in the internal and non-receiving households at a given quantile. This higher level of income and expenditure in the external remittance-receiving household is a victim of disparity across the household categories. In contrast, the level of per capita income and expenditure across the internal remittance-receiving and non-receiving households is almost puzzling across the quantile. The income per capita is higher in the internal remittance-receiving household at the lower quantile, while in the upper quantile, it is higher in the non-receiving household. On the other hand, expenditure per capita is almost identical in the internal remittance-receiving household to the non-receiving till the middle quantile. In comparison, the upper quantile is higher for the internal remittance-receiving household at the upper quantile.
Our observations show a more significant disparity within the external remittance-receiving household because the expenditure gap widens when moved from the lower quantile to the higher quantile. The observed difference is about five-fold in the monthly expenditure level of the first and last deciles. Undoubtedly, the primary source of disparity in household income is external remittances rather than non-remittance income because its contribution is higher in the total household income across the quantile distribution (see, Figure ). The presence of expenditure above the level of external remittances indicates the presence of non-remittance income in the household. Moreover, higher household income than the expenditure indicates the presence of savings in the household. Following the income and expenditure pattern in the external remittance-receiving household, a similar pattern was observed in the internal remittance-receiving household. However, there is no symmetry in the pattern of remittance and non-remittance income among external and internal remittance-receiving households (see, Figure ).
4.4. Spatial pattern of expenditure, external remittances, and internal remittances
The spatial distribution of the expenditure per capita across the administrative division of Pakistan is given in Figure . The weighted mean expenditure showed more disparity when we moved north to south. The federal capital of Pakistan (Islamabad), the provincial capital of Punjab (Lahore) and Sindh (Karachi) show a higher level of expenditure when compared with other regions. In the KPK, a lesser number of divisions are vulnerable. Only Bannu and D.I. Khan depict a per capita below the monthly poverty threshold (4050PKR). While in Punjab, only Dera Ghazi Khan depicts the per capita lower than the monthly poverty threshold level. On the other hand, 4 out of 6 divisions of Balochistan are expenditure per capita more petite than the monthly poverty threshold level.
Figure 3. (a).Spatial pattern of expenditure per capita. (b). Spatial pattern of external remittances. (c). Spatial pattern of internal remittances. (d). Spatial pattern of internal vs external remittances.
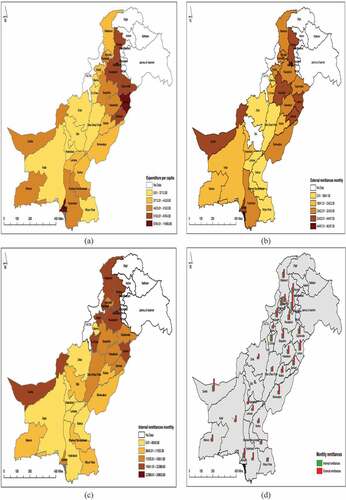
The spatial distribution of the monthly external remittances across the administrative division of Pakistan is given in Figure . The weighted monthly external remittances show more disparity across the administrative division of Pakistan. The higher external remittances in KPK are due to migration due to a lack of economic opportunities due to the war on terror. The lower level of external remittances is observed in Sindh’s administrative division. Lower remittances indicate the unskilled migration from these administrative divisions. To conclude, the spatial analysis suggests that a division with lower external remittances depicts a lower expenditure per capita.
Similarly, the weighted monthly internal remittances show more discrimination across the administrative division of Pakistan (see, Figure ). A higher level of internal remittances was observed in the divisions of the KPK due to a lack of economic opportunities in the presence of a long-run war on terror. Punjab’s administrative divisions are also victims of higher internal remittances like Sindh and Balochistan. The spatial distribution of the monthly external and internal remittances inflow is presented in figure for comparison. It depicts a higher level of external remittances than the internal remittances across the regions. This implies that higher returns are associated with the external migration than the internal migration.
5. Results and discussion
5.1. Quantile regression results for expenditure inequality
Table reports the results of the conditional quantile and OLS regression model. It contains the effects of covariates included in the analysis on the household expenditure per capita level for each household category across the following percentiles (10th, 25th, 50th, 75th, and 90th). The results support the choice of quantile regression over the OLS for the expenditure per capita because for a variable at each given quantile, the estimates of the quantile regression are different from estimates of the OLS model (see, Table or ). Among the control variables, the results that are even with our expectations are: higher monthly income and urban location correlate with more expenditure per capita, whereas more household members, dependency ratio, age of head, and less developed province correlate with lower expenditure per capita. The remainder of this section will focus on the patterns concerning whether a household received remittances.
Table 3. Estimates of quantile and OLS regression
The results suggest that external remittance-receiving household is significantly higher in expenditure per capita across the distribution vis-à-vis household without migrant. This finding is in line with the descriptive analysis, which states that average monthly expenditure per capita across the quantile is higher in external remittance-receiving households (see, Figure ). It is also observed that the income of the external remittance-receiving household is higher than the non-receiving household. It supports the impression of ‘new economic of labour migration” that households send migrants to increase their income/wealth, which decreases the deprivation in the community (Oded Stark & Yitzhaki, Citation1988). However, wealthy households send migrants to diversify the risk associated with household income/assets due to domestic shocks (Stark, Citation1984; Stark & Levhari, Citation1982; Stark & Taylor, Citation1991). These motives for migration result from higher remittances and, in turn, higher levels of expenditure per capita in the community. Finally, our results empirically support the idea that external remittances raise the household welfare by increasing the expenditure per capita. It underpins the direct effect of the remittance in the poverty alleviating process and stimulating the economic development of Pakistan.
Our findings pertaining to the increase in expenditure inequality in the presence of external remittance receipt are consistent with the findings of Bang et al. (Citation2018). External migrant remittances have a more substantial positive effect on the affluent and poor households. For instance, expenditure per capita in the remittance-receiving household is 6.68% higher at the lower end and 6.55% higher at the highest end compared with non-receiving households. While the benefit to external migration is higher for the affluent household (above 90th percentile) than for the poor one (see, Figure ). Moreover, the estimates of the external remittance support the “hollowing out of the middle,” as pointed out by Bang et al. (Citation2018). It implies that the benefits of the external remittances are more concentrated in the poor (10th percentile) and affluent households (90th percentile). Lower-middle to upper-middle-class households still gain considerably less than either side of the distribution.
Figure 4. Effect of internal and external remittance receipt on expenditure by quantiles.
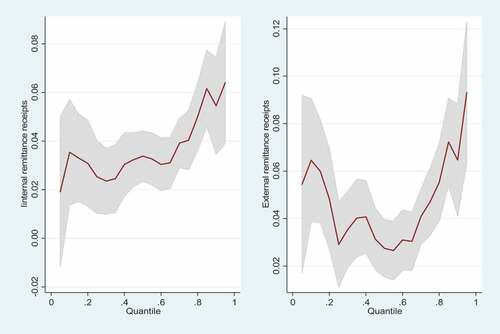
Our results suggest that internal migrant remittances positively affect all distribution levels; however, the magnitude is the strongest for households in the upper quantiles. For instance, households in the 10th percentile spend 3.43% more and 4.94% more in the 90th percentile compared with the non-receiving household (see, Table ). The result confirms that internal migrant remittances increase expenditure inequality at the household level compared to non-migrant households, which is consistent with the findings of Ahmed et al. (Citation2021). The study’s findings imply that if remittances are unequally distributed and flow disproportionately towards households at the top of the expenditure distribution, their contribution to inequality will be positive. However, if they are unequally distributed but target poor households, remittances may equalise the expenditure distribution.
5.2. Blinder-Oaxaca decomposition results of expenditure inequality
The decomposition output reports the mean predictions by groups and their difference in Table . In our sample, the mean log expenditure per capita is 8.293 for the non-remittance receiving household and 8.616 for the external-remittance receiving household, yielding an expenditure gap of 0.323 log points (see, Table , model 1). This gap is due to differences in endowment, coefficient and interactive effect. The effect of the endowment would reflect the mean increase in the expenditure in the non-remittance receiving household if they had the same characteristics as the external remittances receiving household. The increase of 0.242 log points in expenditure per capita of non-remittance receipt households is due to the endowment level of external-remittance receiving households, contributing almost 75% to the expenditure gap. The difference in expenditure due to the coefficient/differential effect is only 0.014 log points or 4% of the total gap, but this effect is statistically insignificant. While the “interaction part” suggest that 0.067 log point or 21% of the expenditure gap is due simultaneous effect of differences in endowment and coefficient. Finally, it is found that a considerable portion of expenditure inequality between external and non-migrant households is due to differences in the per capita expenditure distribution.
Table 4. Decomposition of inequality in expenditure by using Blinder-Oaxaca decomposition
Although mean expenditure in internal remittance receipt household is 0.033 log points higher when compared with the non-remittance receipt household. However, its decomposition effect is puzzling because the endowment effect suggests that the current level of the endowment is not benefitting the internal remittance-receiving household. However, the coefficient effect and interactive effect constitute a significant expenditure gap among the households’ internal and non-remittances receipt households.
We also observed a difference in the expenditure of internal remittance-receiving households compared to external remittance-receiving households (see, Table , model 3). The primary source of this gap is an endowment contributing 93% of the gap. The decomposition results indicate that the primary source of expenditure inequality among the household categories is the endowment effect when comparing external remittance with non-remittance and internal remittance receipt households. The differences in expenditure arise for two reasons. First, the international migration of a family member is similar to the adoption of new production technology, which increases productivity and, in turn, widens the income/expenditure gap (Hobbs & Jameson, Citation2012). Second, international migration increases the human capital of the left behind, which improves the position of household characteristics that are major contributors to the expenditure gap (De & Ratha, Citation2012).
We also decompose the effect or contribution of each predictor in the expenditure gap across the household group in Table . The 75% expenditure gap is due to differences in characteristics among the external remittance-receiving and non-remittance receiving households. The factors that increase the gap are (gender of head, marital status, employment, region of Punjab, and monthly income) and other predictors are decreasing this expenditure gap. The most noticeable is the monthly income component because it contributes 95% to the expenditure gap, while the employment status of the household’s head contributes 6%.
Table 5. Blinder-Oaxaca Decomposition of differences in mean expenditure per capita
Notably, minute differences in mean expenditure per capita were observed in internal and non-remittance receipt households. Surprisingly, the unexplained portion is a significant source of the expenditure gap, while the explained part suggests that the current level of covariates of internal remittance receipt household decreases the expenditure gap. Monthly income is a major source of decreasing the expenditure gap.
The difference in expenditure between external and internal remittance recipient households is 0.28 log points. The major contribution to this expenditure gap is due to the endowment portion while by factor share the household head’s employment (2%), education (5%), region Punjab (6%), and household income (128%). This result suggests that expenditure disparity across the household groups is primarily associated with household income, and in the external remittance-receiving household, more than 55% to 70% share of external remittance inflow is (see, Figure ). To conclude, the decomposition model findings suggest that the major share of the expenditure gap across the household group is a higher household income level in the external remittance-receiving household. The presence of external remittances soften the credit constraints and allows the left behind member to undertake investment project and increase the household income (Aparicio & Meseguer, Citation2009).
5.3. Unconditional quantile decomposition approach
In the previous section, we presented the Blinder-Oaxaca decomposition technique, which is based on the mean value of the given predictor rather than any given quantile. Table presents the quantile decomposition technique proposed by Melly (Citation2006). The quantile endowment effect (QEE) tells us how much the difference is due to household characteristics, while the quantile coefficient effect (QCE) shows how strong the effect is attributable to differentials in household expenditure relationships across the remittance categories.
Table 6. Decomposition of unconditional quantile functions
The distribution of the expenditure gap over the quintile suggested the 0.1 log point to 0.4 log point expenditure gap for the external and non-remittance receiving households (see, Figure ). Most of these differences arise because of differences in endowment and coefficient effect. Significant differences are due to the endowment rather than the coefficient effect. The aggregate expenditure differential is higher at the 90th quantile than at the 10th quantile. We determine that much of the discrimination occurs at the highest quantiles. Moreover, this implies that external remittances create more discrimination for the affluent household than the poor ones.
Figure 5. (a)Treatment and endowment effect of external remittance vs no remittance receiving household. (b). Treatment and endowment effect of internal remittance vs no remittance receiving household. (c). Treatment and endowment effect of external remittance vs internal remittance receiving household.
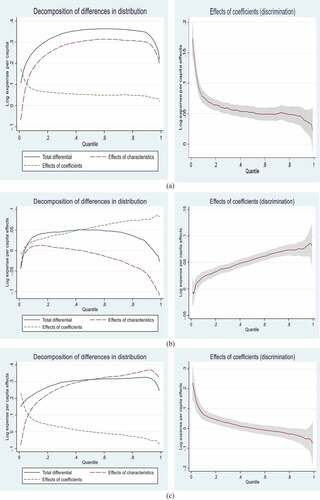
The expenditure gap across the quantiles for the internal remittances-receiving household and non-receiving is consistent with estimates of the Blinder-Oaxaca decomposition (discussed in the previous section). Although the internal remittance-receiving household is spent more across the quantile, the current endowment stock does not give an advantage to the internal remittance-recipient household (see, Table model 2). On the other hand, most of the differences in expenditure are due to the coefficient effect. The expenditure gap follows the inverted-U pattern, which states that less discrimination occurs at the distribution’s bottom and upper end (see, Figure ). In contrast, much discrimination occurs in the middle of the distribution.
The expenditure gap remains positive across the quantile when we compare the external remittance-receiving household with the internal remittance-receiving household (see, Table , model 3). The primary source of discrimination is the endowment rather than the coefficient effect. Finally, the external remittance-receiving household spends more than the internal and non-receiving household. This discrimination is due to higher household income in the external remittance-receiving household across the distribution. Higher household income in the external remittance-receiving household implies that external remittances enable the household to climb up the economic ladder and widen the expenditure gap.
6. Conclusion
This study aims to examine the effect of external and internal remittances on household expenditure inequality. For empirical analysis, we used the data of the PSLM—HIES 2018–2019 survey. The study identified that external remittance-receiving household is significantly higher in expenditure per capita across the distribution vis-à-vis internal migrant or without migrant household. Our findings suggest that external remittances increase the expenditure inequality across the household. The study also concludes that the primary source of the expenditure gap among the household categories is the endowment effect, while the current endowment level is higher in the external remittances-receiving household than in the internal or non-receiving household. Among the factors in the endowment, the relatively higher income of the external remittance-receiving household significantly contributes to the expenditure gap across the household categories. While external remittances comprise more than half the share of the household income. The findings from the quantile decomposition suggest that external remittances cause more discrimination for the affluent household than the poor ones.
More specifically, our study support the facts that external remittance is a potential source of expenditure inequality across the household groups. The expenditure gap can be slide down or improvement in expenditure distribution can be achieved by providing access to international migration to the poor household and softening the financial constraints related to the cost of migration. These constraints can be partially overcome by providing or improving credit access to poor households. Moreover, liberalized migration policies by the developed economies are an essential source of ease of migration access, which can improve expenditure distribution.
The findings imply that external remittances disproportionately benefit the richer than the poor and widen the expenditure distribution. This type of expenditure inequality is subject to efficiency rather than equity. However, relevant stakeholders can directly attain efficiency by exploring the untapped potential of the economy, which, in turn, raises the level of living.
Disclosure statement
No potential conflict of interest was reported by the author(s).
Additional information
Funding
Notes on contributors

Waqas Shair
Waqas Shair is a Lecturer at Minhaj University Lahore, Pakistan. Presently, he is pursuing his Ph.D. from the University of the Punjab, Lahore, Pakistan. His core area of research encompasses Labor Economics, International Economics, Development Economics and Applied Microeconomics. He has published research papers in international and local journals. He is also an author of different newspaper columns on current economic issues published in “The Nation,” “Daily Times,” and “Global Village Space”.
Notes
1. For more on the Blinder-Oaxaca decomposition technique, see Rahimi and Nazari ()
2. For more on the quantile decomposition, see: Melly, B. (2007). Rqdeco: a Stata module to decompose differences in distribution: mimeo. Retrieved 2008–02-03, from: http://www.alexandria.unisg.ch/publications/40161
5. To estimate the monthly expenditure per capita threshold of poverty: $30 per month multiplied by the average exchange rate of 136PKR/USD for the year 2019, which would be 4,050PKR
References
- Ackah, C., & Medvedev, D. (2012). Internal migration in Ghana: Determinants and welfare impacts. International Journal of Social Economics, 39(10), 764–27. https://doi.org/10.1108/03068291211253386
- Adams, R. H., Jr. (2004). Remittances and poverty in Guatemala. World Bank Policy Research Working Paper 3418. https://doi.org/10.1596/1813-9450-3418
- Adams, R. H., Cuecuecha, A., & Page, J. (2008). The impact of remittances on poverty and inequality in Ghana. Policy Research Working Paper No. 4732. Washington, DC: World Bank. https://doi.org/10.1596/1813-9450-4732
- Adams, R. H., & Mahmood, Z. (1992). The effects of migration and remittances on inequality in rural Pakistan [with comments]. The Pakistan Development Review, 31(4), 1189–1206. https://doi.org/10.30541/v31i4IIpp.1189-1206
- Ahmed, F., Dzator, J. A., & Zhang, J. X. (2021). Remittances, income inequality and investment in Bangladesh. The Journal of Developing Areas, 55(1). https://doi.org/10.1353/jda.2021.0011
- Akita, T., & Miyata, S. (2008). Urbanization, educational expansion, and expenditure inequality in Indonesia in 1996, 1999, and 2002. Journal of the Asia Pacific Economy, 13(2), 147–167. https://doi.org/10.1080/13547860801923558
- Anyanwu, J. C. (2011), International Remittances and Income Inequality in Africa, Working Paper Series No. 135, African Development Bank.
- Aparicio, F. J., & Meseguer, C. (2009). Collective remittances and the state: The 3×1 program in Mexican municipalities. Mexico: CIDE. Mimeo.
- Arslan, A., & Taylor, J. E. (2010). Village level inequality, migration and remittances in ruralMexico: How do they change over time? Kiel Working Paper No. 1622. Kiel WorkingPaper.
- Awuse, N., Offi, P. T., & Acakpovi, A. (2020). Internal migration and poverty reduction in Ghana. International Journal of Technology and Management Research, 5(1), 72–90. https://doi.org/10.47127/ijtmr.v5i1.83
- Balisacan, A. M., & Fuwa, N. (2004) Changes in spatial income inequality in the Philippines, WIDER, research paper no. 2004 34
- Bang, J. T., Mitra, A., & Wunnava, P. V. (2016). Do remittances improve income inequality? An instrumental variable quantile analysis of the Kenyan case. Economic Modelling, 58, 394–402. https://doi.org/10.1016/j.econmod.2016.04.004
- Bang, J. T., Mitra, A., & Wunnava, P. V. (2018). Hollowing Out the Middle? Remittances and Income Inequality in Nigeria, IZA Discussion Papers, No. 11438, Institute of Labor Economics (IZA), Bonn.
- Bayraktar, Y., & Özyılmaz, A. (2017). The role of internal migration on regional inequality: Turkey example. Turkish Journal of Middle Eastern Studies, Special, 9–30.
- Becker, G. S. (1962). Irrational behaviour and economic theory. Journal of Political Economy, 70(1), 1–13. https://doi.org/10.1086/258584
- Blinder, A. S. (1973). Wage discrimination: Reduced form and structural estimates. Journal of Human Resources, 8(4), 436–455. https://doi.org/10.2307/144855
- Borjas, G. J. (1989). Economic theory and international migration. International Migration Review, 23(3), 457–485. https://doi.org/10.1177/019791838902300304
- Bouoiyour, J., & Miftah, A. (2014). The effects of remittances on poverty and inequality: Evidence from rural southern Morocco. Working Papers hal-01880333, HAL.
- Cuecuecha, A., & Adams, R. J. (2016). Remittances, household investment and poverty in Indonesia. Journal of Finance and Economics, 4(3), 12–31. http://dx.doi.org/10.12735/jfe.v4n3p12
- De, P. K., & Ratha, D. (2012). Impact of remittances on household income, asset and human capital: Evidence from Sri Lanka. Migration and Development, 1(1), 163–179. https://doi.org/10.1080/21632324.2012.719348
- Deshingkar, P., & Farrington, J. (2006). Rural labour markets and migration in South Asia: Evidence from India and Bangladesh. World development report 2008. World Bank.
- Devkota, J. (2014, March). Impact of migrants’ remittances on poverty and inequality inNepal. Forum of International Development Studies, 44, 36–53. https://www.gsid.nagoya-u.ac.jp/bpub/research/public/forum/44/03.pdf
- Dey, S. (2015). Impact of remittances on poverty at origin: A study on rural households in India using covariate balancing propensity score matching. Migration and Development, 4(2), 185–199. https://doi.org/10.1080/21632324.2014.979022
- Duval, L., & Wolff, F.-C. 2013, The consumption-enhancing effect of remittances: Evidence from Kosovo, WIIW Balkan Observatory Working Papers, No. 107, Vienna: The Vienna Institute for International Economic Studies.
- Economic Outlook. (2018). International monetary fund.
- Harris, J., & Todaro, M. (1970). Migration, unemployment and development: A two-sector analysis. American Economic Review, 60(1), 126–142.
- Hobbs, A. W., & Jameson, K. P. (2012). Measuring the effect of bi-directional migrationremittances on poverty and inequality in Nicaragua. Applied Economics, 44(19), 2451–2460. https://doi.org/10.1080/00036846.2011.564153
- Housen, T., Hopkins, S., & Earnest, J. (2013). A systematic review on the impact of internal remittances on poverty and consumption in developing countries: Implications for policy. Population, Space and Place, 19(5), 610–632. https://doi.org/10.1002/psp.1743
- Howell, A. (2017). Impacts of migration and remittances on ethnic income inequality in Rural China. World Development, 94, 200–211. https://doi.org/10.1016/j.worlddev.2017.01.005
- Jones, R. C. (2013). Migration stage and household income inequality: Evidence from the Valle Alto of Bolivia. The Social Science Journal, 50(1), 66–78. https://doi.org/10.1016/j.soscij.2012.08.001
- Kalim, R., & Shahbaz, M. (2009). Remittances and poverty Nexus: Evidence from Pakistan. International Research Journal of Finance and Economics, 29, 46–59. http://escholar.umt.edu.pk:8080/jspui/bitstream/123456789/285/1/Full%20View.pdf
- Kang, W. (2011). A microeconometric analysis of the welfare of households in Vietnam and China: Poverty, vulnerability and inequality. The University of Manchester (United Kingdom).
- Koch, M. Y., & Valdés, E. (2008), “Una mirada a la segregacion residencial en ciudadeslatinoamericanas: El caso de Porto Alegre (Brasil) y Cordoba (Argentina)”, Paper X Seminario Internacional Red Iberoamericano Globalizacion y Territorio, RII, Querétaro.
- Koenker, R., & Bassett, G. (1978). Regression quantiles. Econometrica, 46(1), 33–50. https://doi.org/10.2307/1913643
- Koenker, R., & Hallock, K. F. (2001). Quantile regression. Journal of Economic Perspectives, 15(4), 143–156. https://doi.org/10.1257/jep.15.4.143
- Kousar, R., Rais, S. I., Mansoor, A., Zaman, K., Shah, S. T. H., & Ejaz, S. (2019). The impact of foreign remittances and financial development on poverty and income inequality in Pakistan: Evidence from ARDL - Bounds testing approach. The Journal of Asian Finance, Economics and Business, 6(1), 71–81. https://doi.org/10.13106/jafeb.2019.vol6.no1.71
- Lee, E. (1966). A theory of migration. demography. Population Association of America, 3(1),47–57. http://www.jstor.org/stable/2060063
- Lenski, G. E. (1966). Power and Privilege. A Theory of Social Stratification, Volume 96. McGraw-Hill New York.
- Lewis, W. A. (1954). Economic development with unlimited supplies of labor. The Manchester School, 22(2), 139–191. https://doi.org/10.1111/j.1467-9957.1954.tb00021.x
- Mankiw, N. G. (2019). Macroeconomics. New York.
- Martins, P. S., & Pereira, P. T. (2004). Does education reduce wage inequality? Quantile regression evidence from 16 countries. Labour Economics, 11(3), 355–371. https://doi.org/10.1016/j.labeco.2003.05.003
- Melly, B. (2006), ‘Estimation of counterfactual distributions using quantile regression’, a chapter of the PhD thesis submitted to the University of St. Gallen in Switzerland. http://www.alexandria.unisg.ch/publications/22644
- Molini, V., Pavelesku, D., & Ranzani, M. (2016). Should I stay or should I go? Internal migration and household welfare in Ghana. Internal Migration and Household Welfare in Ghana (July 20, 2016). World Bank Policy Research Working Paper, (7752).
- Murodova, S. (2018). Impact of remittances and international migration on poverty in CentralAsia: The cases of the Kyrgyz Republic, Tajikistan, and Uzbekistan. Journal of AppliedEconomics & Business Research, 8, 1.
- Neumark, D. (1988). Employers’ discriminatory behavior and the estimation of wage discrimination. Journal of Human Resources, 23(3), 279–295. https://doi.org/10.2307/145830
- Nilsson, B., & Ramadan, R. (2020). Migration and Inequalities around the Mediterranean Sea. ERF working paper no. 1390, Economic Research Forum Working Paper Series.
- Oaxaca, R. (1973). Male-female wage differentials in Urban Labor Markets. International Economic Review, 14(3), 693–709. https://doi.org/10.2307/2525981
- Randazzo, T., & Piracha, M. (2019). Remittances and household expenditure behaviour: Evidence from Senegal. Economic Modelling, 79, 141–153. https://doi.org/10.1016/j.econmod.2018.10.007
- Salifu, M., Al-Hassan, S., & Saani, M. R. (2016). External migrant remittances and household expenditure patterns in Ghana. Africa Development and Resources Research Institute Journal, 25(4), 1–23. Ghana: Vol., No. (3).
- Shams, K., & Kadow, A. (2020). Income inequality, remittances and economic wellbeing in rural Pakistan: Linkages and empirical evidence. Asia-Pacific Journal of RegionalScience, 4(2), 499–519. https://doi.org/10.1007/s41685-020-00151-x
- Siddiqui, R., & Kemal, A. R. (2006). Remittances, trade liberalisation, and poverty in Pakistan: The role of excluded variables in poverty change analysis. The PakistanDevelopment Review, 45(3), 383–415. https://doi.org/10.30541/v45i3pp.383-415
- Sjaastad, L. (1962). The costs and returns of human migration. Journal of Political Economy, 70(5), 80–93. https://doi.org/10.1086/258726
- Stark, O. (1984). Rural-to-urban migration in LDCs: A relative deprivation approach. Economic Development and Cultural Change, 32(3), 475–486. https://doi.org/10.1086/451401
- Stark, O., & Bloom, D. E. (1985). The new economics of labor migration. American Economic Review, 75(2), 173–178. https://www.jstor.org/stable/1805591
- Stark, O., & Levhari, D. (1982). On migration and risk in LDCs, Economic Development and Cultural Change. 31, 191–196. https://www.jstor.org/stable/20007250
- Stark, O., & Taylor, J. E. (1991). Migration incentives, migration types. the Role of Relative Deprivation, the Economic Journal, 101, 1163–1178. https://www.jstor.org/stable/2234433
- Stark, O., & Yitzhaki, S. (1988). Labor migration as a response to relative deprivation. Journal of Population Economics, 1(1), 57–70. https://doi.org/10.1007/BF00171510
- Tsaurai, K. (2018). The impact of remittances on poverty alleviation in selected emerging markets. Comparative Economic Research. Central and Eastern Europe, 21(2), 51–68. https://doi.org/10.2478/cer-2018-0011
- UNDP’s Pakistan. (2020). National human development report.
- World Bank. (2020). World development indicators.
Appendix
Figure A1. Quantile plot of log expenditure per capita.
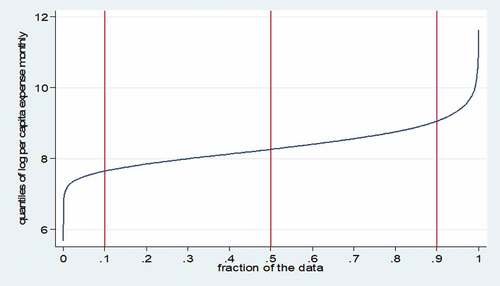
Figure A2. Distribution of expenditure per capita.
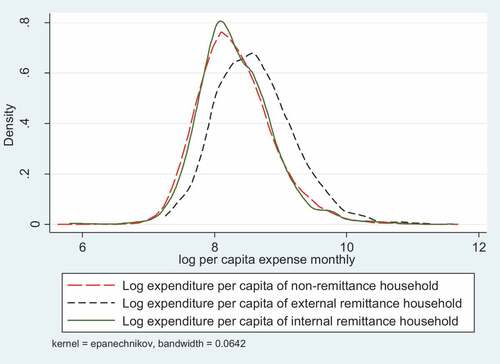
Figure A3. Quantile plot of Expenditure per capita
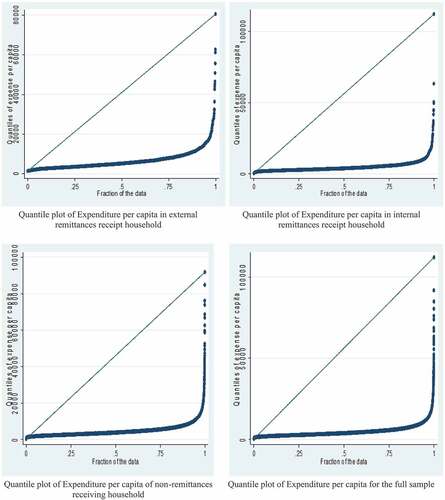
Figure A4. Estimates of quantile regression comparing with the estimates of OLS.
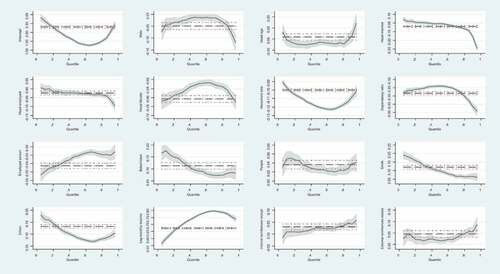
Table A1. Results of quantile regression