Abstract
Prostaglandin E2 (PGE2) is produced in the brain during infectious/inflammatory diseases, and it mediates acute-phase responses including fever. In the recovery phase of such diseases, PGE2 disappears from the brain through yet unidentified mechanisms. Rat prostaglandin transporter (PGT), which facilitates transmembrane transport of PGE2, might be involved in the clearance of PGE2 from the brain. Here, we examined the cellular localization of PGT mRNA and its protein in the brains of untreated rats and those injected intraperitoneally with a pyrogen lipopolysaccharide (LPS) or saline. PGT mRNA was weakly expressed in the arachnoid membrane of untreated rats and saline-injected ones, but was induced in blood vessels of the subarachnoidal space and choroid plexus and in arachnoid membrane at 5 h and 12 h after LPS injection. In the same type of cells, PGT-like immunoreactivity was found in the cytosol and cell membrane even under nonstimulated conditions, and its level was also elevated after LPS injection. PGT-positive cells in blood vessels were identified as endothelial cells. In most cases, PGT was not colocalized with cyclooxygenase-2, a marker of prostaglandin-producing cells. The PGE2 level in the cerebrospinal fluid reached its peak at 3 h after LPS, and then dropped over 50% by 5 h, which time point coincides with the maximum PGT mRNA expression and enhanced level of PGT protein. These results suggest that PGT is involved in the clearance of PGE2 from the brain during the recovery phase of LPS-induced acute-phase responses.
Abbreviations
| PGE2 | = | prostaglandin E2 |
| PGT | = | prostaglandin transporter |
| COX-2 | = | cyclooxygenase-2 |
| LPS | = | lipopolysaccharide |
| CSF | = | cerebrospinal fluid |
| DIG | = | digoxigenin |
| PBS | = | phosphate buffered saline. |
Introduction
Prostaglandin E2 (PGE2) in the brain is the final mediator of fever.Citation1-6 The mechanism of PGE2 production in the brain during infection/inflammation is now well documented: upon a systemic challenge with pyrogens, the immune system releases inflammatory cytokinesCitation7 that are carried by the blood flow to brain endothelial cells to induce PGE2-synthesising enzymes, including cyclooxigenase-2 (COX-2)Citation8 and microsomal-type prostaglandin E synthase.Citation9-12 PGE2 is biosynthesized there and released into the brain. Then, PGE2 acts on the EP3-positive hypothalamic neurons, by which the neural pathway of fever is activated.Citation13,14
On the other hand, what causes the termination of fever remains unknown. To cease the febrile response, the brain PGE2 level should be lowered. However, prostaglandins, including PGE2, are not effectively metabolized in the adult brain.Citation15 In addition, they are charged organic anions at physiological pH, and their membrane permeability is fairly lowCitation16; thus, it is unlikely that PGE2 disappears from the brain by simple diffusion. Therefore, the following scenario of PGE2 clearance has been suggested: the removal of prostaglandins from the brain is mediated by a specific transport mechanism across the blood-brain or blood-cerebrospinal fluid (CSF) barrier, and final metabolism of PGE2 is performed by other tissues, e.g., the lung.Citation15,17 Indeed, some pioneering studies showed that febrile response was enhanced when the animals were treated with organic anion transport inhibitors, such as bromcresol green and probenecid, which inhibit the transport of prostaglandins.Citation18,19 As a candidate molecule of prostaglandin carriers, the prostaglandin transporter (PGT), or solute carrier organic transporter family 2A1 (SLCO2A1), and its gene were first identified in rats,Citation20 and then in humans and mice.Citation21,22 PGT has high affinity for PGE2, PGF2α, PGD2 and PGH2; and it transports them across the plasma membrane in an energy-requiring fashionCitation23,24 and bromcresol green-sensitive manner.Citation20 PGT is likely to mediate the uptake of PGE2 into cells rather than the release of it from them.Citation17,25
Based on these physiological and molecular background data, we hypothesized that PGT is involved in the clearance of PGE2 from the brain during the recovery phase of fever. In this study, as the first step to examine this hypothesis, we investigated, using in situ hybridization and immunohistochemical techniques, if PGT is present in the central nervous system or induced there after systemic LPS stimulation.
Results
Localization PGT in the central nervous system
PGT mRNA was induced in a certain type of blood vessels and the arachnoid membrane 5 h after intraperitoneal injection of LPS (), but not after saline injection (). As for blood vessels, such signals were restricted to venous-type blood vessels in the subarachnoidal space and choroids plexus (); PGT mRNA signals were found neither in arteries of the subarachnoidal space nor in any type of blood vessels in brain parenchyma. As for the arachnoid membrane, PGT mRNA was found at the entire brain surface. Similarly, in the spinal cord, we found LPS-induced expression of PGT mRNA in the arachnoid membrane and the subarachnoidal veins or velunes (). Detailed observation revealed that the arachnoid membrane, but not the blood vessels, constitutively expressed a low level of PGT mRNA under non-stimulated conditions, i.e., in saline-injected rats () and untreated rats (). There were no such signals when the sections were hybridized with the sense RNA probe ().
Figure 1. Expression of PGT mRNA in the subarachnoidal space (a, b, c) and choroid plexus (d, e) of the brain and in the subarachnoidal space of the spinal cord (f, g). (A, D, F) 5 h after saline injection, (B, E, G) 5 h after LPS injection, (C) hybridization with sense probe (5 h after LPS injection). PGT mRNA was expressed in the arachnoid membrane (arrowheads), subarachnoidal blood vessels (arrows), and blood vessels in the choroid plexus (asterisk) after the LPS injection. A line drawing at the upper right corner indicates brain regions corresponding to a–e. Scale bar: 50 µm.
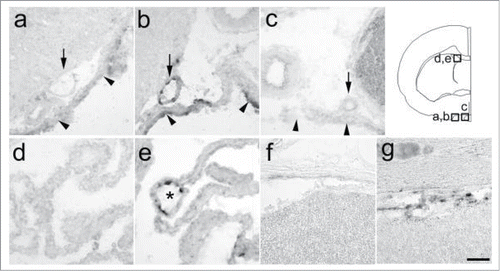
Figure 2. Time-dependent expression of PGT mRNA in the brain subarachnoidal space. (A) untreated rat, (B) 1.5 h, (C) 3 h, (D) 5 h, (E) 12 h, (F) 24 h, (G) 48 h after the LPS injection. (H) 5 h after the saline injection. Levels of PGT mRNA in the arachnoid membrane (arrowheads) and subarachnoidal blood vessels (arrows) reached their peak at 5 h after the LPS injection. Inlets show 3-times magnified views of blood vessels. Scale bar: 100 µm.
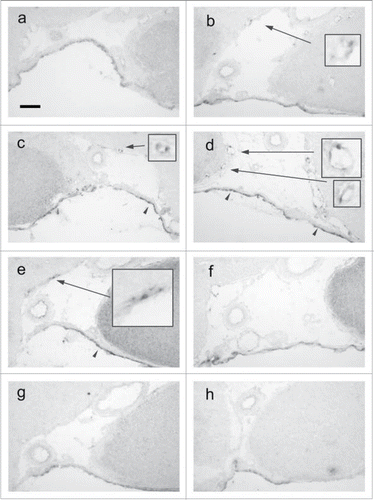
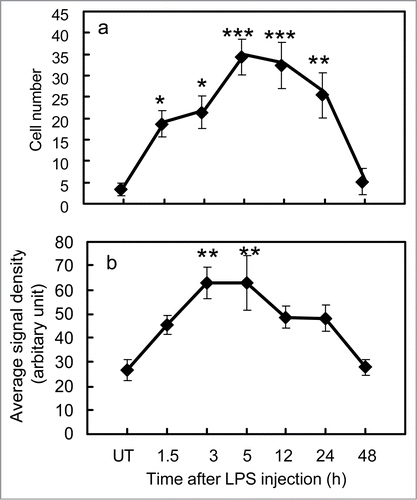
shows the appearance of PGT mRNA at each time points after LPS injection. PGT mRNA signals started to increase by 1.5 h (), reached their highest level at 5 h (), still remained at high levels until 12 h (), and then declined to the basal level by 48 h () after the LPS injection. PGT mRNA signals in the blood vessels were spot-like and countable. This uneven distribution of PGT mRNA signals within vascular cells probably represented perinuclear distribution of rough endoplasmic reticulum-bound PGT mRNA. On the other hand, PGT mRNA in the arachnoid membrane was spread along the whole cell and uncountable. Because of these differences, we semiquantified the PGT mRNA signals in blood vessels and arachnoid membrane in different ways (details were described in Materials and Methods). In blood vessels, the number of PGT mRNA-positive cells started to increase by 1.5 h, reached its peak at 5 h, and remained high until 12 h, and then declined to the basal level by 48 h after the LPS injection (). In the arachnoid membrane, the signal intensity of PGT mRNA became elevated earlier than that in the blood vessels: it rose to a high level by 3 h, reached the maximum at 5 h, and then slightly declined by 12 h and returned to the basal level by 48 h after the LPS injection (). In either tissue, PGT mRNA signals were most intense at 5 h after LPS injection.
Figure 3. Semiquantitative analysis of PGT mRNA. (A) changes in the number of PGT mRNA-positive cells in blood vessels in the subarachoidal space after LPS injection, (B) changes in signal intensity of PGT mRNA in the arachnoid membrane after LPS injection. The values denoted by asterisks were significantly different from that of UT (untreated) group (*P < 0.05, **P < 0.01, ***P < 0.001).
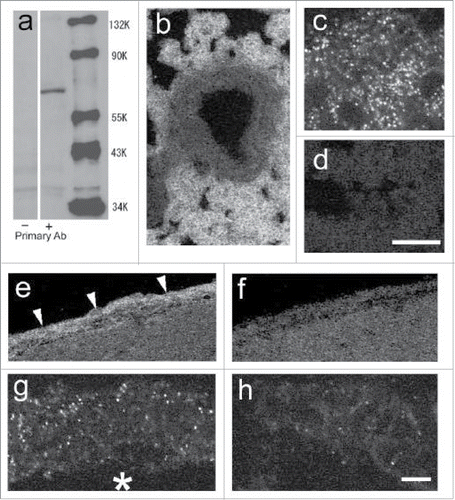
We examined PGT protein localization as well by immunohistochemistry. Western blotting revealed that the antibody used for the immunohistochemistry properly recognized a single protein band (), which is close to the deduced molecular weight of rat PGT (70.5 kD).Citation26 To find the best conditions for tissue fixation and antibody dilution, we immunostained the lung and kidney tissues, both of which are known to constitutively express high levels of PGT. The antibody was applicable to immunohistochemistry in acetone-fixed tissues with a dilution of 1:100. In the lung, alveolar cells, but not bronchial cells, consititutively expressed a high level of PGT protein (). In a magnified view, the PGT signals were expressed in a vesicular pattern (). Preabsorption of the primary antibody with PGT antigen peptide eliminated the staining (). In the brain, the arachnoid membrane () and subarachnoid blood vessels () of LPS-injected rats expressed PGT protein in a vesicular pattern. Preabsorbed antibody did not yield such staining ().
Figure 4. Expression of PGT protein. (A) Western blot of the rat brain (5 h after the LPS injection) with (+) or without (−) PGT antibody. (B–D) confocal microscopic views of the lung of saline-injected rat. (B) expression of PGT protein in the lung. (C) a magnified view of “b.” PGT is expressed in a vesicular pattern. (D) PGT antibody was incubated with the antigen peptide prior to assay. (E–H) confocal microscopic views of the brain sampled at 12 h after the LPS injection. (E) expression of PGT protein in the arachnoid membrane. (F) arachnoid membrane when incubated with the preabsorbed PGT antibody. (G) a magnified view of a blood vessel, which expressed PGT in vesicular pattern. The asterisk indicates the lumen of a blood vessel. (H) a magnified view of a blood vessel when incubated with the preabsorbed PGT antibody. Scale bars: 100 µm (b,d), 50 µm (e,f), 5 µm (c,g,h).
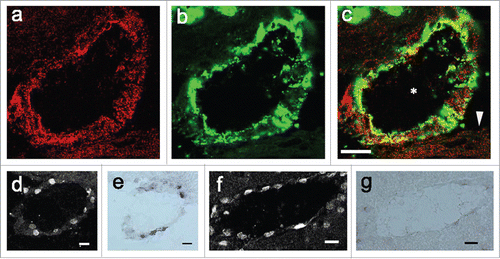
shows the time-dependent changes in the level of PGT protein after the LPS injection. The obtained PGT expression pattern was similar to that found in the in situ hybridization study: PGT was induced in the arachnoid membrane and the blood vessels, mainly those in the subarachnoidal space, after the LPS injection () but not after saline injection (). The intensity of PGT protein signals was highest at 12 h () and 24 h () after the LPS injection, at which time the elevation in the signal density was statistically significant compared to that of saline-injected one (). To determine the type of cells that expressed PGT in the blood vessels, we incubated some brain sections with antibody against von Willebrand factor, an endothelial cell marker, after they had been stained with PGT antibody (). PGT-positive cells in the blood vessels () were identified as endothelial cells ().
Figure 5. Expression of PGT protein in brain subarachnoidal space at each time point after LPS or saline injection. (A) 5 h after the saline injection (B) 5 h, (C) 12 h, (D) 24 h, (E) 48 h after the LPS injection. PGT was induced in venous blood vessels (asterisks) after the LPS injection. Scale bar: 20 mm (F) semiquantitative analysis of the signal intensity of PGT protein at 24 h after the LPS injection (closed bar) and 5 h after the saline injection (open bar). *P < 0.05.
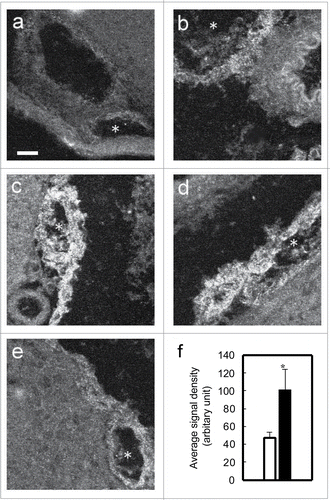
Figure 6. PGT protein localization in blood vessels. (A–C) confocal microscopic views of a venous blood vessel. (A) expression of PGT protein (B) expression of von Willbrand Factor, an endothelial marker. (C) double-stained image of PGT and von Willbrand Factor. PGT was expressed in endothelial cells of the venous blood vessels (whose lumen is indicated by the asterisk) and arachnoid membrane (arrowhead). (D, F) COX-2 protein expression in a subarachnoidal blood vessel (d) and a parenchymal blood vessel (f). (E, G) PGT mRNA expression in subarachnoidal blood vessel (e) in an adjacent section to (D) and in a parenchymal blood vessel (g) in an adjacent section to (F). PGT mRNA and COX-2 were coexpressed in subarachnoidal venous blood vessels. In parenchymal blood vessels, little PGT mRNA was expressed, whereas, COX-2 was expressed well. Scale bar: 20 µm.
Colocalization of PGT mRNA and COX 2-positive cells
To examine whether PGT mRNA is expressed in the same blood vessels as COX-2, we studied the COX-2 expression by using consecutive brain sections. In the subarachnoidal space, we found that PGT mRNA was expressed in the same blood vessels as COX-2 (). However, in the brain parenchyma, there were few PGT-positive blood vessels; whereas COX-2 positive blood vessels were found abundantly throughout the brain (). On the other hand, PGT mRNA-positive cells in arachnoid membrane were completely negative for COX-2. Thus, PGT and COX-2 were not colocalized in most cases with an exception of subarachnoidal veins.
PGE2 level in the CSF after LPS injection
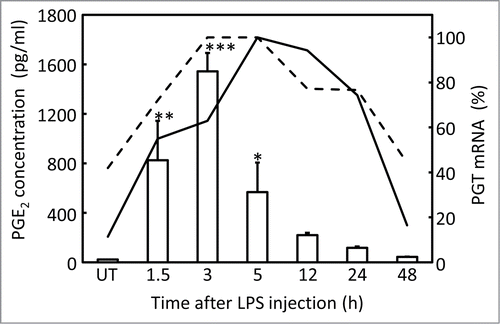
To obtain further insight into the relation between PGT and PGE2 in the brain, we also measured PGE2 concentration in the CSF, which was sampled just before decapitation. The PGE2 level in the CSF started to increase at 1.5 h, reached its maximum at 3 h, and then declined to less than half of the peak level at 5 h and returned to the basal level by 12 h after the LPS injection. shows the temporal relationship between the PGE2 concentration in the CSF (indicated by columns) and PGT mRNA expression in the blood vessels (solid line) and the arachnoid membrane (dotted line). In this figure, values of PGT mRNA signals were converted to a percentage of the maximum level obtained at 5 h after the injection. PGT mRNA signals reached the maximum level at 5 h after the LPS injection, at which time the PGE2 level was already declining, being in line with the hypothesis that PGT is involved in the clearance of PGE2 from the brain during the recovery phase of fever. Interestingly, PGT mRNA signals stayed relatively high for a while after the PGE2 level had returned to the basal level.
Figure 7. Time-course analysis of PGE2 concentration in the CSF (open columns), and PGT mRNA in the brain (subarachnoidal blood vessels: solid line, arachnoid membrane: dotted line) after LPS injection. Values of PGT mRNA signals were converted to a percentage of the maximum level obtained at 5 h after the injection. The original values and SE were shown in . PGE2 concentration denoted by asterisks were significantly different from that of UT (untreated) group (*P < 0.05, **P < 0.01, ***P < 0.001).
Discussion
Little is known about what is happening to PGE2 in the brain during the recovery phase of fever. Removal of excess amount of potent PGE2 from the brain is apparently necessary to terminate the febrile response and other acute phase responses involving PGE2. However, PGE2 can neither be metabolized in the brain nor traverse the plasma membrane effectively. This situation suggests the existence of a transport mechanism that is involved in the clearance of PGE2. In 1995, PGT, the first known specific transporter of prostaglandins, was molecularly identified in rats.Citation20 Rat PGT is widely expressed in the body and transports PGE2, PGF2α, and PGD2 with high affinity, thromboxane with intermediate affinity, and prostacyclin analogs with low affinity in an energy-dependent mannerCitation20. Here, we hypothesized that PGT is involved in the clearance of PGE2 from the brain during the recovery phase of fever. In the present study, for the first time, we demonstrated that both PGT mRNA and protein were expressed in venous blood vessels of subarachnoidal space and choroid plexus, and in the arachnoid membrane after systemic LPS injection. Ivanov et. alCitation27 reported that they could not find any significant change in the level of PGT mRNA in the brain after the intravenous injection of LPS. To examine the PGT mRNA, they used quantitative RT-PCR with homogenized hypothalamus, but we used the in situ hybridization technique, which has high spatial resolution. Our method probably allowed us to detect the local change in PGT in the brain more effectively. In fact, in the study of Ivanov et al.,Citation27 the PGT mRNA level in the hypothalamus increased slightly 5 h after the intravenous injection of LPS, though the increase was not statistically significant.
As discussed below, our present results and the available literature suggest that PGT is involved in the removal of PGE2 during the recovery phase of fever.
Possible role of PGT: removal of PGE2 from the brain or release of PGE2 into the brain?
There are 3 possible roles of PGT: release of newly synthesized PGE2 from endothelial cells, trans-endothelial transport of blood-borne PGE2 into the brain or removal of PGE2 from the brain. The first 2 may initiate PGE2 signaling, whereas the third one may terminate PGE2 signaling. However, the first one is unlikely for the following reasons: We found that COX-2-positive endothelial cells, which produce PGE2, did not always express PGT after systemic injection of LPS. In the brains of LPS-injected rats, PGT was well expressed in the blood vessels in the subarachnoidal space but not in the blood vessels in the brain parenchyma; whereas COX-2 was expressed in blood vessels throughout the brain. Conversely, the arachnoid membrane was negative for COX-2, but expressed PGT abundantly. If PGT had been involved in release of newly synthesized PGE2, we should have found colocalization of COX-2 and PGT in blood vessels throughout the brain. Our failure to do so implies that PGT is not releasing newly synthesized PGE2 from endothelial cells.
The following reports also ensure that PGT is not involved in the release of newly synthesized PGE2 from the endothelial cells: Although the intrinsic permeability of the plasma membrane to PGE2 is low, PGE2 can efflux from cells by simple diffusion.Citation23 The electrochemical driving force in a cell is considered far more likely to facilitate diffusive efflux of PGE2 than influx on the grounds that the inside-negative voltage of cells preferentially drives efflux of PGE2, which exists as a charged anion within the cells, and that accumulated protons in the cells lead to protonation of PGE2, which form also tends to efflux from the cells.Citation17 Endo et al.Citation28 compared bradykinin-induced PGE2 release between normal Madin-Darby canine kidney cells cells and PGT-transfected ones. There was no difference in PGE2 release between these 2 cell groups, indicating that PGT is not involved in the release of PGE2 from cells. On the other hand, several studies have demonstrated that multidrug resistance protein 4 (MRP4) is responsible for the release of PGE2 from cells.Citation29-32
It is demonstrated that the first phase of fever, which starts at approximately 30 min after systemic injection of LPS, is supported by trans-endothelial transport of blood-borne PGE2 into the brain.Citation33,34 PGT in endothelial cells might be involved in this process either by uptaking PGE2 from the blood or by releasing PGE2 into the brain. Indeed, we found that PGT protein is constitutively expressed in subarachnoidal endothelial cells. However, the level of constitutive PGT is low compared to that after LPS injection. PGT protein in endothelial cells reached the highest level between 12 h and 24 h after LPS injection, at which time PGE2 levels in the CSF has decreased almost to the basal level. Thus, the role of PGT induced in the later time is unlikely involved in the elevation of PGE2 in the brain.
The third possible role of PGT during fever is to remove PGE2 from the brain to terminate the febrile response, as we hypothesized. In fact, it was demonstrated that PGT mediates uptake of PGE2 into cultured cells against its concentration gradient.Citation23 It was also reported that PGT seemed to mediate uptake of prostaglandins in exchange for lactate, and that the degree of its PGE2 uptake is dependent on the lactate gradient created by intracellular glycolysis.Citation35
Through time course analysis, we found that the level of PGE2 in the brain reached its peak at as early as 3 h, and then declined to less than half of the peak level at 5 h after the LPS injection. On the other hand, around 5 h after the LPS injection, the expression of PGT mRNA reached its highest level and its protein level was also elevated. This observation implies that the decrease in the PGE2 level in the brain is linked to the removal of PGE2 by PGT. Interestingly, Inoue et al.Citation10 pointed out previously that levels of PGE2-synthesising enzymes in the brain and level of PGE2 in the CSF were correlated well in the early phase of fever. However, in the late phase of fever, when the level of PGE2 started to decrease, the levels of those enzymes were still increasing. This dissociation between the enzyme levels and PGE2 level was most remarkable at 5 h after the LPS injection, being in line with the time point at which the PGT mRNA level was highest. During the later phase of fever, newly expressed PGT may be effectively removing the excess amount of PGE2 from the brain while PGE2-synthesising enzymes are still producing PGE2 for a while. Thus, our time course data are in line with the hypothesis that PGT is involved in the removal of PGE2 during the recovery phase of fever. PGT protein was expressed well at 5 h: but, in fact, the peak time point of it was around 12 h and 24 h after the LPS injection, being somewhat later than the period when there might be the highest demand for the removal of PGE2. This later accumulation of PGT protein might be in preparation for the possible next attack of pathogens.
In our immunohistochemical study, PGT was expressed in a vesicular pattern and was localized along the plasma membrane and throughout the cytoplasm in the endothelial cells and arachnoid membrane. In line with this result, Bao et al.Citation36 also reported the vesicle-like expression of PGT in the rat kidney, and assumed that PGT is recruited to the plasma membrane by exocytosis, as is the case with many transporters. We assume that, during the recovery phase of fever, PGT is recruited to the plasma membrane of endothelial cells to mediate uptake of PGE2 from the CSF. The efflux of PGE2 across the plasma membrane of endothelial cells might occur by simple diffusion, or through MRP4. Then PGE2 enters the blood flow to be metabolized by other organs, such as the lung.
We have no idea about the destination of PGE2 after it is taken up by the arachnoid membrane. The arachnoid membrane is not vascularized very well. PGE2 might be carried to blood vessels in the dura mater, which is juxtaposed to arachnoid membrane and well vascularized. Another possibility is that there are PGE2-catabolizing enzymes in the arachnoid membrane itself. This latter possibility may sound unlikely according to the literature so far, but these available literature denies PGE2 metabolism only in the brain parenchyma. As far as we know, there is no report of any study that examined PGE2 metabolism in the arachnoid membrane. In our preliminary RT-PCR experiment, mRNA of 15-hydroxy-prostaglandin dehydorogenase, a PGE2-metabolizing enzyme, was detected in a mixture of arachnoid membrane and subarachnoidal blood vessels. In fact, some studies demonstrated that the arachoid membrane is involved in drug metabolism.Citation37
Mechanism of PGT induction after the LPS stimulation
What triggers PGT expression in the brain after the LPS stimulation remains unknown. As inflammatory cytokines activate the arachdonic acid cascade and initiate PGE2 production, we first speculated that some products of the arachdonic acid cascade might induce PGT. However, PGE2 itself is not likely to cause PGT induction because coinjection of LPS with dicrofenac, a potent inhibitor of COX-1 and COX-2, did not suppress PGT mRNA expression in the brain (our unpublished observation). Since almost all LPS actions are mediated by inflammatory cytokines, we currently assume that some of the inflammatory cytokines are responsible for PGT induction by LPS. On the other hand, Topper et al.Citation38 reported that inflammatory stimuli (LPS, recombinant human interleukin-1β, tumor necrosis factor-α) did not induce PGT in cultured human umbilical vein endothelial cells. They also reported that human PGT was induced in cultured vascular endothelial cells in response to a physiological fluid mechanical stimulus, suggesting that blood flow as a stimulus may trigger the PGT induction. Since PGE2 has various physiological roles in different tissues, it may not be surprising that PGT has tissue-specific behavior depending on the role of local PGE2.
In addition to the work of Topper et al.,Citation38 there is another intriguing report in terms of the difference in PGT regulation between the brain and other tissues. Ivanov et al.Citation27 demonstrated that after the intravenous injection of LPS, PGT and another PGE2 carrier, i.e., moat1 (multispecific organic anion transporter 1), and 2 PGE2-metabolizing enzymes were downregulated in the lung and the liver, but not in the brain. We also observed down regulation of PGT in the kidney after LPS injection, in that PGT mRNA was strongly expressed in the kidney medulla of the control rat, while those mRNA signals disappeared after LPS injection (unpublished observation). We need to conduct further studies on the regulation of PGT induction by the LPS stimulus.
Limitations of this study
PGT is the carrier with the highest affinity for PGE2 but there are several prostaglandin carriers identified other than PGT, such as moat1,Citation39 and OAT3.Citation40 Thus, we cannot exclude the possibility that those carriers also take part in the removal of PGE2 from the brain during the recovery phase of fever. To establish the physiological role of PGT in the brain, we need specific inhibitors for PGT such as the one recently reported by Chi et al.Citation41
Materials and Methods
Materials
All experiments were carried out under the Guideline for Animal Experiments of Kyoto University and Osaka Institute of Technology. Male Wistar rats (8 weeks old) were purchased from Japan SLC (Shizuoka, Japan). They were housed 5 or 6 to a cage in a room at 26 ± 2°C with a standard 12:12 h light:dark cycle, and were given free access to food and water. Other materials and their sources were as follow: LPS of Escherichia coli 026:B6 (Sigma, St. Louis, MO); digoxigenin (DIG) RNA labeling mix (Roche Diagnostics Corporation, Indianapolis, IN); NBT/BCIP (Roche Diagnostics Corporation); alkaline phosphatase-conjugated anti-DIG antibody (Roche Diagnostics Corporation); rabbit polyclonal antibody against rat PGT (PGT11-A, Alpha Diagnostic International Inc.., San Antonio, TX), which was raised against a 20 aa peptide (SWRMKKNREYSLQENTSGLI) of rat PGT conjugated to KLH and affinity purified; rat PGT control peptide (Alpha Diagnostic International Inc..); Cy3-labeled anti-rabbit antibody (Jackson ImmunoResearch, West Grove, PA); sheep polyclonal antibody against rat von Willbrand factor (Affinity Biologicals, Ont., Canada); goat polyclonal antibody against rat COX-2 (Santa Cruz Biotechnology, Santa Cruz, CA); PGE2 monoclonal enzyme immunoassay kit (Cayman Chemical, Ann Arbor, MI).
Sample preparation
To study the time course of PGT expression during fever, we intraperitoneally injected rats with LPS (100 µg/kg in 0.5 ml of saline) or saline (0.5 ml) between 9:00 and 11:00 am, then obtained samples at the following time points: 1.5, 3, 5, 12, 24, and 48 h after the injection. At each time point, 4 rats were anesthetized with halothane, and their heads were fixed in a stereotaxic apparatus; and then the CSF was sampled from the cisterna magna with a 26-gauge needle connected to a microsyringe (100 µl) via PE20 tubing. Immediately after CSF sampling, they were killed by decapitation, and brains and spinal cords were removed. The CSF samples were quickly frozen in liquid nitrogen, and brains and spinal cords were frozen in isopentane that had been cooled with liquid nitrogen. The CSF samples were stored at −30°C, and the brains and the spinal cords were stored at −80°C until the day of further processing.
In situ hybridization
All brain samples were processed for PGT mRNA in situ hybridization. Frozen brain sections (14-µm thickness) were made in a cryostat so that the sections contained the rostral part of the preoptic area, which is the putative fever center. The sections were thaw mounted on silane-coated glass slides and then fixed with 4% paraformaldehyde for 10 minutes at 4°C. The following protocol was carried out at room temperature otherwise stated. They were further treated with proteinase K (1 µg/ml in phosphate buffered saline (PBS)) for 10 minutes, glycine buffer (2 mg/ml in PBS) for 10 minutes, and then prehybridized for 1 h with hybridization buffer containing 50% formamide, 5 X saline sodium citrate (SSC: 1 X SSC = 0.15 M NaCl, 0.015 M sodium citrate), 5 X Denhardt's solution, 0.25 mg/ml yeast tRNA, and 0.5 mg/ml herring sperm DNA. The sections were hybridized overnight at 55°C with the DIG-labeled antisense or sense PGT riboprobe dissolved in the hybridization buffer at a concentration of approx. 0.25 µg/ml. These DIG-labeled cRNA probes were prepared from a 1.6 kb-fragment of the cDNA sequence of rat PGT. The following day, the sections were washed at 65°C with 0.1 X SSC several times, and processed for immunodetection of DIG. After having been treated with 10% normal goat serum, the sections were incubated with alkaline phosphatase-conjugated anti-DIG antibody at a dilution of 1:1000, and then the signals were detected with NBT/BCIP solution. Some spinal cord samples were examined for PGT mRNA at 5 h and 12 h after LPS injection, at 5 h after saline injection, and at 0 h (untreated).
Semiquantitative analysis of PGT mRNA signals
All brain sections examined by in situ hybridization were semiquantitatively analyzed for signal intensity. Since the appearance of PGT mRNA signals was different between blood vessels and arachnoid membrane, we quantified them in different ways. In blood vessels, we counted the number of PGT mRNA-positive cells within a fixed area, both right and left side of the optic chiasma, through a microscope. The signal intensity in the arachnoid membrane was measured with the aid of an image analysis program, Scion Image for Windows (Scion corp., Frederick, Maryland). In brief, using a PC-driven CCD camera, we captured microscopic views of both sides of the optic nerve, converted them into 8-bit gray scale images, and then quantified the optical density within a given area in the arachnoid membrane. We also measured the optical density of a certain area in the parenchyma in each image as background signals. The signal intensity in the arachnoid membrane was calculated by subtracting the background value from the mean optical density of the arachnoid membrane in each image.
Immunohistochemistry
Brain sections (14-µm thickness) were fixed with acetone for 10 minutes at 4°C, washed with 0.1 M PBS (pH 7.4), treated with 10% normal donkey serum for 1 h, and then incubated overnight with rabbit anti-rat PGT antibody at a dilution of 1:100. After removal of the primary antibody, the sections were washed with PBS and then incubated for 2 h with Cy3-labeled anti-rabbit IgG at a concentration of 1:1000. Fluorescent images of PGT were captured with a laser confocal microscope (Radiance 2000, BioRad), and were converted into 8-bit gray scale images. The mean intensity of fluorescent signals was quantified with the image analysis software. To confirm the specificity of the PGT antibody, we preincubated a solution of PGT antibody with PGT antigen peptide (5 µg/ml) at 37°C for 2 hours with gentle shaking, and then applied it to the sections. For confirmation that PGT was expressed in endothelial cells, some sections, which had been stained for PGT, were further incubated with sheep anti-rat von Willebrand factor IgG at a dilution of 1:3000, followed by FITC-labeled anti-sheep IgG at a dilution of 1:500. To examine whether or not PGT and COX-2 are expressed in the same type of cells, we immunostained COX-2 in brain sections that were adjacent to those processed for in situ hybridization of PGT mRNA according to the protocol described previously.Citation10 Immunohistochemistry was carried out at room temperature otherwise stated.
Enzyme immunoassay for PGE2 in CSF
Three CSF samples from each time point were thawed on ice. PGE2 was extracted from 70 µl of CSF with an organic solvent, ethylacetate, and then assayed with an enzyme immunoassay kit according to the manufacturer's instructions.
Western blot analysis of PGT
Freshly frozen brains were homogenized in 5 vol. of 20 mM Tris-HCl, pH 7.4, containing 0.25 mM sucrose, 1 mM EDTA, 1 mM 4-(2-aminoethyl)-benzenesulfonyl fluoride, 0.5 mM DTT, 10 µg/ml leupeptin, and 1% Triton X-100. The samples were centrifuged, and the supernatants were mixed with SDS sample buffer and heated for 2 minutes, after which they were applied to 10% polyacrylamide gel, electrophoresed, and transferred to a polyvinylidene difluoride membrane. The membrane was blocked with nonfat milk solution for 1 h, and then incubated at 4°C overnight with anti-PGT antibody at a dilution of 1:300. After having been washed with Tris-HCl buffered saline containing 0.3% Tween 20, the membrane was incubated for 2 h with horseradish peroxidase-conjugated anti-rabbit antibody at a dilution of 1:1500. Immunoreactive protein was detected with an ECL kit.
Statistics
Data were expressed as the means ± SE. Statistical significance of the difference among multiple groups was examined by the analysis of variance followed by post hoc multiple comparison (Dunnett test). Student's t-test was used for comparison between 2 groups. A P < 0.05 level of significance was set for all statistical analyses.
Disclosure of Potential Conflicts of Interest
No potential conflicts of interest were disclosed.
Acknowledgments
We thank Drs. N Kanai and VL Schuster for valuable suggestions.
Funding
This work was supported by JSPS KAKENHI Grant Number 25460322.
References
- Coceani F, Lees J, Bishai I. Further evidence implicating prostaglandin E2 in the genesis of pyrogen fever. Am J Physiol 1988; 254:R463-R9; PMID:3279826
- Furuyashiki T, Narumiya S. Stress responses: the contribution of prostaglandin E(2) and its receptors. Nat Rev Endocrinol 2011; 7:163-75; PMID:21116297; http://dx.doi.org/10.1038/nrendo.2010.194
- Ivanov AI, Romanovsky AA. Prostaglandin E2 as a mediator of fever: synthesis and catabolism. Front Biosc 2004; 9:1977-93; PMID:14977603; http://dx.doi.org/10.2741/1383
- Milton AS. Prostaglandins in fever and the mode of action of antipyretic drugs. In: Milton AS, ed. Pyretics and antipyretics. Berlin: Springer-Verlag, 1982:259-67
- Saper CB, Romanovsky AA, Scammell TE. Neural circuitry engaged by prostaglandins during the sickness syndrome. Nat Neurosci 2012; 5:1088-95; PMID:22837039; http://dx.doi.org/10.1038/nn.3159
- Stitt JT. Prostaglandin E as the neural mediator of the febrile response. Yale J Biol Med 1986; 59:137-49; PMID:3739372
- Dinarello CA. Cytokines as endogenous pyrogen. J Infect Dis 1999; 179 suppl 2:S294-304; PMID:10081499; http://dx.doi.org/10.1086/513856
- Matsumura K, Cao C, Ozaki M, Morii H, Nakadate K, Watanabe Y. Brain endothelial cells express cyclooxygenase-2 during lipopolysaccharide-induced fever: light and electron microscopic immunocytochemical studies. J Neurosci 1998; 18:6279-89; PMID:9698320
- Ek M, Engblom D, Saha S, Blomqvist A, Jakobsson PJ, Ericsson-Dahlstrand A. Inflammatory response: pathway across the blood-brain barrier. Nature 2001; 410:430-1; PMID:11260702; http://dx.doi.org/10.1038/35068632
- Inoue W, Matsumura K, Yamagata K, Takemiya T, Shiraki T, Kobayashi S. Brain-specific endothelial induction of prostaglandin E(2) synthesis enzymes and its temporal relation to fever. Neurosci Res 2002; 44:51-61; PMID:12204293; http://dx.doi.org/10.1016/S0168-0102(02)00083-4
- Matsumura K, Yamagata K, Takemiya T, Kobayashi S. COX-2 and mPGES in brain endothelial cells: potential targets of anti-inflammatory drugs. Curr Med Chem-Anti-Inflammatory Anti-Allergy Agents 2002; 1:161-6; PMID:NOT_FOUND; http://dx.doi.org/10.2174/1568014023355890
- Yamagata K, Matsumura K, Inoue W, Shiraki T, Suzuki K, Yasuda S, Sugiura H, Cao C, Watanabe Y, Kobayashi S. Coexpression of microsomal-type prostaglandin E synthase with cyclooxygenase-2 in brain endothelial cells of rats during endotoxin-induced fever. J Neurosci 2001; 21:2669-77; PMID:11306620
- Ushikubi F, Segi E, Sugimoto Y, Murata T, Matsuoka T, Kobayashi T, Hizaki H, Tuboi K, Katsuyama M, Ichikawa A, et al. Impaired febrile response in mice lacking the prostaglandin E receptor subtype EP3. Nature 1998; 395:281-4; PMID:9751056; http://dx.doi.org/10.1038/26233
- Nakamura K, Matsumura K, Kaneko T, Kobayashi S, Katoh H, Negishi M. The rostral raphe pallidus nucleus mediates pyrogenic transmission from the preoptic area. J Neurosci 2002; 22:4600-10; PMID:12040067
- Bito LZ, Davson H, Hollingsworth JR. Facilitated transport of prostaglandins across the blood-cerebrospinal fluid and blood-brain barriers. J Physiol 1976; 256:273-85; PMID:16992503; http://dx.doi.org/10.1113/jphysiol.1976.sp011325
- Bito LZ, Baroody RA. Impermeability of rabbit erythrocytes to prostaglandins. Am J Physiol 1975; 229:1580-4; PMID:1211490
- Schuster VL. Prostaglandin transport. Prostaglandins Other Lipid Mediat 2002; 68–69:633-47; PMID:12432949
- Wallenstein MC, Bito LZ. Hyperthermic effects of supracortically applied prostaglandins after systemic pretreatment with inhibitors of prostaglandin transport and synthesis. J Pharmacol Exp Ther 1978; 204:454-60; PMID:621674
- Sirko S, Bishai I, Coceani F. Prostaglandin formation in the hypothalamus in vivo: effect of pyrogens. Am J Physiol 1989; 256:R616-24; PMID:2784289
- Kanai N, Lu R, Satriano JA, Bao Y, Wolkoff AW, Schuster VL. Identification and characterization of a prostaglandin transporter. Science 1995; 268:866-9; PMID:7754369; http://dx.doi.org/10.1126/science.7754369
- Lu R, Kanai N, Bao Y, Schuster VL. Cloning, in vitro expression, and tissue distribution of a human prostaglandin transporter cDNA(hPGT). J Clin Invest 1996; 98:1142-9; PMID:8787677; http://dx.doi.org/10.1172/JCI118897
- Pucci ML, Bao Y, Chan B, Itoh S, Lu R, Copeland NG, Gilbert DJ, Jenkins NA, Schuster VL. Cloning of mouse prostaglandin transporter PGT cDNA: species-specific substrate affinities. Am J Physiol 1999; 277:R734-41; PMID:10484490
- Chan BS, Satriano JA, Pucci M, Schuster VL. Mechanism of prostaglandin E2 transport across the plasma membrane of HeLa cells and Xenopus oocytes expressing the prostaglandin transporter “PGT.” J Biol Chem 1998; 273:6689-97; PMID:9506966; http://dx.doi.org/10.1074/jbc.273.12.6689
- Chi Y, Schuster VL. The prostaglandin transporter PGT transports PGH(2). Biochemical and biophysical research communications 2010; 395:168-72; PMID:20346915; http://dx.doi.org/10.1016/j.bbrc.2010.03.108
- Nomura T, Lu R, Pucci ML, Schuster VL. The two-step model of prostaglandin signal termination: in vitro reconstitution with the prostaglandin transporter and prostaglandin 15 dehydrogenase. Mol Pharmacol 2004; 65:973-8; PMID:15044627; http://dx.doi.org/10.1124/mol.65.4.973
- Schuster VL. Molecular mechanisms of prostaglandin transport. Annu Rev Physiol 1998; 60:221-42; PMID:9558462; http://dx.doi.org/10.1146/annurev.physiol.60.1.221
- Ivanov AI, Scheck AC, Romanovsky AA. Expression of genes controlling transport and catabolism of prostaglandin E2 in lipopolysaccharide fever. Am J Physiol Regul Integr Comp Physiol 2003; 284:R698-706; PMID:12399253; http://dx.doi.org/10.1152/ajpregu.00570.2002
- Endo S, Nomura T, Chan BS, Lu R, Pucci ML, Bao Y, Schuster VL. Expression of PGT in MDCK cell monolayers: polarized apical localization and induction of active PG transport. Am J Physiol Renal Physiol 2002; 282:F618-22; PMID:11880322; http://dx.doi.org/10.1152/ajprenal.00150.2001
- Kochel TJ, Fulton AM. Multiple drug resistance-associated protein 4 (MRP4), prostaglandin transporter (PGT), and 15-hydroxyprostaglandin dehydrogenase (15-PGDH) as determinants of PGE levels in cancer. Prostaglandins Other Lipid Mediat 2014; PMID:25433169
- Lacroix-Pepin N, Danyod G, Krishnaswamy N, Mondal S, Rong PM, Chapdelaine P, Fortier MA. The multidrug resistance-associated protein 4 (MRP4) appears as a functional carrier of prostaglandins regulated by oxytocin in the bovine endometrium. Endocrinology 2011; 152:4993-5004; PMID:21990316; http://dx.doi.org/10.1210/en.2011-1406
- Ohkura N, Shigetani Y, Yoshiba N, Yoshiba K, Okiji T. Prostaglandin transporting protein-mediated prostaglandin E2 transport in lipopolysaccharide-inflamed rat dental pulp. Journal of endodontics 2014; 40:1112-7; PMID:25069917; http://dx.doi.org/10.1016/j.joen.2013.12.024
- Reid G, Wielinga P, Zelcer N, van der Heijden I, Kuil A, de Haas M, Wijnholds J, Borst P. The human multidrug resistance protein MRP4 functions as a prostaglandin efflux transporter and is inhibited by nonsteroidal antiinflammatory drugs. Proc Natl Acad Sci U S A 2003; 100:9244-9; PMID:12835412; http://dx.doi.org/10.1073/pnas.1033060100
- Romanovsky AA, Ivanov AI, Karman EK. Blood-borne, albumin-bound prostaglandin E2 may be involved in fever. Am J Physiol 1999; 276:R1840-4; PMID:10362768
- Steiner AA, Ivanov AI, Serrats J, Hosokawa H, Phayre AN, Robbins JR, Roberts JL, Kobayashi S, Matsumura K, Sawchenko PE, et al. Cellular and molecular bases of the initiation of fever. PLoS Biol 2006; 4:e284; PMID:16933973; http://dx.doi.org/10.1371/journal.pbio.0040284
- Chan BS, Endo S, Kanai N, Schuster VL. Identification of lactate as a driving force for prostanoid transport by prostaglandin transporter PGT. Am J Physiol Renal Physiol 2002; 282:F1097-102; PMID:11997326; http://dx.doi.org/10.1152/ajprenal.00151.2001
- Bao Y, Pucci ML, Chan BS, Lu R, Ito S, Schuster VL. Prostaglandin transporter PGT is expressed in cell types that synthesize and release prostanoids. Am J Physiol Renal Physiol 2002; 282:F1103-10; PMID:11997327; http://dx.doi.org/10.1152/ajprenal.00152.2001
- Ghersi-Egea JF, Leininger-Muller B, Cecchelli R, Fenstermacher JD. Blood-brain interfaces: relevance to cerebral drug metabolism. Toxicol Lett 1995; 82-83:645-53; PMID:8597122
- Topper JN, Cai J, Stavrakis G, Anderson KR, Woolf EA, Sampson BA, Schoen FJ, Falb D, Gimbrone MA, Jr. Human prostaglandin transporter gene (hPGT) is regulated by fluid mechanical stimuli in cultured endothelial cells and expressed in vascular endothelium in vivo. Circulation 1998; 98:2396-403; PMID:9832484; http://dx.doi.org/10.1161/01.CIR.98.22.2396
- Nishio T, Adachi H, Nakagomi R, Tokui T, Sato E, Tanemoto M, Fujiwara K, Okabe M, Onogawa T, Suzuki T, et al. Molecular identification of a rat novel organic anion transporter moat1, which transports prostaglandin D(2), leukotriene C(4), and taurocholate. Biochem Biophys Res Commun 2000; 275:831-8; PMID:10973807; http://dx.doi.org/10.1006/bbrc.2000.3377
- Tachikawa M, Ozeki G, Higuchi T, Akanuma S, Tsuji K, Hosoya K. Role of the blood-cerebrospinal fluid barrier transporter as a cerebral clearance system for prostaglandin E(2) produced in the brain. J Neurochem 2012; 123:750-60; PMID:22978524; http://dx.doi.org/10.1111/jnc.12018
- Chi Y, Min J, Jasmin JF, Lisanti MP, Chang YT, Schuster VL. Development of a high-affinity inhibitor of the prostaglandin transporter. J Pharmacol Exp Ther 2011; 339:633-41; PMID:21849625; http://dx.doi.org/10.1124/jpet.111.181354
