
 ?Mathematical formulae have been encoded as MathML and are displayed in this HTML version using MathJax in order to improve their display. Uncheck the box to turn MathJax off. This feature requires Javascript. Click on a formula to zoom.
ABSTRACT
In cool conditions, physiologic markers accurately predict endurance performance, but it is unclear whether thermal strain and perceived thermal strain modify the strength of these relationships. This study examined the relationships between traditional determinants of endurance performance and time to complete a 5-km time trial in the heat. Seventeen club runners completed graded exercise tests (GXT) in hot (GXTHOT; 32°C, 60% RH, 27.2°C WBGT) and cool conditions (GXTCOOL; 13°C, 50% RH, 9.3°C WBGT) to determine maximal oxygen uptake (V̇O2max), running economy (RE), velocity at V̇O2max (vV̇O2max), and running speeds corresponding to the lactate threshold (LT, 2 mmol.l−1) and lactate turnpoint (LTP, 4 mmol.l−1). Simultaneous multiple linear regression was used to predict 5 km time, using these determinants, indicating neither GXTHOT (R2 = 0.72) nor GXTCOOL (R2 = 0.86) predicted performance in the heat as strongly has previously been reported in cool conditions. vV̇O2max was the strongest individual predictor of performance, both when assessed in GXTHOT (r = −0.83) and GXTCOOL (r = −0.90). The GXTs revealed the following correlations for individual predictors in GXTHOT; V̇O2max r = −0.7, RE r = 0.36, LT r = −0.77, LTP r = −0.78 and in GXTCOOL; V̇O2max r = −0.67, RE r = 0.62, LT r = −0.79, LTP r = −0.8. These data indicate (i) GXTHOT does not predict 5 km running performance in the heat as strongly as a GXTCOOL, (ii) as in cool conditions, vV̇O2max may best predict running performance in the heat.
Introduction
An individual's free-paced running velocity represents an observable behavioral consequence of collective physiologic, psychological, and tactical feedback. Under normothermic conditions, this behavioral response is highly associated with physiologic markers of endurance performance, such as lactate threshold (LT), lactate turnpoint (LTP), running economy (RE), and maximum oxygen uptake (V̇O2max).Citation1-Citation9 Thus, these factors have been termed as the determinants of endurance performance.Citation1,Citation7,Citation8,Citation10,Citation11
The determinants of the endurance performance modelCitation1 demonstrate how an individual's V̇O2max determines the upper limit of aerobic metabolism, beneath which the LTP corresponds to the fractional utilization of V̇O2max (%V̇O2max) that can be sustained. Running velocity is then determined by how efficiently the corresponding oxidative adenosine triphosphate turnover at the fractional utilization of V̇O2max is converted to locomotion (i.e., RE). During an outdoor 16 km race, McLaughlin et al.Citation8 reported that these determinants collectively accounted for 95.4% of the variation in performance. The composite measure of RE and velocity at V̇O2max, (vV̇O2max) explained 94.4% of the variation in performance time, while V̇O2max and LT each accounted for ∼90%.Citation8
Endurance running in hot and humid environmental conditions is characterized by elevated thermoregulatory, cardiovascular, and perceived exertional strain, which typically leads to a performance decrement, relative to cooler conditions.Citation12 Whether environmental heat stress and the consequential elevated physiologic strain modifies the relationship between the determinants of endurance performance and free-paced running velocity is unclear. There is some evidence indicating that the sustainable exercise intensity in the heat for 1 hour may be accurately predicted by the LTP,Citation13 while the progressive decrement in V̇O2max also appears to be important in determining absolute exercise intensity (i.e., running velocity, power output), with Périard & RacinaisCitation14 suggesting individuals maintain a similar relative exercise intensity (%V̇O2max) in the heat, as in cool conditions. Therefore, individual determinants of endurance performance, such as the LTP and V̇O2max, appear to remain important for predicting endurance performance in the heat. However, specific thermal factors such as perceived thermal discomfort have also been proposed as determinants of self-paced exercise in the heat.Citation15 Behavioral thermoregulation is a volitional process that typically presents through reducing metabolic heat production (i.e., reducing exercise intensity) and, thus, body heat storage during endurance exercise in response to unfavorable thermal discomfort.Citation16 Therefore, behavioral thermoregulation may confound existing relationships between physiologic markers and endurance performance when exercising in the heat.Citation17 Such a suggestion is in accordance with indices of perceived strain, such as thermal sensation and discomfort, being determined somewhat independently of traditional physiologic markers, for example, in advance of changes in core body temperature.Citation18 Accordingly, highlighting an integrated behavioral thermoregulatory response, Flouris and SchladerCitation17 suggested that elevated skin temperature (TSKIN) elicits concomitant effects on both perceived strain (i.e., thermal discomfort and/or exertion (RPE))Citation16 and cardiovascular strain,Citation19,Citation20 indicating that performance in the heat is influenced by both behavioral consequences and systemic physiologic limitations.
Therein, a heightened perceived strain may reduce the variation attributable to the traditional physiologic determinants, such that the specific determinants of endurance performance in the heat are not clearly defined. Such information would facilitate a more informed application of thermal interventions, such as precooling and heat acclimation, for alleviating physiologic versus perceived strain, but also aid performance prediction and training prioritization. Therefore, this study investigated the relationship between V̇O2max, LT, LTP, RE, vV̇O2max, and 5-km treadmill time trial (TT) performance, when the determinants are measured in both hot (32°C, 60%) and cool (13°C, 50%) conditions. The ultimate goal of this work is to inform on the appropriateness of using the traditional determinants of endurance performance model for research on endurance running in the heat.
Methods
This study on predicting 5-km running performance from the determinants of endurance performance is part of a recently published larger study of heat acclimation and performance.Citation21 However, the current study investigates different hypotheses, focused on predicting performance in the heat, when the determinants have been measured in hot and cool conditions.
Participants
Seventeen, amateur, club runners (16 male, 1 female), who trained a minimum of three times per week for the previous 2 months, volunteered for this study (mean ± SD: age 32 ± 13 years, stature 177 ± 6 cm, mass 71.9 ± 8.9 kg, body fat percentage 11.2 ± 2.1%, V̇O2max 61.0 ± 6.2 mL.kg−1.min−1, recent 5 km time 20:25 ± 1:42 min). Testing occurred in the UK spring, therefore participants were not naturally heat acclimated and were entering the competition season. The female participant completed all trials during the follicular phase of the menstrual cycle, verified via a questionnaire. Each participant provided written-informed consent and institutional ethical approval was issued in accordance with the Declaration of Helsinki (2013). Participants avoided intense exercise, alcohol and caffeine for 48 hours before testing and arrived hydrated, verified through urine analysis using a refractometer (< 1.020, specific gravity refractometer 32, Atago, USA) in accordance with Sawka et al.Citation22
Experimental design
Participants visited the laboratory on five occasions, comprising two familiarization visits and three experimental trials. On the first visit, a four-site skin fold caliper assessment was completed across the iliac crest, subscapular, triceps, and biceps, for the estimation of body fat percentage in accordance with the calculation of Siri.Citation23 Participants were then familiarized with a graded exercise test in hot and humid conditions (GXTHOT; 32°C, 60% relative humidity (RH), 27.2°C wet bulb globe temperature (WBGT)). During the second familiarization visit, participants completed a 5-km treadmill TT under the same environmental conditions. Experimental trials began 2 weeks after familiarizations to control against thermal adaptations from repeated visitsCitation24 and occurred at a similar time of the day for each participant to control for diurnal core temperature fluctuation.Citation25
During the first experimental trial, participants completed a GXT in cool conditions (GXTCOOL; 13°C, 50% RH, 9.3°C WBGT) to assess the determinants of endurance performance (LT, LTP, RE, V̇O2max, vV̇O2max). At least 2 d later, participants completed GXTHOT, the same test in hot and humid conditions (32°C, 60% RH, 27.2°C WBGT). The final trial occurred 3–4 d later, where participants completed a 5-km treadmill TT in the same hot conditions. All trials were conducted in the same order and within an environmental chamber (WatFlow control system TISS, Hampshire, UK).
Graded exercise test
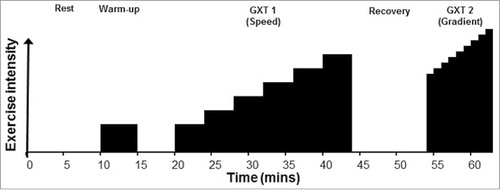
A graded exercise test, split into two parts, GXT 1 and GXT 2, was adopted, as described previously by Jones.Citation26 Following a 10-min rest in the hot or cool environment and a 5-min low-intensity warm-up (matched across both trials), GXT 1 was a submaximal incremental speed protocol, followed by GXT 2; an incremental gradient protocol to volitional exhaustion (). Starting speed during GXT 1 was determined from recent running performance and the familiarizations, to ensure an initial steady-state blood lactate response, while achieving an exponential increase in blood lactate concentration (> 4 mmol.l−1) within 6–8 exercise stages. Each stage involved 3 min of exercise, followed by 1-min rest, for blood sampling. Stages were separated by increments of 1 km.h−1. All tests occurred on a motorized treadmill (Woodway ELG2, Weil am Rhein, Germany) set at 1% incline, to replicate outdoor running.Citation27 Following a 10-min rest in the hot or cool environment, GXT 2 began 2 km.h−1 below the previous final speed, with gradient increasing by 1% each min. Participants were not permitted to drink and were blinded to all forms of feedback.
Figure 1. Time course of graded exercise test. The entire protocol took place within the hot or cool environment.
5-km time trial
Upon arrival, participants rested in the hot environment for 10 min, before completing a 5 min, self-selected warm-up. Standardized instructions were given at the start of the trial and nothing thereafter, with participants instructed to “give your all,” “pace yourself throughout the trial,” and “adjust speed as you see fit” as per similar research.Citation28 Participants straddled the treadmill belt, increased to the individual's average speed from the familiarization, to maintain a consistent blinded starting speed. The trial began when the participant began running, with speed adjustment immediately permitted ad libitum (increment 0.2 km.h−1) and total distance continuously displayed. The treadmill gradient was fixed at 1%. Participants were given no other feedback and did not drink during trials. Pilot testing within our laboratory, using a similar cohort, indicated a typical error for this trial of 16 s (1.2%).
Physiological and perceptual measures
During all trials, sweat loss was estimated from pre- and post-exercise nude body mass to the nearest 0.01 kg using precision scales (GFK 150, Adam Equipment, Milton Keynes, UK). Core temperature (TCORE) was measured using disposable rectal probes (Henleys Medical, UK), inserted to 10 cm beyond the anal sphincter and connected to a data logger (Model 401, Yellow Springs Instruments, Ohio, USA). Telemetry thermistors (U-type connected to Gen II GD38 transmitter, Eltek, UK) were attached to the pectoralis major, biceps brachii, rectus femoris, and gastrocnemius for measuring TSKIN to calculate a weighted mean skin temperature.Citation29 Heart rate (HR) was monitored continuously using a Polar 810i heart rate monitor (Kempele, Finland). HR, TCORE, TSKIN, rating of perceived exertion (RPECitation30), and thermal sensation (TS, 0 = unbearably cold to 8 = unbearably hotCitation31) were noted at the end of each stage during GXT 1 and every km during the TT.
During the GXTs, running speeds at 2 and 4 mmol.l−1 were calculated by solving the polynomial regression equation for blood lactate concentration versus speed at 2 and 4 mmol.l−1, denoting the lactate threshold (LT) and lactate turnpoint (LTP), respectively.Citation32 This approach accounted for differences in the number of stages completed, removed subjectivity of experimenter identification and provided precision to less than 1 km.h−1. Fingertip blood samples at the end of each stage were analyzed immediately (2300 analyzer, Yellow Springs Instruments, Ohio, USA). Ventilatory gases were measured using 30 s fixed-time averages (Metalyzer 3B, Cortex, Leipzig, Germany), with the two values from the final min of each stage used for RE. Average RE (mL O2.kg−1.km−1) was calculated across the first five exercise stages, using the two fixed 30 s averages from the final minute of each stage. During GXT 2, the highest 30 s moving average represented V̇O2max. A V̇O2max, not V̇O2peak, was accepted when a V̇O2 plateau (< 2 mL.kg−1.min−1 across two successive 30 s fixed-time averages was observed).Citation32 While a subsequent verification phase is recommended for the robust assessment of V̇O2max,Citation33 the precise consequences of heat strain cannot be accurately replicated, which would be necessary given the strong relationship between heat strain and V̇O2max decrement.Citation12 Therefore, in the absence of a plateau, a test was deemed maximal if three out of the following four criteria were met; blood lactate concentration >8 mmol.l−1, HR within 10 beats of age-predicted maximum, respiratory exchange ratio >1.1, and RPE at or above 19, as we have previously adopted.Citation21,Citation34 Velocity at V̇O2max was calculated by multiplying V̇O2max (mL.kg−1.min−1) by 60 and dividing by the average RE.Citation26
Data analyses
All outcome variables were assessed for normality and sphericity before further analysis. Data were analyzed using SPSS (version 21, SPSS Inc., Illinois, USA) with statistical significance set at p<0.05 and presented as means ( ± SD). Initially, paired Student's t-tests were used to indicate differences in the number of V̇O2max and V̇O2peak tests, between conditions. Pearson's correlations (r) were used to examine for statistically significant relationships between the individual determinants of endurance performance and 5-km time. Following determination of a significant linear relationship, statistically significant variables were entered into a simultaneous multiple linear regression, with LT, LTP, RE, V̇O2max and vV̇O2max as the predictor variables and 5-km time as the dependent variable. The magnitude of difference between related, single samples is demonstrated by Cohen's dav , in accordance with the recommendations of Lakens.Citation35 Correlations greater than 0.5 are considered large, 0.5–0.3 moderate and 0.3–0.1 small, in accordance with Cohen.Citation36
Results
Technical faults resulted in no data for one measure of both V̇O2max and RE (different individuals). Consequently, correlations are derived from n = 17 for LT & LTP, n = 16 for V̇O2max & RE, and n = 15 for vV̇O2max. All predictor variables from both GXTHOT, GXTCOOL, and 5-km TT performance were normally distributed. Based on the predefined criteria, no difference (p = 0.08) was observed in the prevalence of V̇O2max and V̇O2peak tests between GXTCOOL (V̇O2max = 15, V̇O2peak = 2) and GXTHOT (V̇O2max = 12, V̇O2peak = 5).
GXT physiologic responses
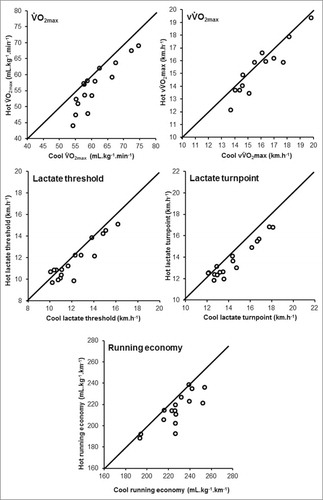
Incremental running in GXTHOT elicited a holistically elevated physiologic strain compared with GXTCOOL, as shown in . For complete physiologic results, please see our recently published paper.Citation21 Briefly, blood lactate concentration was elevated in GXTHOT (), resulting in a −0.6 (0.8) km.h−1 reduction in the LT and −0.7 (0.7) km.h−1 the LTP. V̇O2max was also impaired in GXTHOT (−4.6 ± 3.3 mL.kg−1.min−1), as was vV̇O2max (−0.6 ± 0.7 km.h−1). RE improved in GXTHOT, with the mean metabolic cost of running reduced by 12.3 ± 10.1 mL.kg−1.km−1, in the heat. Individual data demonstrating the impairments arising from heat stress to each of the determinants of 5-km performance are shown in .
Table 1. Mean (± SD) physiologic and perceptual responses when measured in hot (GXTHOT) and cool conditions (GXTCOOL). * represents statistical difference (p <0.05).
Figure 2. Mean ( ± SD) blood lactate response during graded exercise in hot conditions, compared with cool conditions. Error bars represent one standard deviation.
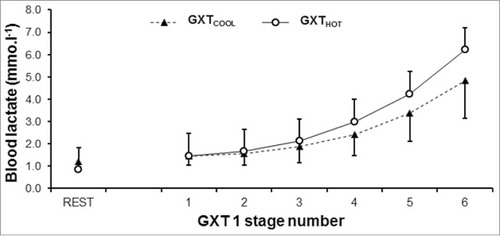
Figure 3. Individual plots demonstrating decrements from heat stress for determinant of endurance performance.
5-km time trial in the heat
Physiological and perceptual responses from the 5-km TT in hot conditions are shown in .
Table 2. Mean ( ± SD) physiologic and perceptual responses during 5-km time trial in hot conditions.
Predictions from GXTHOT
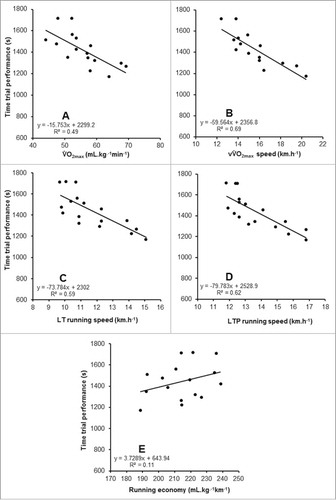
When measured in GXTHOT, LT, LTP, V̇O2max, and vV̇O2max were identified as statistically significant predictors of TT performance, but RE was not. The strongest individual predictor from GXTHOT was vV̇O2max (r = −0.83). These data are shown in and . Due to the absence of a statistically significant relationship between RE and TT performance, all variables aside of RE, were entered into a simultaneous multiple linear regression, revealing a significant relationship with TT performance (F[4, 10] = 6.508, p = 0.008, R2 = 0.72, standard error of the estimate (SEE) = 106 s). The model revealed the following formula for predicting 5-km performance based on measures derived from GXTHOT.
Table 3. The determinants of endurance performance (mean ± SD), with respective correlations (r) and statistical significance (p) for predicting running performance in existing literature using trained runners and from this study (shown in bold). Where fixed blood lactate concentrations other than 2 and 4 mmol.l−1 have been used, the respective value is stated.
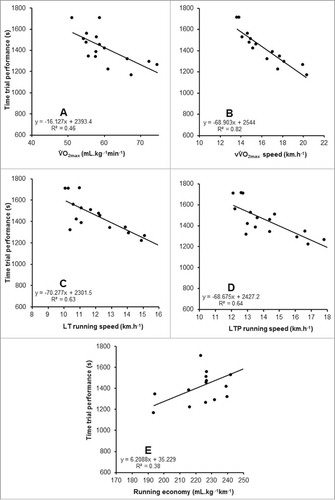
Figure 4. Relationships between the determinants of endurance performance when measured in a hot environment (GXTHOT) and 5-km time trial performance in the heat. A – V̇O2max, B – vV̇O2max, C – lactate threshold (LT), D – lactate turnpoint (LTP), E – running economy.
Predictions from GXTCOOL
When measured in GXTCOOL, LT, LTP, RE, V̇O2max, and vV̇O2max were all statistically significant predictors of TT performance in the heat ( and ). Again, the vV̇O2max was the strongest predictor of 5-km performance in GXTCOOL (r = −0.90). The results from GXTHOT and GXTCOOL are shown in . To compare against the results of GXTHOT, that did not include RE in the predictive model, a simultaneous multiple linear regression was completed, excluding RE, revealing a significant relationship with TT performance (F[4, 10] = 11.396, p = 0.001, R2 = 0.82, SEE = 85 s). Subsequently, adding RE to these variables further improved the model (F[5, 9] = 11.465, p = 0.001, R2 = 0.86, SEE = 78 s). The model revealed the following formula for predicting 5-km performance based on measures derived from GXTCOOL.
Figure 5. Relationships between the determinants of endurance performance when measured in a cool environment (GXTCOOL) and 5-km time trial performance in the heat. A – V̇O2max, B – vV̇O2max, C – lactate threshold (LT), D – lactate turnpoint (LTP), E – running economy.
Discussion
This study investigated the relationship between the determinants of endurance performance, when measured in hot and cool conditions, and 5-km running TT performance in hot conditions. In GXTHOT, the determinants explained 72% of performance and 82% in GXTCOOL. These findings indicate that the incremental running test in hot conditions is a weaker predictor of performance in the heat compared with testing in cool conditions. Supporting previous research conducted in cool conditions,Citation6,Citation8,Citation37,Citation38 vV̇O2max appears the strongest predictor of 5-km performance in the heat. The overall models derived from both GXTHOT and GXTCOOL represent weaker relationships than are previously reported when the GXT and TT occur under conditions without heat stress,Citation8 alluding to greater unexplained variance when endurance running performance occurs in the heat.
Predicting running performance in the heat
In GXTHOT, vV̇O2max, V̇O2max, LT, and LTP explained 72% of the variance in 5-km performance, indicating that the majority of endurance performance in the heat is still underpinned by the traditional physiologic determinants. However, the prediction model reveals greater unexplained variance than previously reported for 16-km running performance (R2 = 0.9788) and did not include RE due to the absence of a significant linear relationship for RE to predict 5-km performance. It should be acknowledged there is likely a greater anaerobic contribution during a 5-km TT rather than 16 km,Citation39 while the study of McLaughlin et al.Citation8 also involved over-ground, rather than treadmill running. However, as shown in , some relationships between individual predictors and performance are also weaker than previously reported, suggesting that other factors elicit a greater influence on endurance performance in the heat, than as previously reported in cool conditions. Moreover, the SEE of the derived equations is of sufficient magnitude that predictions would not be meaningful, given our laboratory typical error for this trial (16 s, 1.2%).
A stronger model was observed from GXTCOOL (GXTHOT R2 = 0.72, GXTCOOL R2 = 0.82), indicating TT performance in the heat is not as closely associated to the physiologic responses during GXTHOT, as when the determinants are assessed in GXTCOOL. One explanation could be the fixed GXT intensities not eliciting analogous decrements on the determinants across participants, as demonstrated in . In compensable heat stress environments, fixed exercise intensities, as adopted in the GXT, can elicit different magnitudes of heat strain between individuals, due to differences in body massCitation40 and/or training status.Citation41 This highlights the potential for individual variation in the changes in the determinants of endurance performance, when measured in GXTHOT, relative to GXTCOOL, weakening the prediction model of GXTHOT. The differences between GXTHOT and GXTCOOL cannot be explained by the addition of RE to the model, because while RE strengthens the prediction of performance, the smaller model derived from V̇O2max, vV̇O2max, LT, and LTP already explained a greater proportion of variability and demonstrated a lower SEE in GXTCOOL. There were very high-sample correlations among many of these physiologic variables, in particular the running velocity variables, as has previously been reported when multiple independent variables are derived from the same individual.Citation42,Citation43 This makes it difficult to assess the relative contribution of each predictor to the overall model,Citation42 however, inference can be taken from individual Pearson corelations between each predictor and 5-km performance as shown in and for GXTHOT and GXTCOOL, respectively.
Correlation coefficients between 5-km performance and blood lactate indices LT and LTP are stronger than for V̇O2max or RE, but appear slightly weaker than previous research in normothermic conditions (). Notably, these relationships are also weaker than Lorenzo et al.,Citation13 who demonstrated relationships of r = 0.87, 0.86, and 0.86 for the lactate inflection point (increase >0.2 mmol.l−1), power output at 1 mmol.l−1, and power output at 4 mmol.l−1 respectively, to predict cycling performance in hot conditions (38°C, 30% RH). Based upon these data, Lorenzo et al.Citation13 indicated lactate thresholds should be assessed in the environmental conditions where performance will occur, to accurately predict performance. However, our data indicates a lessened ability of blood lactate indices to predict performance in shorter, running events that are completed at a greater exercise intensity than the 1-hour cycling TT of Lorenzo et al.Citation13 The intensity of 5-km running is thought to represent 94–98% of V̇O2max in elite athletesCitation39 and corresponded to a mean of 94% of HR maximum in our cohort. Moreover, running elicits greater heat strain than cycling,Citation44 likely due to the greater metabolic heat production and reduced convective cooling, while our protocol was also significantly shorter than Lorenzo et al.,Citation13 lasting ∼23 min in the heat. Finally, Lorenzo et al.Citation13 pre-warmed individuals for 30 min, which may have resulted in a more uniform elevation of both TSKIN and TCORE than our participants experienced while running during GXT 1.
There is generally considered to be a strong inverse relationship between V̇O2max and TT performance within runners of heterogeneous performance levels (r = −0.81–0.91),Citation8,Citation38,Citation42,Citation45,Citation46 with a high V̇O2max considered a pre-requisite for elite endurance performance, to meet the estimated energy requirements necessary to sustain running velocities observed in high-level competition.Citation47 While the relationship between V̇O2max and performance may be weaker within an elite population due to the relative homogeneity of V̇O2max within this cohort,Citation37 Billat et al.Citation48 demonstrated that V̇O2max may still explain up to 59% of the variation in performance among elite marathon runners. The relationships between V̇O2max and performance in the heat (GXTHOT r = 0.70, GXTCOOL r = 0.67) are weaker than that for 16-km running in the cool (r = −0.91),Citation8 but stronger than other studies using cohorts who display both heterogeneous V̇O2max and running performance (r = 0.559; r = 0.51Citation49), which may reflect the significant cardiovascular strain observed during exercise in the heat,Citation50 indicating a larger V̇O2max to be desirable for performance in the heat.
Running economy during GXTHOT revealed no relationship with performance (r = 0.36), unlike in GXTCOOL (r = 0.62), indicating RE assessment in hot conditions to be inappropriate for predicting performance in the heat. The influence of heat stress on RE is equivocal, possibly due to the progressive onset of heat strain and associated thermoregulatory responses, which may contribute to different outcomes between studies adopting different methodologies. For example, the relatively low starting intensities during the GXT may initially afford a benefit to RE through a more efficient muscle,Citation51 before energy demanding thermoregulatory responses such as hyperthermic hyperventilation,Citation52 enhance physiologic strain. Therefore, the measurement of RE during GXTHOT may not replicate the physiologic strain experienced during the TT, where a high intensity is observed from the outset (∼94% maximum HR), eliciting a faster and heightened thermoregulatory response, despite matched heat stress. It is also plausible that GXTCOOL elicited a small reduction in starting muscle temperature, affording a small impairment to muscle efficiency and requiring greater oxygen consumption for a given running speed, although we acknowledge muscle temperature was not measured. Notwithstanding, GXTCOOL demonstrated a stronger relationship between RE and performance, but this remains a relatively weak relationship, reaffirming RE to be a weak predictor of 5 km or similar distances.Citation9,Citation49 This is unsurprising, given that RE is most related to longer distance events than 5 km39 and would appear to exert the greatest influence within a group of athletes with relatively homogenous V̇O2max,Citation37 which was not the case in this sample (V̇O2max range 51–75 mL.kg−1min−1).
Despite the limitations of the relationship between RE and endurance performance, vV̇O2max remained the strongest predictor, both when derived from GXTHOT and GXTCOOL, which is in broad agreement with previous literature in , and the study of Houmard et al.Citation53 who reported vV̇O2max to explain 92% of the variance in 8-km performance. This reaffirms the importance of training and monitoring of the parameters that determine vV̇O2max for improving 5-km performance in the heat. However, this observation should not necessarily reduce the importance attributed to blood lactate thresholds, given that Morgan et al.Citation37 have previously highlighted the intuitive notion that a direct link may exist between vV̇O2max and determinants of blood lactate indices, such as capillary density, fiber-type distribution, respiratory capacity, and muscle enzyme activity, suggesting that training of either V̇O2max, RE, or lactate thresholds may provide mutual benefits.
Unexplained variance
In comparison to the data of McLaughlin et al.,Citation8 who adopted a comparable participant cohort and similarly analyzed the entire model of the traditional determinants of endurance performance, our data from both GXTHOT and GXTCOOL explained less of the variance in performance. When exercising under heat stress, it has previously been shown that perceived thermal and/or exertional strain exert marked influences on self-selected exercise intensity, in advance of changes in body temperature, through to moderate levels of hyperthermia.Citation17,Citation20,Citation54 Such adjustments to exercise intensity represent a behavioral response, and in the heat likely reflect behavioral attempts to thermoregulate and/or alleviate unfavorable sensations.Citation16 Therefore, while acknowledging differences in energetic profile of the event lengths, behavioral thermoregulation, presenting as a reduction in the self-selected running speed, is a likely candidate to contribute to the unexplained variance in determining endurance performance in the heat.
Behavioral thermoregulation has previously been suggested to be a determinant of exercise performance under heat stress.Citation16 For example, in high-level athletes, the trend toward a flatter pacing profile following familiarization to endurance exercise in the heat,Citation55 represents a form of behavioral thermoregulation as individuals seek to avoid beginning exercise at an intensity that may yield a subsequent disadvantage arising from excessive heat storage. In our 5-km TT, participants may have altered running speed in accordance with perceived thermal discomfort, rather than solely in accordance with the physiologic markers that largely determine performance in cooler environments. The concept of a physiologic reserve when exercising in the heat is supported by the effects reported following the ingestion of dopamine/noradrenaline reuptake inhibitor, that facilitated improved TT performance in the heat, for the same perceptual responses, but not in cool conditions.Citation56 Flouris and SchladerCitation16 have suggested thermal discomfort may be a contributing factor to RPE, which may be the ultimate moderator of behavioral thermoregulation, to which both physiologic strain and unfavorable sensations feed into. RPE may initially be primarily influenced by TSKIN, with TCORE exerting a greater influence as hyperthermia progresses.Citation16 During the 5-km TT, as TCORE elevation and hyperthermia became more pronounced, physiologic strain may have influenced performance both directly, through limiting aerobic capacity, but also indirectly by enhancing RPE.Citation20,Citation57 Therefore, in the heat, RPE may encompass both physiologic strain, as well as perceived strain, that may occur somewhat independently, during exercise in the heat. However, we cannot infer a relationship between RPE during the GXT and the TT because RPE measured during an incremental exercise test may not replicate prolonged exercise protocols, especially under heat stressCitation58 and may be susceptible to bias from prior knowledge of the protocol length.Citation59,Citation60 Therefore, associations between RPE or other ordinal level data such as thermal sensation and the response during the TT are not possible.
Limitations
As a 5-km TT was not completed in cool conditions, the efficacy of determinants of endurance performance for predicating performance for this cohort outside of heat stress is unknown. It is also acknowledged that exercise tests were conducted without representative air flow, which will likely impair convective coolingCitation61 and, in turn, may have exacerbated physiologic strain and thermal discomfort, relative to outdoor running. Therefore, future research should replicate these exercise tests under conditions incorporating suitable airflow. Finally, relationships are derived from treadmill running, which although modified to replicate the increased energy expenditure of outdoor running,Citation27 and valid and reliable for assessing endurance running performance,Citation62 may be insensitive to small, intuitive changes in running speed.Citation63 To mitigate this, participants were asked to practice both small and large adjustments in treadmill speed during their familiarization, as well as being reminded they were free to adjust the speed as much, or as little as they liked before every trial.
Practical applications
Event characteristics such as distance and duration may determine whether it is appropriate to conduct a laboratory test in representative environmental conditions, due to the potential for heat stress to afford a transient improvement to running economy that does not appear to replicate 5-km TT exercise. Therefore, completing TT in the heat may be more appropriate for assessing training status in competitive athletes before competing. When laboratory testing does take place, the best single predictor of 5-km performance would appear to be vV̇O2max, measured in cool conditions. The traditional determinants of endurance performance, vV̇O2max, V̇O2max, LT, and LTP, appear to remain prerequisites, accounting for 82% of variance in performance when measured in GXTCOOL, emphasizing the importance of continuing to train these areas. However, our study also alludes to prioritizing improved perceived thermal and/or exertional strain, to minimize behavioral attempts to thermoregulate. Therefore, monitoring thermal sensation, comfort and RPE relative to fixed velocities and durations during an athlete's training program in a hot environment (i.e., heat acclimation) would appear useful to track improvement. Furthermore, both short- and long-term acclimation training appear effective strategies for improving perceived thermal strain,Citation21,Citation64-Citation66 as may the acute approach of adopting a menthol mouth rinse.Citation67 During acclimation training, the adoption of high humidity conditions or using ergogenic aids, such as sauna suits,Citation68 that minimize heat loss, may be effective methods of accentuating perceived thermal strain, due to the potential link between thermal comfort and skin wetness.Citation69
Conclusion
In conclusion, predicting running performance in the heat from GXTCOOL appears more appropriate than GXTHOT, possibly due to the progressive onset of heat strain not replicating that of the time trial. The vV̇O2max also appears to remain the best predictor, when running endurance performance occurs in the heat. Finally, the model of the traditional determinants of endurance running performance; vV̇O2max, V̇O2max, RE, LT, and LTP, appear pre-requisites for endurance performance in the heat, but may explain less variance in performance than previously reported in cool conditions, albeit over longer distances.
Abbreviations
| GXT | = | Graded exercise tesp |
| GXTCOOL | = | Graded exercise test conducted in cool environment |
| GXTHOT | = | Graded exercise test conducted in hot environment |
| HR | = | Heart rate |
| LT | = | Lactate threshold |
| LTP | = | Lactate turnpoint |
| RE | = | Running economy |
| RER | = | Respiratory exchange ratio |
| RH | = | Relative humidity |
| RPE | = | Rating of perceived exertion |
| TCORE | = | Core temperature |
| TS | = | Thermal sensation |
| TSKIN | = | Skin temperature |
| TT | = | Time trial exercise protocol |
| V̇O2 | = | Oxygen consumption |
| V̇O2max | = | Maximal oxygen consumption |
| V̇O2peak | = | Peak oxygen uptake |
| vV̇O2max | = | Estimated velocity at maximal oxygen consumption |
| WBGT | = | Wet bulb globe index |
Disclosure of potential conflicts of interest
No potential conflicts of interest were disclosed.
Related Research Data
References
- Bassett DR, Howley ET. Limiting factors for maximum oxygen uptake and determinants of endurance performance. Med Sci Sports Exerc. 2000;32(1):70-84; PMID:10647532. doi:10.1097/00005768-200001000-00012.
- Coyle EF. Physiological determinants of endurance exercise performance. J Sci Med Sport. 1999;2(3):181-189; PMID:10668757. doi:10.1016/S1440-2440(99)80172-8.
- Coyle EF, Coggan AR, Hopper MK, Walters TJ. Determinants of endurance in well-trained cyclists. J Appl Physiol. 1988;64(6):2622-2630; PMID:3403447.
- Denadai B, Ortiz M, Mello M. Physiological indexes associated with aerobic performance in endurance runners: effects of race duration. Rev Bras Med do Esporte. 2004;10:405-407.
- Jacobs RA, Rasmussen P, Siebenmann C, Díaz V, Gassmann M, Pesta D, Gnaiger E, Nordsborg NB, Robach P, Lundby C. Determinants of time trial performance and maximal incremental exercise in highly trained endurance athletes. J Appl Physiol. 2011;111(5):1422-1430; PMID:21885805. doi:10.1152/japplphysiol.00625.2011.
- Jones AM, Doust JH. The validity of the lactate minimum test for determination of the maximal lactate steady state. Med Sci Sports Exerc. 1998;30(8):1304-1313; PMID:9710874. doi:10.1097/00005768-199808000-00020.
- Joyner MJ, Coyle EF. Endurance exercise performance: the physiology of champions. J Physiol. 2008;586(1):35-44; PMID:17901124. doi:10.1113/jphysiol.2007.143834.
- McLaughlin JE, Howley ET, Bassett DR, Thompson DL, Fitzhugh EC. Test of the classic model for predicting endurance running performance. Med Sci Sports Exerc. 2010;42(5):991-997; PMID:19997010. doi:10.1249/MSS.0b013e3181c0669d.
- Stratton E, O'Brien B, Harvey J, Blitvich J, McNicol AJ, Janissen D, Paton C, Knez W. Treadmill velocity best predicts 5000-m run performance. Int J Sports Med. 2008;30(1):40-45; PMID:19202577. doi:10.1055/s-2008-1038761.
- Jones AM, Carter H. The effect of endurance training on parameters of aerobic fitness. Sport Med. 2000;29(6):373-386; PMID:8066471. doi:10.2165/00007256-200029060-00001.
- Joyner MJ. Modeling: optimal marathon performance on the basis of physiological factors. J Appl Physiol. 1991;70(2):683-687; PMID:2022559. doi:0161-7567/91.
- Nybo L, Rasmussen P, Sawka MN. Performance in the heat-physiological factors of importance for hyperthermia-induced fatigue. Compr Physiol. 2014;4(2):657-689; PMID:24715563. doi:10.1002/cphy.c130012.
- Lorenzo S, Minson CT, Babb TG, Halliwill JR. Lactate threshold predicting time-trial performance: impact of heat and acclimation. J Appl Physiol. 2011;111(1):221-227; PMID:21527667. doi:10.1152/japplphysiol.00334.2011.
- Periard JD, Racinais S. Performance and pacing during cycle exercise in hyperthermic and hypoxic conditions. Med Sci Sports Exerc. 2016;48(5):845-853; PMID:26656777. doi:10.1249/MSS.0000000000000839.
- Schlader ZJ, Simmons SE, Stannard SR, Mundel T. The independent roles of temperature and thermal perception in the control of human thermoregulatory behavior. Physiol Behav. 2011;103(2):217-224; PMID:21315099. doi:10.1016/j.physbeh.2011.02.002.
- Flouris AD, Schlader ZJ. Human behavioral thermoregulation during exercise in the heat. Scand J Med Sci Sports. 2015;25 Suppl 1:52-64; PMID:25943656. doi:10.1111/sms.12349.
- Schlader ZJ, Stannard SR, Mündel T. Evidence for thermoregulatory behavior during self-paced exercise in the heat. J Therm Biol. 2011;36(7):390-396. doi:10.1016/j.jtherbio.2011.07.002.
- Schlader ZJ, Perry BG, Jusoh MRC, Hodges LD, Stannard SR, Mündel T. Human temperature regulation when given the opportunity to behave. Eur J Appl Physiol. 2013;113(5):1291-1301; PMID:23179204. doi:10.1007/s00421-012-2544-0.
- Cheuvront SN, Kenefick RW, Montain SJ, Sawka MN. Mechanisms of aerobic performance impairment with heat stress and dehydration. J Appl Physiol. 2010;109(6):1989-1995; PMID:20689090. doi:10.1152/japplphysiol.00367.2010.
- Périard JD, Cramer MN, Chapman PG, Caillaud C, Thompson MW. Cardiovascular strain impairs prolonged self-paced exercise in the heat. Exp Physiol. 2011;96(2):134-144; PMID:20851861. doi:10.1113/expphysiol.2010.054213.
- James CA, Richardson AJ, Watt PW, Willmott AGB, Gibson OR, Maxwell NS. Short term heat acclimation improves the determinants of endurance performance and 5,000 m running performance in the heat. Appl Physiol Nutr Metab. 2016;42(3):285-294; PMID:28177747; doi:10.1139/apnm-2016-0349.
- Sawka MN, Burke LM, Eichner ER, Maughan RJ, Montain SJ, Stachenfeld NS. American College of Sports Medicine position stand. Exercise and fluid replacement. Med Sci Sports Exerc. 2007;39(2):377-390; PMID:17277604. doi:10.1249/mss.0b013e31802ca597.
- Siri WE. The gross composition of the body. Adv Biol Med Phys. 1956;4:239-280; PMID:13354513. doi:10.1016/B978-1-4832-3110-5.50011-X.
- Barnett A, Maughan RJ. Response of unacclimatized males to repeated weekly bouts of exercise in the heat. Br J Sports Med. 1993;27(1):39-44; PMID:8457812. doi:10.1136/bjsm.27.1.39.
- Reilly T, Waterhouse J. Circadian aspects of body temperature regulation in exercise. J Therm Biol. 2009;34(4):161-170. doi:10.1016/j.jtherbio.2009.01.005.
- Jones AM. Middle and Long distance running. In: Sport and exercise physiology testing guidelines: volume i – sport testing: the british association of sport and exercise sciences guide, vol. 2006. London: Routledge; 2006. p. 384.
- Jones AM, Doust JH. A 1% treadmill grade most accurately reflects the energetic cost of outdoor running. J Sports Sci. 1996;14(4):321-327; PMID:8887211. doi:10.1080/02640419608727717.
- Stannard AB, Brandenburg JP, Pitney WA, Lukaszuk JM. Effects of wearing a cooling vest during the warm-up on 10-km run performance. J Strength Cond Res. 2011;25(2):2018-2024; PMID:21448075. doi:10.1519/JSC.0b013e3181e07585.
- Ramanathan NL. A new weighting system for mean surface temperature of the human body. J Appl Physiol. 1964;19(3):531-533; PMID:14173555.
- Borg G. Borg's perceived exertion and pain scales. Champaign, Illinois: Human Kinetics; 1998.
- Gagge A, Stolwijk J, Saltin B. Comfort and thermal sensations and associated physiological responses during exercise at various ambient temperatures. Environ Res. 1969;229:209-229; PMID:5788908. doi:10.1016/0013-9351(69)90037-1.
- Saunders PU, Green DJ. Runners and Walkers. In: Tanner RK, Gore CJ, editors. Physiological tests for elite athletes, vol 2nd ed. Champaign, Illinois: Human Kinetics; 2013. p. 397-409.
- Midgley AW, Carroll S. Emergence of the verification phase procedure for confirming “true” VO2max. Scand J Med Sci Sport. 2009;19(3):313-322; PMID:19422662. doi:10.1111/j.1600-0838.2009.00898.x.
- James CA, Willmott AGB, Richardson AJ, Watt PW, Maxwell NS. Ischaemic preconditioning does not alter the determinants of endurance running performance in the heat. Eur J Appl Physiol. 2016;116:1-11; PMID:27406142. doi:10.1007/s00421-016-3430-y.
- Lakens D. Calculating and reporting effect sizes to facilitate cumulative science: a practical primer for t-tests and ANOVAs. Front Psychol. 2013;4:863; PMID:24324449 doi:10.3389/fpsyg.2013.00863.
- Cohen J. statistical power analysis for the behavioral sciences (2nd Ed.). New Jersey: Lawrence Erlbaum; 1988.
- Morgan DW, Baldini FD, Martin PE, Kohrt WM. Ten kilometer performance and predicted velocity at VO2max among well-trained male runners. Med Sci Sports Exerc. 1989;21(1):78-83; PMID:2927305. doi:10.1249/00005768-198902000-00014.
- Noakes T, Myburgh K, Schall R. Peak treadmill running velocity during the VO2 max test predicts running performance. J Sports Sci. 1990;8(1):35-45; PMID:2359150. doi:10.1080/02640419008732129.
- Londeree B. The use of laboratory test results with long distance runners. Sport Med. 1986;3:201-213; PMID:3520749. doi:10.2165/00007256-198603030-00004.
- Cramer MN, Jay O. Explained variance in the thermoregulatory responses to exercise: the independent roles of biophysical and fitness/fatness-related factors. J Appl Physiol. 2015;119(9):982-989; PMID:26316511. doi:10.1152/japplphysiol.00281.2015.
- Jay O, Bain AR, Deren TM, Sacheli M, Cramer MN. Large differences in peak oxygen uptake do not independently alter changes in core temperature and sweating during exercise. Am J Physiol Regul Integr Comp Physiol. 2011;301(3):R832-41; PMID:21697517. doi:10.1152/ajpregu.00257.2011.
- Brandon L. Physiological factors associated with middle distance running performance. Sport Med. 1995;19(4):268-277; PMID:7604199. doi:10.2165/00007256-199519040-00004.
- Grant S, Craig I, Wilson J, Aitchison T. The relationship between 3 km running performance and selected physiological variables. J Sports Sci. 1997;15(4):403-410; PMID:9293417. doi:10.1080/026404197367191.
- Chan KOW, Wong SHS, Chen YJ. Effects of a hot environment on simulated cycling and running performance in triathletes. J Sports Med Phys Fitness. 2008;48(2):149-157; PMID:18427408. doi:10.1097/00005768-200305001-00186.
- Costill DL, Thomason H, Roberts E. Fractional utilization of the aerobic capacity during distance running. Med Sci Sports Exerc. 1973;5(4):248-252; PMID:4774203. doi:10.1249/00005768-197300540-00007.
- Farrell PA, Wilmore JH, Coyle EF, Billing JE, Costill DL. Plasma lactate accumulation and distance running performance. Med Sci Sports Exerc. 1979;11(4):338-344; PMID:8231751. doi:10.1249/00005768-197901140-00005.
- Bassett DR, Howley ET. Maximal oxygen uptake: “classical” versus “contemporary” viewpoints. Med Sci Sports Exerc. 1997;29(5):591-603; PMID:9140894. doi:10.1097/00005768-199705000-00002.
- Billat VL, Demarle A, Slawinski J, Paiva M, Koralsztein JP. Physical and training characteristics of top-class marathon runners. Med Sci Sports Exerc. 2001;33(12):2089-2097; PMID:11740304. doi:10.1097/00005768-200112000-00018.
- Yoshida T, Udo M, Iwai K, Yamaguchi T. Physiological characteristics related to endurance running performance in female distance runners. J Sports Sci. 1993;11(1):57-62; PMID:8450587. doi:10.1080/02640419308729964.
- Rowell LB, Marx HJ, Bruce R a, Conn RD, Kusumi F. Reductions in cardiac output, central blood volume, and stroke volume with thermal stress in normal men during exercise. J Clin Invest. 1966;45(11):1801-1816; PMID:5926447. doi:10.1172/JCI105484.
- De Ruiter CJ, De Haan A. Temperature effect on the force/velocity relationship of the fresh and fatigued human adductor pollicis muscle. Pflugers Arch Eur J Physiol. 2000;440(1):163-170; PMID:10922017. doi:10.1007/s004240000284.
- Aaron EA, Seow KC, Johnson BD, Dempsey JA. Oxygen cost of exercise hyperpnea: implications for performance. J Appl Physiol. 1992;72(5):1818-1825; PMID:1601791.
- Houmard JA, Craib MW, O'Brien KF, Smith LL, Israel RG, Wheeler WS. Peak running velocity, submaximal energy expenditure, VO2max, and 8 km distance running performance. J Sports Med Phys Fitness. 1991;31(3):345-350; PMID:1798303.
- Ely BR, Cheuvront SN, Kenefick RW, Sawka MN. Aerobic performance is degraded, despite modest hyperthermia, in hot environments. Med Sci Sports Exerc. 2010;42(1):135-141; PMID:20010120. doi:10.1249/MSS.0b013e3181adb9fb.
- Schmit C, Duffield R, Hausswirth C, Coutts AJ, Le Meur Y. Pacing adjustments associated with familiarisation: Heat vs. Temperate environments. Int J Sports Physiol Perform. 2015;11(7):855-860; PMID:26694885. doi:10.1123/ijspp.2015-0572.
- Watson P, Hasegawa H, Roelands B, Piacentini MF, Looverie R, Meeusen RR. Acute dopamine/noradrenaline reuptake inhibition enhances human exercise performance in warm, but not temperate conditions. J Physiol. 2005;565(Pt 3):873-883; PMID:15831540. doi:10.1113/jphysiol.2004.079202.
- Marino FE. Anticipatory regulation and avoidance of catastrophe during exercise-induced hyperthermia. Comp Biochem Physiol B Biochem Mol Biol. 2004;139(4):561-569; PMID:15581788. doi:10.1016/j.cbpc.2004.09.010.
- Potteiger JA, Weber SF. Rating of perceived exertion and heart rate as indicators of exercise intensity in different environmental temperatures. Med Sci Sports Exerc. 1994;26(6):791-796; PMID:8052119. doi:10.1249/00005768-199406000-00020.
- Albertus Y, Tucker R, St Clair Gibson A, Lambert EV, Hampson DB, Noakes TD. Effect of distance feedback on pacing strategy and perceived exertion during cycling. Med Sci Sports Exerc. 2005;37(14):461-468; PMID:15741846. doi:10.1249/01.MSS.0000155700.72702.76.
- Joseph T, Johnson B, Battista RA, Wright G, Dodge C, Porcari JP, de Koning JJ, Foster C. Perception of fatigue during simulated competition. Med Sci Sports Exerc. 2008;40(2):381-386; PMID:18202562. doi:10.1249/mss.0b013e31815a83f6.
- Morrison SA, Cheung SS, Cotter JD. Importance of airflow for physiologic and ergogenic effects of precooling. J Athl Train. 2014;49(5):632-639; PMID:25144598. doi:10.4085/1062-6050-49.3.27.
- Stevens CJ, Dascombe BJ. The reliability and validity of protocols for the assessment of endurance sports performance: an updated review. Meas Phys Educ Exerc Sci. 2015;19(4):177-185. doi:10.1080/1091367X.2015.1062381.
- St Clair Gibson A, Lambert EV, Rauch LH, Tucker R, Baden DA, Foster C, Noakes TD. The role of information processing between the brain and peripheral physiological systems in pacing and perception of effort. Sport Med. 2006;36(8):705-722; PMID:16869711. doi:10.2165/00007256-200636080-00006.
- Gibson OR, Mee JA, Tuttle JA, Taylor L, Watt PW, Maxwell NS. Isothermic and fixed intensity heat acclimation methods induce similar heat adaptation following short and long-term timescales. J Therm Biol. 2015;49-50:55-65; PMID:25774027. doi:10.1016/j.jtherbio.2015.02.005.
- Mee JA, Gibson OR, Doust JH, Maxwell NS. A comparison of males and females' temporal patterning to short- and long-term heat acclimation. Scand J Med Sci Sports. 2015;25 Suppl 1:250-258; PMID:25943676. doi:10.1111/sms.12417.
- Ruddock AD, Thompson SW, Hudson SA, James CA, Gibson OR, Mee JA. Combined active and passive heat exposure induced heat acclimation in a soccer referee before 2014 FIFA World Cup. Springerplus. 2016;5(1):617; PMID:27330883. doi:10.1186/s40064-016-2298-y.
- Stevens CJ, Thoseby B, Sculley D V, Callister R, Taylor L, Dascombe BJ. Running performance and thermal sensation in the heat are improved with menthol mouth rinse but not ice slurry ingestion. Scand J Med Sci Sports. 2015;26(10):1209-16; PMID:26408395. doi:10.1111/sms.12555.
- Mee JA, Peters S, Doust J, Maxwell NS. Restricted sweat evaporation preceding short term heat acclimation accelerates adaption in females. Extrem Physiol Med. 2015;4(Suppl 1):A112; PMID:PMC4580878. doi:10.1186/2046-7648-4-S1-A112.
- Fukazawa T, Havenith G. Differences in comfort perception in relation to local and whole body skin wettedness. Eur J Appl Physiol. 2009;106(1):15-24; PMID:19159949. doi:10.1007/s00421-009-0983-z.
- Morgan DW, Martin PE, Kohrt WM. Relationship between distance running performance valocity at VO2max in well trained runners. Med Sci Sport Exerc. 1986;18(2):S37. doi:10.1249/00005768-198604001-00184.