
 ?Mathematical formulae have been encoded as MathML and are displayed in this HTML version using MathJax in order to improve their display. Uncheck the box to turn MathJax off. This feature requires Javascript. Click on a formula to zoom.
ABSTRACT
The physiological functions of Thyroid Stimulating Hormone (TSH) autoregulation, the ultra-short feedback loop inhibition of TSH by TSH itself, have not been determined. In this work we explored the role of TSH autoregulation in thyroid homeostasis. We synthesized the known physiology of autoregulation with theknown physiological relationships between thyroid hormones; in particular between free thyroxine and TSH. We analysed the implications of TSH autoregulation, on the generation of the TSH response to free thyroxine (the ‘TSH curve’), and on the variation inthis response, which might result from variations in hypothalamopituitary or thyroid gland function. Our analysis demonstrated that, in the circumstances of inter-individual and intra-individual variations to hypothalamo-pituitary function TSH autoregulation lessens variation in the TSH curve. This in turn enhances the probability of generating and maintaining a euthyroid free thyroxine value. This contribution of TSH autoregulation to the stabilisation of thyroid physiology offers a logical explanation for the evolutionary selection of this physiological process.
Introduction
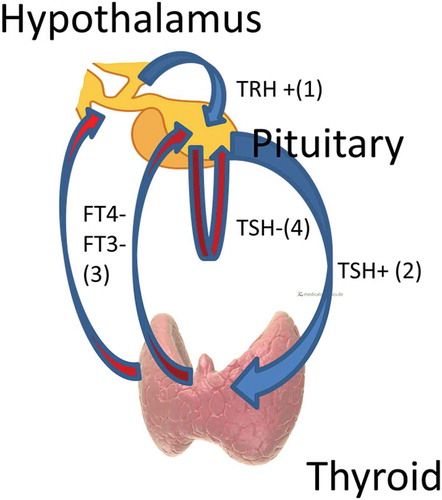
The thyroid gland is regulated predominantly by a feedback system whereby the secretion of thyroid hormones (principally free thyroxine (FT4)), is stimulated by thyroid stimulating hormone (also known as thyrotropin or TSH), secreted by pituitary thyrotrophs [Citation1]. These thyroid hormones, (again principally FT4), inhibit the secretion of TSH by pituitary thyrotrophs [Citation1]. This inhibition acts directly on thyrotrophs and also via the inhibition of hypothalamic secretion of thyrotropin releasing hormone (TRH) [Citation1]. There is evidence that, in addition to the classical FT4/TSH feedback loops, there is autoregulation of TSH in that it feeds back to inhibit its own secretion [Citation2] ().
Figure 1. Thyroid regulation. Blue arrowheads/+ indicate stimulation, red arrowheads/- indicate inhibition. Hypothalamic TRH stimulates pituitary TSH (1) which stimulates thyroid hormone (predominantly FT4, but also FT3) production from the thyroid gland (2). FT4 and FT3 feedback negatively on the hypothalamus and pituitary, reducing levels of TRH and TSH (3). There is also negative feedback by TSH on its own production by the pituitary, i.e. TSH autoregulation (4).
The existence of TSH autoregulation has been demonstrated by rabbit studies of hypothyroidism, using species – specific assay for rabbit TSH. These studies showed a fall in rabbit TSH levels when human TSH was injected [Citation3]. After prolonged hypothyroidism this fall could not be demonstrated, indicating a possible loss of autoregulation in this circumstance. Autoregulation was found to be a sensitive system such that the suppression of rabbit TSH was of the same order as the rise in human TSH levels [Citation3]. Autoregulation was active with changes to human TSH levels [Citation3] corresponding to physiological levels.
Autoregulation is not unique to TSH physiology, as autoregulation of LH (Luteinising Hormone) [Citation3], FSH (Follicle Stimulating Hormone) [Citation4], prolactin [Citation5] and ACTH (Adrenocorticotropic Hormone) secretion [Citation6] has also been demonstrated.
Studies of TSH autoregulation indicate the presence of an ultra-short feedback loop, i.e. that the pituitary is one site of feedback, but do not exclude a possible short-loop feedback control at a hypothalamic level [Citation7]. The folliculo-stellate cells in the pituitary have been found to harbour TSH receptors [Citation8] suggesting that the TSH autoregulation occurs via paracrine mechanisms rather than by autocrine feedback on the thyrotroph itself.
The physiological and clinical significance of TSH autoregulation has not been extensively studied or considered, and has remained unclear. It has been suggested that autoregulation is involved in the fine-tuning of TSH secretion [Citation2], and the generation of TSH pulses in the human pituitary [Citation9]. Binding of TSH receptor autoantibodies to pituitary TSH receptors may result in continued TSH suppression in treated euthyroid patients with Graves’ disease [Citation10,Citation11]. These proposed minor roles are incongruous with the documented sensitivity of autoregulation [Citation3].
How autoregulation relates to the FT4/TSH feedback loop, and, what if any, survival advantages it might thereby confer, have not been articulated. Intuitively, autoregulation appears to antagonise this dominant feedback loop which ensures that should the FT4 level fall, TSH rises to stimulate FT4 production. That is, the fact that any increase in the TSH level will itself inhibit a further increase in the TSH level is a mechanism potentially compromising this compensation of the FT4/TSH feedback loop.
In this work we explored the consequences of TSH autoregulation, on the generation of the pituitary TSH response to FT4, and on the variations in this response, which might result from variations to hypothalamo-pituitary function or thyroid function. We aimed to propose the place of TSH autoregulation in thyroid homeostasis.
Method
Our method was entirely theoretical. We synthesised existing data and models and deduced the implied consequences. provides a glossary forour abbreviations and important terms used in this paper.
The fundamental premises that we used as the basis of our analysis were,
TSH levels increase in response to decreasing levels of FT4.
Increasing levels of TSH will increasingly suppress TSH levels (TSH autoregulation).
Alteration to the number or function of thyrotrophs may affect the TSH level.
All three of these premises are strongly supported by empiric data (detailed below) and represent current concepts of thyroid physiology.
The negative log-linear relationship between FT4 and TSH is well described (12–14). We termed the line of best fit for this relationship the “TSH curve” (). This curve was formulated experimentally by measuring the TSH level in normal [Citation12], or hypothyroid [Citation13,Citation14] individuals at various levels of FT4 attained by thyroxine dosing. The details of the curve vary with the method of study, but this variation is not relevant to this work. Other workers have claimed, on the basis of population data, that this relationship is not strictly log-linear [Citation15,Citation16], with there being still greater increases and decreases in TSH levels with lower and higher FT4 levels respectively. Our work suggests that such claims are based on a misunderstanding of the population data [Citation17], but for the purposes of this work, this distinction is again not relevant. All that is important for this work is that there is a negative relationship of some description between TSH and varying levels of FT4.
Figure 2. The TSH curve as empirically determined in normal individuals [Citation1].
![Figure 2. The TSH curve as empirically determined in normal individuals [Citation1].](/cms/asset/0b4c26e5-3907-4c33-99c4-84fa49ee3178/ktmp_a_1513110_f0002_b.gif)
For the description of autoregulation, we based our analysis on the data published by Kakita [Citation3] (). Kakita measured TSH suppression with increasing doses and levels of administered TSH.
Figure 3. The curve describing autoregulation as per the studies of Kakita [Citation3]. The rabbit TSH level in rabbits with acute hypothyroidism was progressively inhibited by increasing levels of exogenously administered human TSH.
![Figure 3. The curve describing autoregulation as per the studies of Kakita [Citation3]. The rabbit TSH level in rabbits with acute hypothyroidism was progressively inhibited by increasing levels of exogenously administered human TSH.](/cms/asset/48ba5a29-aa4b-4f75-b232-3131fd4d0839/ktmp_a_1513110_f0003_b.gif)
The third premise, that thyrotroph secretion of TSH may be altered by changes to thyrotroph number or function, was based on extensive literature concerning thyrotroph hypofunction [Citation18–Citation20] and hyperfunction [Citation21,Citation22].
So as to articulate the physiological processes subject to our analysis, we needed to provide an expression for what the TSH level would be in the absence of TSH autoregulation. This level would result from the total thyrotroph response to FT4, unaffected by autoregulation. We chose the term “tsh level”. In a system where autoregulation did not exist, tsh and TSH levels would by definition be identical, whereas in a system that included autoregulation, the tsh level would be a mathematical abstraction dependent upon the TSH level and the component of autoregulation.
By extension, “the tsh curve” represents the TSH curve that would exist in the absence of autoregulation.
We chose the symbol “r” to represent the relationship between tsh and TSH levels, such that TSH level would equal level.
In our process of analysis we then considered two scenarios, (a), autoregulation is not functioning, i.e. the TSH curve is equivalent to the tsh curve, and (b), autoregulation is functioning, i.e. the TSH curve results from the combination of the tsh curve and the effect of autoregulation. We also subdivided (b), to also consider autoregulation disappearing at low values of FT4.
We then examined the changes to the TSH curve which would occur in the circumstances of altered hypothalamo-pituitary, or thyroid gland, function in scenario (a), or (b). We could then determine the effect of autoregulation in these circumstances. On account of the paucity of quantitative data, for all of our analyses we initially explored the direction, rather than the extent, of any change effected by TSH autoregulation. Thereafter we analysed the data to provide an indicative quantification, in particular to exclude, as far as possible, the chance that any effect of autoregulation was trivial. We ensured our analyses applied with any model whereby, the TSH curve indicates progressive suppression of TSH levels by increasing levels of FT4, and autoregulation implies increasing suppression of TSH by increasing levels of TSH itself.
Results
We let r = (1- the relative inhibition of tsh due to autoregulation). Thereby TSH level = level. For example if there were 30% relative inhibition of the tsh level due to autoregulation, the TSH level would be 70% of the tsh level.
In the absence of autoregulation, r = 1 and therefore tsh level = TSH level. In the presence of autoregulation r < 1 and therefore TSH level< tsh level.
As with increasing levels of tsh there is increasing autoregulatory inhibition, with increasing levels of tsh, r must decrease. There is thus, with increasing levels of tsh, a progressive discrepancy between tsh and TSH levels ().
Figure 4. The calculated effect of autoregulation on the relationship between tsh and TSH levels.
For simplicity, we considered two identical TSH curves differing only in their derivation i.e. curves derived with or without the presence of TSH autoregulation. In this situation the respective tsh curves would have to differ so as to allow the TSH curves to be identical. However, the principles of our analysis remain unchanged with other possible evolutionary outcomes, including the possibility that the tsh curve remained unchanged with the evolutionary addition of autoregulation, such that the TSH curve was shifted downwards (see mathematical proof ). Whatever the evolutionary development, consequent on the logic of , the presence of autoregulation results in a TSH curve shifted downwards as compared to the tsh curve ().
Figure 5. The extension of the logic of to show the different relationships between the TSH curve and the tsh curve depending on the presence or absence of autoregulation. (a). TSH and tsh curves identical in the absence of autoregulation. (b). TSH curve lies below tsh curve in the presence of autoregulation. (c). TSH curve below tsh curve at normal/high values of FT4, but becomes identical to tsh curve at low values of FT4, when autoregulation is present but lost at low values of FT4 in chronic hypothyroidism.
Box 1. Glossary of abbreviations and important terms used in this paper.
Box 2. Mathematical proof.
We then considered the variations in the TSH curve that would follow variations to the number and/or function of pituitary thyrotrophs, with or without the presence of autoregulation. We first considered changes leading to increased levels of TSH.
Should there be a greater thyrotroph number and/or greater individual thyrotroph TSH secretion for any FT4 level, the tsh level for any FT4 level would be increased. If so, there would be an upwards shift in the tsh curve. In the situation of there being no autoregulation, the tsh curve is equivalent to the TSH curve, and so therefore, the TSH curve would move identically upwards.
However, in the presence of autoregulation the thyrotrophs (perhaps via the folliculo-stellate cells, as above) simultaneously would become exposed to this greater tsh level. In this circumstance, this increased tsh level must in turn lead to an opposing force, such that there is an increase in the degree of thyrotroph inhibition due to autoregulation. Consequently some damping of the upward shift in the TSH curve must ensue, such that the shift in the TSH curve is less than the shift in the tsh curve. There is thus a smaller shift in the TSH curve in the presence of autoregulation than in its absence. The same process would occur in reverse with tsh curve changes in the opposite direction ().
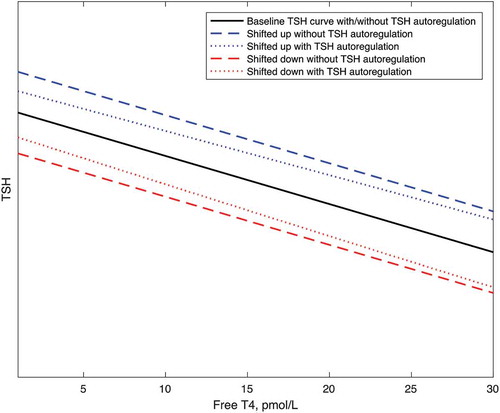
Figure 6. The deduced effect of autoregulation to dampen shifts up or down in the TSH curve due to changes in the tsh curve. With shifts up and down to the tsh curve, the corresponding shifts to the baseline TSH curve are less in the presence of autoregulation.
A consequence of TSH autoregulation therefore is to restrict the variation in the TSH level that might follow alterations to thyrotroph number or function. This restriction of TSH curve variation would apply to both, inter-individual and intra-individual variation in the TSH curve. As the FT4 level is a function of the TSH level [Citation1], this in turn would lead to a narrower population range for FT4, and to greater stability of the FT4 level in any individual.
Mathematically we can show that this restriction in the variability of TSH secretion will apply whenever TSH is progressively inhibited by progressive increases in the TSH level, i.e. regardless of the exact details of TSH autoregulation and the TSH curve. We can compare the effect of a change to the tsh level, on the TSH level, in the circumstances of this TSH level being derived, with, or without, the additional presence of autoregulation ().
The quantification of this effect of autoregulation to lessen the variability of TSH secretion involves the estimation of the slope of the curve describing autoregulation (i.e. a curve analogous to ). Information may be obtained from the human data concerning the suppression of TSH by TSH receptor antibodies in Graves’ disease [Citation11]. This data demonstrated that the level of TSH seen in the presence of TSH receptor antibodies was approximately 10% that seen in patients in whom these antibodies had disappeared (ie approximately 90% relative inhibition). We found another series of patients with hyperthyroidism whereby the hyperthyroidism was due to excess pituitary TSH [Citation23]. As the degree of hyperthyroidism in the Graves’ disease series was similar to that seen in the series of patients with TSH excess (FT4 approximately twice, and FT3 approximately thrice, the respective upper limits of normal), we considered the TSH receptor stimulation by the antibodies to be equivalent to the stimulation by the abnormal levels (average approximately 6mU/L) of TSH. This value of 6mU/L is also consistent with that suggested by previously published characteristic curves of thyroid response to TSH [Citation1]. Therefore, we considered the autoregulation (90%) seen in the group with TSH receptor antibodies to be equivalent to that expected with a TSH level of approximately 6 mU/L.
also gives an indication as to the slope of the relationship between autoregulation and TSH, but cannot be used directly, as the zero on its x-axis describes an added level of zero, rather than a TSH level of zero. We extrapolatedFootnote1 the curve backwards to the origin using different values for autoregulation at the baseline TSH to indicate a plausible range of values for autoregulation in the physiological range. This range was consistent with the above human data, though in this case the estimate applies to experimental rabbits loaded transiently with extra (Human) TSH [Citation3].
The rabbit experimental data [Citation3] also includes values for TSH after prolonged hypothyroidism i.e. the time at which autoregulation could no longer be demonstrated. These TSH values were much higher than those seen when autoregulation could be demonstrated and the difference therefore also provides an indication as to the quantification of TSH regulation. Again the degree of autoregulation (approximately 70%) was consistent with the human data.
Though these three methods of quantifying the slope of autoregulation differ, the fact that they provide similar slopes supports their accuracy. In the physiological range, the slope is steep (approximately 10–15% inhibition per mU/L TSH), suggesting that TSH autoregulation is not a trivial process.
In our estimates of the effects of autoregulation we calculated the effect of autoregulation on a doubling or halving of tsh that would, in the absence of autoregulation, result in a shift of TSH from 2 to 4, or from 2 to 1.We performed the calculations assuming that autoregulation was as per, or half as indicated by the TSH-receptor antibody data.Footnote2 Our calculations assuming full autoregulation indicate that, whereas in the absence of autoregulation the total TSH range would be 3, (1 – 4), in the presence of autoregulation the range would be 1.9, (1.2–3.1). If the effect of autoregulation was only half as estimated the range would be reduced to 2.4, (1.1–3.5). Such reductions in the range of TSH would in an average person reduce the variation in FT4 by 5 and 3 pmol/L respectively [Citation1]. In individuals with thyroids more responsive to TSH, the reduction in FT4 variation/reduction in TSH variation would be greater.
The smaller day to day fluctuations in TSH (0.16–1.27) [Citation24], appear to drive rather than respond to, changes to FT4 [Citation24]. Autoregulation at this level would reduce fluctuations in FT4 by approximately 1 pmol/L (again varying with thyroid responsiveness), this representing approximately 20% of normal FT4 fluctuation [Citation24].
As, according to our analysis, the baseline state TSH curves, with, or without the presence of autoregulation, are identical, autoregulation would not affect the physiological responses to primary changes to thyroid function. Again, consideration of the other possibility, i.e. of the TSH curve being shifted downwards by the addition of autoregulation, does not change this conclusion as the relative changes to TSH consequent upon changes to FT4 would be constant.
However, as indicated above, it has been suggested that in prolonged hypothyroidism, TSH autoregulation disappears [Citation3], such that the TSH curve resembles the tsh curve. Possible reasons for this loss of TSH autoregulation include the changing isoforms of TSH in hypothyroidism [Citation25] and receptor down-regulation. In these circumstances of loss of autoregulation in prolonged hypothyroidism, the TSH response to hypothyroidism would be advantageously augmented relative to the euthyroid state, as compared to the TSH response in the absence of there being TSH autoregulation ()).This mechanism is consistent with the curvature of the population FT4/log TSH relationship [Citation15,Citation16] and the shift in TSH curves in hypothyroidism previously proposed [Citation17].
The evidence for the loss of TSH autoregulation in prolonged primary hypothyroidism is the inability of human TSH to suppress rabbit TSH in animals that were profoundly hypothyroid for 2–3 months [Citation3]. An alternative explanation for this phenomenon is that in these animals maximal autoregulation had been attained [Citation3], that is, that TSH suppression in response to endogenous TSH was such that exogenous TSH could exert no further effect. This possibility, which would be neither advantageous nor disadvantageous, seems unlikely given the later-discovered, above mentioned, curvature of the population relationship and shift in TSH curves. That is, in chronic primary hypothyroidism, the fact that TSH levels are so high, argues against there being a significant effect of autoregulation to blunt the TSH rise, in this circumstance.
In primary hyperthyroidism there are low/undetectable levels of TSH. The process of autoregulation is not likely to affect significantly the TSH response to hyperthyroidism as at low levels of TSH, TSH levels approximate tsh levels (). Analogously to the situation in primary hypothyroidism, the fact that TSH levels are undetectable in the thyrotoxic state indicates that, in the presence of autoregulation, there remains an appropriate protective loss of TSH secretion. The suppression of TSH secretion by TSH autoantibodies (autoantibodies which bind TSH receptors and act like TSH to stimulate the thyroid), found in Graves’ hyperthyroidism [Citation10,Citation11] would potentially be advantageous.
Discussion
Our analysis here shows that TSH autoregulation offers advantages to individuals in the event of variations to hypothalamo-pituitary function, by stabilizing the FT4 level, via the mechanism of minimising the variation in the TSH response to FT4. We found no significant disadvantage and possibly some advantages of the presence of autoregulation in primary thyroid disorders. Hence there are logical reasons for the evolutionary development and persistence of autoregulation.
The strength of our conclusions varies. Our initial conclusions, regarding the general direction of the effects of autoregulation, must hold, providing the underlying physiological data is sound. However, our quantification, though apparently consistent across analysis of different methods and species, is based on few data, averaging and extrapolations. We have therefore used a sensitivity analysis to indicate that even with very conservative estimates the effects of autoregulation are likely to be significant. Autoregulation, like most physiological feedback loops, must, to be advantageous, be sufficiently potent to reduce variation, but not so potent as to block it completely and thereby prevent adaptation.
The evolution of the control of FT4 by TSH, which followed the evolution of the thyroid gland [Citation26], has lessened the effects of inter- and intra-individual variation in thyroid gland secretory capacity on the variation in FT4 levels. As the evolution of TSH autoregulation has analogously lessened the effects of inter- and intra-individual variation in thyrotroph physiology on variations to TSH levels, and as the FT4 level depends upon the TSH level, it follows that TSH autoregulation also acts to decrease variation in FT4 levels.
As the TRH feedback loops also have a homeostatic function to lessen variation in pituitary function, it follows that TSH autoregulation would be most significant in the circumstances of altered hypothalamic function. There thus appears to be a hierarchy of homeostatic mechanisms acting on different parts of thyroid physiology.
TSH autoregulation gives individual thyrotrophs the ability to communicate with each other, by sensing the total TSH output of the pituitary gland. The individual thyrotrophs respond to this signal adjusting their individual TSH curves to serve homeostasis. By this mechanism the thyrotrophs are able to function to some extent as an integrated organ rather than as just a collection of individual cells responding individually to the ambient thyroid hormone levels.
Our conclusions support our previous work indicating that FT4 levels represent equilibrium points rather than set points [Citation27]. This work in turn has recently been confirmed by the demonstration that physiological regulation in general may be based on equilibrium points rather than set points [Citation28]. Mechanisms that defend the TSH response to FT4 have a clear purpose in the context of FT4 levels being equilibrium values, whereas if FT4 values were set by the hypothalamus-pituitary, and the TSH response to FT4 reflected the error signal from the discrepancy between the ambient FT4 level and the set point [Citation29], there would be little or no need to have a mechanism such as autoregulation to defend the TSH response to FT4. The model of thyroid regulation by which the body strove to maintain a “target”, set point FT4 level, may thus have obscured the function and advantages of TSH autoregulation.
Though Kakita’s study (3) showed that increasing levels of human TSH result in increasing suppression of rabbit TSH, this study was performed with peripheral administration of the human TSH, in animals with a restricted range of hypothyroidism. The details of TSH autoregulation therefore remain unknown and thus our figures indicating parallel TSH curves without autoregulation, and slight curvature with autoregulation, may be a simplification. However, as per our proof, the principles of our analysis do not depend on an exact knowledge of the details of the physiology. The conclusions are valid with any physiological model in which increasing TSH levels progressively stimulate FT4 levels, increasing FT4 levels progressively inhibit TSH levels, and increasing TSH levels themselves progressively inhibit TSH levels.
Our analysis, which is theoretical, reveals the implications of what is known of TSH autoregulation. Empiric study of this process would present technical challenges (9). Nevertheless, Kakita’s studies could be repeated in euthyroid animals, and, in theory, thyroid homeostasis could be studied, and our conclusions tested, in physiological models of TSH autoregulation knock-out. In particular such studies could further quantify the effects that we have determined, and examine the relative importance of TSH autoregulation as compared to other homeostatic mechanisms.
Our work does not exclude the possibility that autoregulation of TSH may also provide other evolutionary advantages, and function as previously suggested [Citation2,Citation9].Our analysis may also help elucidate the function of the autoregulation of other hormones.
Disclosure statement
No potential conflict of interest was reported by the authors.
Additional information
Funding
Notes
1. While fully recognising the difficulties due to the degree of extrapolation and the incredibly strong influence of the chosen function that was fitted to the data.
2. The antibody data gave us two data points: TSH = 0, with relative inhibition = 0, and hence r(0) = 1; and TSH = 6, with relative inhibition = 0.9, and hence r = 0.1. Thus we assumed that .
References
- Dietrich JW, Landgrafe G, Fotiadou EH. TSH and thyrotropic agonists: key actors in thyroid homeostasis. J Thyroid Res. 2012;2012:29. Article ID 351864.
- Prummel MF, Brokken LJ, Wiersinga WM. Ultra short-loop feedback control of thyrotropin secretion. Thyroid. 2004;14(10):825–829.
- Kakita T, Labourde NP, Odell WD. Autoregulatory control of thyrotropin in rabbits. Endocrinology. 1984;114(6):2301–2305.
- Coutifaris C, Hyland L, Chappel SC. Autoregulation of Follicle-stimulating hormone secretion in the Hampster: evidencefor control at the level of the anterior pituitary. Endocrinology. 1984;114:2216.
- Bentley AM, Wallis M. In-vitro evidence for the autoregulation of prolactin secretion at the level of the pituitary gland in the rat. J Endocrinol. 1987;115:13–18.
- Boscaro M, Sonino N, Paoletta A, et al. Evidence for ultra-short loop autoregulation of adrenocorticotropin secretion in man. J Clin Endocrinol Metab. 1988;66(2):255–257.
- Kakita T, Odell WD. Pituitary gland: one site of ultrashort-feedback regulation for control of thyrotropin. Am J Physiol. 1986;250:E121–124.
- Prummel MF, Brokken LJS, Merduri G, et al. Expression of thyroid-stimulating hormone receptor in the Folliculo-Stellate cells of the human anterior pituitary. J Cin Endocrinol Metab. 2000;85(11):4347–4353.
- Dietrich JW, Tesche A, Pickardt CR, et al. Thyrotrophic feedback control: evidencefor an additional ultrashort feedback loop from fractal analysis.Cybern Syst. 2004;35:315–331.
- Yu H, Farahani P. Thyroid stimulating hormone suppression post-therapy in patients with graves’ disease: a systematic review of pathophysiology and clinical data. Clin Invest Med. 2015;38(1):E31–44.
- Brokken LJS, Wiersinga WM, Prummel MF. Thyrotrophin Receptor autoantibodies are associated with continued thyrotropin suppression in treated euthyroid Graves’ disease patients. J Clin Endocrinol Metab. 2003;88(9):4135–4138.
- Benhadi N, Fliers E, Visser TJ, et al. Pilot study on the assessment of the setpoint ofthe hypothalamus-pituitary-thyroid axis in healthy volunteers. Eur J Endocrinol. 2010;162(2):323–329.
- Fish LH, Schwartz HL, Cavanaugh J, et al. Replacement dose,metabolism and bioavailability of levothyroxine in the treatment of hypothyroidism. N Engl J Med. 1987;316:764–770.
- Reichlin S, Utiger RD. Regulation of the pituitary-thyroid axis in man: relationship of TSH concentration to concentration of free and total thyroxine in plasma. J ClinEndocr. 1967;27:251–255.
- Hadlow NC, Rothacker KM, Wardrop R, et al. The relationship between TSH and free T4 in a large population is complex and nonlinear anddiffers by age and sex. J Clin Endocrinol Metab. 2013;98(7):2936–2943.
- Hoermann R, Eckl W, Hoermann C, et al. Complex relationship between free thyroxine and TSH in the regulation of thyroid function. Eur J Endocrinol. 2010;162:1123–1129.
- Fitzgerald SP, Bean NG. The relationship between population T4/TSH set point data and T4/TSH physiology. J Thyroid Research. 2016;2016:7. Article ID 6351473.
- Kreitschmann-Andremahr I, Hoff C, Saller B, et al. Prevalence of pituitary deficiency in patients after aneurysmal subarachnoid hemorrhage. J Clin Endocrinol Metab. 2004;89(10):4986–4992.
- Garbutt JC, Mayo JP Jr., Gillette GM, et al. Dose –response studies with thyrotropin-releasing hormone in abstinent male alcoholics: evidence for selective thyrotroph dysfunction? J Stud Alcohol. 1991;52(3):275–280.
- Castinetti F, Reynaud R, Saveanu A, et al. Clinical and genetic aspects of combined pituitary hormone deficiencies. Ann Endocrinol (Paris). 2008;69(1):7–17.
- Socin HV, Chanson P, Delemer B, et al. The changing spectrum of TSH- secreting pituitary adenomas: diagnosis and management in 43 patients. Eur J Endocrinol. 2003;148:433–442.
- Beck- Peccoz P, Persani L, Asteria C, et al. Thyrotropin secreting pituitary tumours in hyper- and hypothyroidism. Acta Med Austriaca. 1996;23(1–2):41–46.
- Socin HV, Chanson P, Delemer B, et al. The changing spectrum of TSH-secreting pituitary tumours: diagnosisand management in 43 patients. Eur J Endocrinol. 2003;148:433–442.
- Andersen S, Pedersen KM, Bruun NH, et al. Narrow individual variations in serum T4 and T3 in normal subjects; A clue to the understanding of subclinical thyroid disease. J Clin Endocrinol Metab. 2002;87:1068–1072.
- Estrada JM, Soldin D, Buckey TM, et al. Thyrotropin isoforms: implications for thyrotropin analysis and clinical practice. Thyroid. 2014;24(3):411–423.
- Dumont J, Opitz R, Christophe D, et al. Ontogeny, anatomy, metabolism and physiology of the thyroid. 2015. DeGroot LJ, Beck-Peccoz P, Chroussos G, et al., editors. Endotext [Internet]. MDText.com Inc, cited Jul 15.
- Fitzgerald SP, Bean NG, Fitzgerald LN. Population data indicate that thyroid regulation is consistent with an equilibrium-point model, but not with a set point model. Temperature. 2017;4:114–116.
- Fitzgerald SP, Bean NG. Population correlations do not support the existence of set points for blood levels of calcium or glucose- a new model for homeostasis. Physiol Rep. 2018;6(1):e13551.
- Modell H, Cliff W, Michael J, et al. A physiologist’s view of homeostasis. Adv Physiol Educ. 2015;39(4):259–266.