
 ?Mathematical formulae have been encoded as MathML and are displayed in this HTML version using MathJax in order to improve their display. Uncheck the box to turn MathJax off. This feature requires Javascript. Click on a formula to zoom.
ABSTRACT
In a series of three companion papers published in this Journal, we identify and validate the available thermal stress indicators (TSIs). In this third paper, we conducted field experiments across nine countries to evaluate the efficacy of 61 meteorology-based TSIs for assessing the physiological strain experienced by individuals working in the heat. We monitored 372 experi-enced and acclimatized workers during 893 full work shifts. We continuously assessed core body temperature, mean skin temperature, and heart rate data together with pre/post urine specific gravity and color. The TSIs were evaluated against 17 published criteria covering physiological parameters, practicality, cost effectiveness, and health guidance issues. Simple meteorological parameters explained only a fraction of the variance in physiological heat strain (R2 = 0.016 to 0.427; p < 0.001), reflecting the importance of adopting more sophisticated TSIs. Nearly all TSIs correlated with mean skin temperature (98%), mean body temperature (97%), and heart rate (92%), while 66% of TSIs correlated with the magnitude of dehydration and 59% correlated with core body temperature (r = 0.031 to 0.602; p < 0.05). When evaluated against the 17 published criteria, the TSIs scored from 4.7 to 55.4% (max score = 100%). The indoor (55.4%) and outdoor (55.1%) Wet-Bulb Globe Temperature and the Universal Thermal Climate Index (51.7%) scored higher compared to other TSIs (4.7 to 42.0%). Therefore, these three TSIs have the highest potential to assess the physiological strain experienced by individuals working in the heat.
Introduction
Working in hot environments directly threatens people’s ability to live healthy and productive lives. Thirty-five percent of people who work in the heat experience physiological heat strain, which is associated with unfavorable health out-comes [Citation1]. A number of heat mitigation measures have been proposed to address this issue, most of which require the adoption of thermal stress indicators (TSIs) [Citation2–5]. These indicators are mathematical equations that combine two or more meteorological factors (temperature, humidity, wind, and solar radiation) to explain the physiological heat stress/strain experienced by someone.
In a series of three companion papers published in this Journal, we addressed the following three objectives. We identified the TSIs developed since the dawn of scientific research (part 1) [Citation6], we conducted a Delphi exercise to understand what is important to consider when adopting a TSI to protect individuals who work in the heat (part 2)[Citation7], and we conducted field experiments across nine countries to evaluate the efficacy of each TSI for quantifying the physiological strain experienced by individuals who work in the heat (part 3; present article). The first article [Citation6] of this series identified 340 unique TSIs previously developed to assess the heat stress and strain experienced by people performing various activities over a wide operating range and ambient conditions. Of these, 61 TSIs are meteo-based [i.e., can be calculated utilizing only meteorological data (air temperature, relative humidity, wind speed, and solar radiation)] and have been designed for use in occupational settings. Many of these TSIs bear the same name but use different calculation methods (e.g., Wet-Bulb Globe Temperature for indoor and outdoor conditions) and, therefore, we considered these as unique TSIs. Some of these TSIs have been frequently used to quantify the magnitude of physiological strain experienced by workers [Citation8–13]. However, the vast majority of occupational meteo-based TSIs have not undergone such testing and, therefore, it remains unknown whether they could be used to improve the efficacy of occupational heat stress mitigation strategies.
Previous studies assessing whether TSIs reflect the physiological heat strain experienced by working people have typically used body core temperature, skin temperature, and/or heart rate as criteria to judge the validity of the TSIs [Citation9,Citation14–21]. But, until recently, it remained unclear if body core temperature, skin temperature, heart rate, or hydration state are criteria that a TSI should be able to accurately reflect. Also, we remained naive as to the relative importance of each of these criteria in the assessment of a TSI. In the second article [Citation7] of this three-paper series, we performed a Delphi exercise identifying 17 criteria with varying weights that a TSI should be able to align with for protecting individuals who work in hot environments. The Delphi methodology is a well-established structured communication technique based on collecting opinions from a panel of experts while eliminating the influence of participants upon one another (i.e., using the rules of brainstorming where participants withhold judgment) [Citation22]. A necessary next step, therefore, would be to evaluate the above-mentioned 61 occupational meteo-based TSIs against these 17 criteria.
Identifying the most efficacious meteo-based TSI is critical since occupational heat stress affects workers’ health and productivity [Citation1,Citation14,Citation15,Citation23–25]. Working under occupational heat stress conditions leads to progressive rises in core temperature, cardiovascular strain, and fluid depletion, which can have acute and chronic effects, and may lead to heat stroke or death [Citation1,Citation26–28]. Also, meta-analytic data shows that 30% of individuals who work under heat stress report productivity losses [Citation1] with potentially large spill over effects on the entire economy [Citation29]. In the coming decades, individuals working in currently temperate climates may be at risk for heat illness on nearly 40 days/year [Citation30].
Based on knowledge gained in the previous parts of this series of companion papers, where all occupational meteo-based TSIs were identified [Citation6] and the 17 criteria to consider when adopting a TSI were determined [Citation7], the aim of this paper was to evaluate the capacity of all occupational meteo-based TSIs for quantifying the magnitude of physiological heat strain experience by workers in a large-scale series of field studies performed in multiple industries across several countries. The testing hypothesis was that these TSIs would reflect the magnitude of physiological heat strain experienced by workers. It is hoped that this work will facilitate the use of accurate environmental monitoring strategies in occupational settings to protect workers and the general population.
Methodology
The experimental protocol (ClinicalTrials.gov ID: NCT04160728) used in this study was approved by the Charles Darwin University Human Research Ethics Committee (no. H13144), the National Bioethical Review Board of Cyprus Ethics Review Board (no. 2017.01.61), the University of Ottawa Health Sciences and Science Research Ethics Board (no. H10–04–04b), the Danish National Committee on Health Research Ethics (no. 55907_v3_02012017), the University of Thessaly, School of Exercise Science (no. 1217), and the National Committee for Medical Ethics at the Ministry of Health of the Republic of Slovenia, in accordance with the Declaration of Helsinki. The study involved monitoring 372 (males: 87.3% and females: 12.7%) experienced (assessed work was their primary occupation) and acclimatized (i.e., living and working in the area for ≥2 months) workers () during one to five work shifts (in total 893 full work shifts) performed in nine countries (Australia, Canada, Cyprus, Denmark, Greece, Qatar, Slovenia, Spain, and the United States of America). It is important to note that some jobs were tested across multiple countries at different time periods. Parts of the data from Cyprus [Citation9,Citation15], Greece [Citation15], Qatar [Citation15,Citation17], Slovenia [Citation31], Spain [Citation15], and North American [Citation16,Citation18,Citation19] were previously published to investigate the physiological heat strain experienced by workers in these countries. Before their participation in the study, written informed consent was obtained from all volunteers after detailed explanation of all the procedures involved.
Table 1. Participant characteristics. Numbers in squared brackets correspond to International Standard Classification of Occupations (ISCO-08) codes.
Data collection
Self-reported age, body stature, and body mass were collected prior to the experiment. During the field studies, continuous heart rate, core temperature, and mean skin temperature data were collected using wireless heart rate monitors (Polar Team2, Polar Electro Oy, Kempele, Finland), telemetric capsules (BodyCap, Caen, France), and wireless thermistors (iButtons type DS1921H, Maxim/Dallas Semiconductor Corp., USA), respectively. Telemetric capsules were ingested approximately 30 minutes prior to each work-shift, as the time following ingestion does not significantly affect the validity of core temperature measurement in the absence of fluid consumption [Citation32]. Skin temperature data were collected from four sites (chest, arm, thigh, and leg) and were expressed as mean skin temperature according to Ramanathan: mean skin temperature = 0.3 × (chest + arm) + 0.2 × (thigh + leg) [Citation33]. For the North American studies, core temperature was recorded continuously using a wireless integrated physiological monitoring system (VitalSense, Mini Mitter, Bond, OR), while skin temperature was continuously measured at three sites (forearm, abdomen, and calf) using wireless telemetric dermal patches (VitalSense, Mini Mitter, Bond, OR) and mean skin temperature was expressed as the mean of the three sites [Citation18]. The adoption of different methods to estimate mean skin temperature (i.e., three vs. four measuring sites, different sites) did not interfere with our findings (please see “Results” section). Mean body temperature was computed using core temperature and mean skin temperature data according to Burton: mean body temperature = 0.35 × mean skin temperature + 0.65 × core temperature [Citation34]. Urine samples were collected and analyzed by experienced researchers pre- and post-work-shift to assess urine specific gravity using a refractometer (PAL-10S, Atago Co., Ltd., Fukaya, Saitama Prefecture, Japan) and urine color according to a urine color scale [Citation35]. Differences in urine specific gravity and urine color between pre- and post-work-shift samples were calculated to assess the labor-induced dehydration.
The collected data included: heart rate (614 work shifts; 4868 work hours), body core temperature (610 work shifts; 3949 work hours), mean skin temperature (729 work shifts; 5719 work hours), urine specific gravity (532 work shifts), and urine color (484 work shifts). Throughout the monitored work shifts, continuous meteorological data [air temperature (°C), relative humidity (%), wind speed (m/s), and solar radiation as expressed by globe temperature (°C)] were collected using portable weather stations (Kestrel 5400FW, Nielsen-Kellerman, Pennsylvania, USA) installed in close proximity to the workers. For the North American studies, air temperature and relative humidity were monitored with a portable weather station (Vantage Vue, Davis Instruments Corp, Hayward, CA) installed in close proximity to the workers. Then, we used published methods [Citation36] to obtain wind speed and globe temperature for each work shift based on the date, time, and location provided.
All data were calculated as hourly means to minimize the influence of instantaneous events (e.g., drinking cold water, dropping cold water on the body, eating, moving to a different environment for limited amount of time) according to previous literature [Citation8]. Thereafter, the meteorological data were used to compute the 61 TSIs found to be suitable for use in occupational settings using the “Thermal Stress Indicators calculator” developed in the first paper of this series [Citation6] that can be freely downloaded using the following link: www.famelab.gr/research/downloads.
Data analysis against meteorological parameters
Pearson’s correlation was utilized to explore potential relationships between the physiological heat strain (core temperature, mean skin temperature, and heart rate) and the magnitude of dehydration (differences in the urine specific gravity and color between pre- and post-work-shift urine samples) of the workers at the end of the work shift against the collected meteorological data (temperature, humidity, wind, and solar radiation). For this purpose, hourly and daily means were utilized to conduct the correlations analysis for the thermal strain variables and dehydration level, respectively. Moreover, stepwise linear regressions were performed to determine the influence of all four (temperature, humidity, wind, and solar radiation) meteorological factors on the physiological heat strain (mean body temperature, core body temperature, mean skin temperature, heart rate, urine specific gravity, and urine color) experienced by people who work in the heat.
Data analysis to rank the 61 TSIs
The list of the 61 TSIs found to be suitable for use in occupational settings in the first article of this three-paper series [Citation6] were combined with the results of Delphi exercise presented in the second article of the series [Citation7] which identified 17 criteria to be considered for adopting a TSI in occupational settings. A detailed description of the 17 Delphi criteria is shown in .
Table 2. The 17 Delphi criteria determined in the second article of this three-paper series [Citation7] used for the quantitative assessment of the 61 TSIs.
Correlation coefficient (r)
Pearson’s correlation coefficients (r) were utilized to investigate the relationships between each of the 61 TSIs and the physiological data [core temperature (Delphi criterion 1), mean skin temperature (Delphi criterion 2), mean body temperature (Delphi criterion 3), heart rate (Delphi criterion 4), and hydration level (computed as the average correlation of urine specific gravity and urine color; Delphi criterion 13)]. The magnitude of associations was determined as “very weak” (r = 0.00 to 0.19), “weak” (r = 0.20 to 0.39), “moderate” (r = 0.40 to 0.59), “strong” (r = 0.60 to 0.79), and “very strong” (0.80 to 1.00) [Citation37].
Receiver operating characteristics (ROC) curve
ROC curves were used to calculate the diagnostic performance of a binary classifier tool considering its sensitivity (see “2.3.c. Sensitivity” subsection) and specificity (see “2.3.d. Specificity” subsection) at various threshold settings. In the present study, ROC curves were utilized to investigate the ability for each of the 61 TSIs to diagnose increased (>36.7°C; Delphi criterion 5) or extreme (>39.0°C; Delphi criterion 14) mean body temperature using the Area Under the ROC curve. The Area Under the ROC curve ranges from zero to one and evaluated the capacity of each TSI to diagnose when workers have increased mean body temperature. A value of “0.5” corresponds to random chance, while a value of “0” or “1” corresponds to a perfect predictor. In this light, all values were converted to reflect their predictive capacity by adding 0.5 to the absolute difference between each value and 0.5. For example, the values of 0.4 and 0.6 are characterized by the same predictive capacity (ROC score = 0.6) despite being different. The equation used to calculate the ROC score can be found below:
Mean body temperature was used as a marker of excessive heat strain as it incorporates both core temperature and mean skin temperature. The threshold of 36.7°C mean body temperature [36.7°C > (38.0°C × 0.65) + (34.1°C × 0.35)] was calculated using: (1) Burton’s equation [Citation34] (mean body temperature = core temperature × 0.65 + mean skin temperature × 0.35), (2) the safety threshold of 38°C, which according to the World Health Organization [Citation38] “it is considered inadvisable for the deep body temperature to exceed 38°C for prolonged daily exposures in heavy work”, and (3) the standard value of 34.1°C mean skin temperature recommended in the ISO 7933 [Citation39] for occupational settings.
Sensitivity
Sensitivity (also called the true positive rate) for each of the 61 TSIs was defined as the capacity to identify the proportion of workers with increased (>36.7°C; Delphi criterion 6) or extreme (>39.0°C; Delphi criterion 15) mean body temperature, who are correctly identified as having increased or extreme mean body temperature, respectively. Sensitivity values for each TSI between the thermoneutral category (as defined by each TSI) and each category pertaining to heat stress were calculated. Our analysis did not consider categories pertaining to cold stress. The overall sensitivity score for each TSI was calculated as the average sensitivity of all heat stress categories used by each TSI, with sensitivity values demonstrating non-significant Cohen’s Kappa statistic being marked as “0”.
Specificity
Specificity (also called the true negative rate) for each of the 61 TSIs was defined as the capacity to identify the proportion of workers with normal (≤36.7°C; Delphi criterion 7) or non-extreme (≤39.0°C; Delphi criterion 16) mean body temperature who are correctly identified as not having increased or extreme mean body temperature, respectively. Specificity values for each TSI between the thermoneutral category (as defined by each TSI) and each category pertaining to heat stress were calculated. Our analysis did not consider categories pertaining to cold stress. The overall specificity score for each TSI was calculated as the average specificity of all heat stress categories used by each TSI, with specificity values demonstrating non-significant Cohen’s Kappa statistic being marked as “0”.
Risk ratio/relative risk
The capacity for each of the 61 TSIs to diagnose the increase in risk for having increased (>36.7°C; Delphi criterion 8) or extreme (>39.0°C; Delphi criterion 17) mean body temperature when being exposed to meteorological parameters characterized by different heat stress categories were calculated using Excel spreadsheets. Risk ratios between all the heat stress categories and the thermoneutral category were calculated. If the risk for having increased or extreme mean body temperature was more than 1 compared to the thermoneutral category, it was considered that the current heat stress category was characterized by a “perfect” risk assessment capacity and was given a score equal to 1 divided by the number of categories utilized by the current TSI. For a TSI to receive a “perfect” risk ratio score, it should be characterized by a “perfect” risk assessment capacity in each one of its heat stress categories. For instance, in a hypothetical case where one TSI uses four heat stress categories (low, moderate, high, and very high heat stress) and two of them were given a “perfect” risk assessment score of 1 while the other two were scored with 0, the overall risk ratio score of that TSI would be 0.5. It is important to note that risk ratios characterized by no statistically significant results were given a score of 0. The equation used to calculate the overall risk ratio score can be found below: n = number of heat stress categories used by the current TSI; cat1 = risk ratio between the first heat stress category and the thermoneutral one:
Categories
TSIs that provided categories indicating the level of heat stress (e.g., a WBGT value of 30°C indicates high heat stress) experienced by workers (Delphi criterion 9) scored 1 in this criterion. TSIs that did not provide heat stress categories scored 0 in this criterion.
Guidance
TSIs that provided health-related recommendations associated to the heat stress categories (Delphi criterion 10) scored 1 in this criterion. TSIs that did not provide health-related recommendations scored 0 in this criterion.
Cost-effectiveness
Cost effectiveness was calculated as the ratio of Cost and Effectiveness. Cost effectiveness analysis of the first year (Delphi criterion 11) of using a TSI incorporates all three cost-related parameters presented below, while cost effectiveness analysis for 10 years (Delphi criterion 12) of using a TSI incorporates the cost of buying the equipment only during year 1. Cost was calculated based on three parameters:
Cost of equipment: TSIs requiring more than one meteorological factor are more expensive to be computed. Based on an extensive internet search in relevant providers of scientific, commercial, and industrial equipment, the average cost for obtaining the equipment to assess the necessary meteorological parameters with acceptable accuracy [air temperature: ~0.5°C; relative humidity: ~6.0% (accuracy of partial vapor pressure should be ± 0.15 kPa in a measuring range between 0.5 kPa and 3.0 kPa); wind speed: ~(0.1 + 0.05 × wind speed) m/s; and solar radiation: ~5 W/m [Citation2,Citation40] was as follows: air temperature and relative humidity = 73.9 EUR; wind speed = 46.1 EUR; solar radiation = 144.8 EUR. For temperature and humidity, the average cost derived from obtaining prices for nine different handheld instruments ranging from 22.7 EUR to 172.9 EUR. Similarly, the average cost for a wind speed instrument was obtained as the average of 10 different handheld wind speed meters ranging from 7.7 EUR to 232.1 EUR. Finally, the average cost for assessing solar radiation resulted after collecting data for nine different handheld solar radiation meters ranging from 47.3 EUR to 295.8 EUR. Therefore, the cost of equipment to operate a TSI was calculated as the sum of the costs associated with the environmental parameters needed to compute this TSI.
Time required to measure each meteorological factor: A TSI that incorporates more meteorological factors is considered more expensive to measure. The global average wage (12.94 EUR/hour or 0.22 EUR/minute) in EUR was calculated based on data obtained from the Organization for Economic Co-Operation and Development (OECD) [Citation41] and the International Labor Organization [Citation42,Citation43] for the 58 largest economies worldwide. This calculation incorporates all OECD countries, as well as other countries, such as Bangladesh, Brazil, China, Egypt, India, Iran, Mexico, Pakistan, Russia, and Turkey. Thereafter, the cost of measuring each TSI on an hourly basis was calculated based on the amount of time required to be measured (we assumed two minutes for each meteorological factor). For instance, if a TSI incorporates only two meteorological parameters (0.86 EUR/hour) is considered cheaper to be measured compared to a TSI incorporating all four meteorological factors (1.73 EUR/hour).
Training cost for an occupational health and safety specialist: Here we assumed that 20 EUR/year are required for each meteorological parameter. For instance, if a TSI incorporates three meteorological factors, we estimated 60 EUR/year for the occupational safety and health specialist to be trained on using it.
Effectiveness was calculated as a utility value based on the criteria described in the Delphi exercise () [Citation7]. Specifically, criteria 1–10 and criterion 13 of the Delphi survey were used to compute a utility value describing the effectiveness of a TSI to protect individuals who work in the heat. Delphi criteria 14 to 17 were not considered, since no workers were identified to experience a mean body temperature higher than 39°C in our field experiments. Hence, the utility value describing the effectiveness of each TSI was calculated based on 11 Delphi criteria (1–10 and 13) and their accompanied weightings as derived from the Delphi survey (). The percentage points of importance were proportionally adjusted to account for the weightings of Delphi criteria 11, 12, and 14–17. Thereafter, the following equation (where i indicates a Delphi criterion) was used to calculate the effectiveness characterizing each TSI:
To extend the analysis on effectiveness, we calculated the quality-adjusted life years (QALY; indicating a year of perfect health in a worker’s life) [Citation44] gained by using the different heat indices to protect individuals who typically work in the heat. The calculation was based on a 40-hour work-week across the average 40.6 years working life across the world [Citation45] as follows:
Overall score
The overall score for each of the 61 TSIs was calculated using the weightings of the Delphi criteria 1 to 13 (). As mentioned above, Delphi criteria 14 to 17 were not used as no workers experienced a mean body temperature higher than 39°C in our field experiments. Therefore, the weightings were proportionally adjusted to account for excluding Delphi criteria 14 to 17. Thus, the following equation (where i indicates a Delphi criterion) was used to calculate the overall score characterizing each TSI:
Comparisons against the benchmark
Despite its simplicity, air temperature (i.e., dry bulb temperature) is the most well-known meteorological parameter that both scientists and civilians use in their daily routines to describe the surrounding ambient conditions. Therefore, all the analyses described above were also conducted to investigate the capacity of air temperature for quantifying the physiological heat strain experienced by people who work in hot environments.
Results
Data analysis against meteorological parameters
Work shifts performed in a broad spectrum of ambient conditions were included in the current study. Specifically, air temperature (31.7 ± 7.4°C) ranged from −16.4°C during a military hike in the Slovenian Alps to 43.8°C during a work shift in the construction sector of Qatar ( and Table S1). Relative humidity (45.8 ± 17.9%) ranged from 8.8% during a work shift in the construction sector of Qatar to 100% during a guard duty performed by military personnel in Slovenia (). Similarly, water vapor pressure (2.1 ± 0.7 kPa) ranged from 0.1 kPa during a work shift in the mining sector of Canada to 4.5 kPa during a work shift in the Australian mining sector. Wind speed (1.3 ± 2.1 m/s) ranged from 0 m/s during work in indoor environments to 30.5 m/s during a military hike in the Slovenian Alps (). Solar radiation (251.3 ± 292.8 W/m [Citation2]) ranged from 0 W/m [Citation2] during work in indoor environments to 1097 W/m [Citation2] during grape-picking at mid-day under a clear sky on the top of a mountain in Cyprus (). This wide range of environmental conditions allowed for a comprehensive testing of all TSIs since high clothing insulation and/or metabolic rate can lead to hyperthermia even in apparently cold conditions [Citation46]. Indeed, our military personnel demonstrated core temperature values as high as 38.8°C while hiking at sub-zero air temperatures. Another reason why we used a wide range of environmental conditions was to test the capacity of TSIs to identify true negatives (i.e., specificity), which is an important component of efficacy.
Figure 1. Associations between air temperature and other environmental factors: wind speed (green color), solar radiation (orange color), and relative humidity (blue color). Curved lines and shaded areas correspond to three-term polynomial regressions and their 95% confidence intervals, respectively.
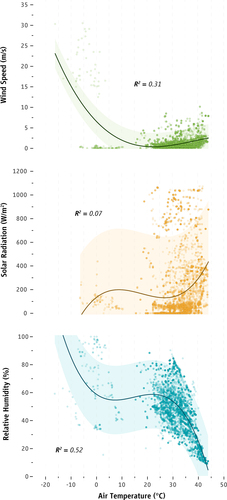
There were poor relationships between the core body temperature of the participants and the meteorological factors of air temperature and wind speed (). Mean body temperature was found to be moderately related with air temperature and poorly related with relative humidity and solar radiation (). Mean skin temperature was moderately related with air temperature and relative humidity, and was poorly related with wind speed and solar radiation (). There was a poor relationship between heart rate and all four meteorological factors (). Urine specific gravity was poorly related with air temperature, relative humidity, and solar radiation (). Similarly, urine color was poorly related with air temperature, relative humidity, and wind speed and did not correlate with solar radiation ().
Table 3. Relationships between occupational heat stress and physiological strain experienced by people who work in the heat.
Results from stepwise linear regressions are shown in . The meteorological parameters explained less than 10% of the variance in core temperature (F(3,2640) = 13.90, p < 0.001), dehydration magnitude assessed via urine specific gravity (F(1,422) = 9.65, p = 0.002), dehydration magnitude assessed via urine color (F(3,392) = 9.77, p < 0.001), and heart rate (F(4,3631) = 74.60, p < 0.001). On the other hand, the meteorological parameters explained significant amounts of variation in mean body temperature (F(2,2665) = 654.17, p < 0.001) and mean skin temperature (F(3,3768) = 933.81, p < 0.001).
Table 4. Percent of the variance in physiological heat strain explained by meteorological parameters in individuals who work in the heat. Hyphen (-) indicates no statistically significant predictor.
Data analysis to rank the 61 TSIs
More than half of TSIs (36/61) were significantly associated with the core temperature of the workers (p < 0.05), however the strength of that association was “very weak” [Citation37] (r: 0.083 ± 0.042; range: 0.032 to 0.216; Table S2). On the other hand, almost all TSIs were significantly (p < 0.05) related with the mean skin (60/61; r: 0.454 ± 0.137; range: 0.058 to 0.602) and mean body (59/61; r: 0.437 ± 0.118; range: 0.110 to 0.557) temperatures with “moderately strong” [Citation37] relationships (Table S2). The adoption of different methods for estimating mean skin temperature (i.e., three vs. four measuring sites, different sites) did not interfere with our findings, since the magnitude of the correlations between the tested TSIs and mean skin temperature was similar (d = 0.013) when using all data (r = 0.454 ± 0.137, ranging from 0.058 to 0.602) and when using only four skin measurement sites (r = 0.444 ± 0.146, ranging from 0.027 to 0.599). Similarly, the majority of TSIs (56/61) were significantly (p < 0.05) related with the workers’ heart rate, however the strength of the association was “very weak” [Citation37] (r = 0.107 ± 0.061; range: 0.031 to 0.388). Many of the TSIs were significantly (p < 0.05) associated with the magnitude of dehydration assessed via urine specific gravity (31/61; r: 0.114 ± 0.024; range: 0.087 to 0.171) and color (20/61; r = 0.149 ± 0.038; range: 0.101 to 0.208), however the strength of these associations was also “very weak” [Citation37] (Table S2).
More than half (36/61) of TSIs provide categories to characterize the level of heat stress experienced by workers (Table S2). In total, 80% (92/115) of these heat stress categories demonstrated statistically significant Cohen’s Kappa agreement (p < 0.05) with a high (>36.7°C) mean body temperature. These results indicate that higher heat stress-level categories indicate an increased mean body temperature. Further evaluation demonstrated, on average, moderate/acceptable Area Under the ROC curve (0.690 ± 0.061; range: 0.501 to 0.746) and sensitivity (0.615 ± 0.182; range: 0.342 to 0.998), but low/unacceptable specificity (0.415 ± 0.239; range: 0.034 to 0.859) for the categories provided by the TSIs.
Only three out of the 61 TSIs provide health-related guidance/recommendations for their categories of heat stress (Table S2). Of note, the identified health-related recommendations for the indoor and outdoor Wet-Bulb Globe Temperature were published by widely reputable organizations [Citation47,Citation48], while the identified health-related recommendations [Citation49] for the Universal Thermal Climate Index are not officially published by the organization that developed the thermal index.
The cost for hourly calculation for each of the 61 TSIs at a single workplace over the first year of operation ranged from 1,373.4 to 2,863.8 EUR (1,497.0 to 3,121.5 USD), with an average of 2,151.9 ± 665.8 EUR (2,345.6 ± 725.7 USD; Table S2). The cost of performing hourly measurements of different TSIs at a single workplace over a decade ranged from 13,068.8 to 26,254.7 EUR (14,245.0 to 28,617.6 USD) with an average of 19,982.6 ± 5,898.6 EUR (21,781.1 ± 6,429.5 USD).
The results for effectiveness demonstrated an average of 27.6 ± 14.8%, indicating a relatively low average capacity of TSIs for detecting physiological heat strain and protecting individuals who work in the heat. However, it is important to note that the effectiveness of TSIs ranged from 5.7 to 58.4%, suggesting that some TSIs were moderately effective. The same analysis indicated that, in a hypothetical scenario where all health-related recommendations and measures are followed, adopting a TSI to protect workers who typically work in the heat would lead to total gains of 0.6 to 5.6 quality-adjusted life years (depending on the TSI adopted) of uninterrupted work. Extrapolating this over the 40.6 years of average working life [Citation45] results in gains of 2.3 to 23.7 (11.2 ± 6.0) quality-adjusted life years, depending on the TSI adopted.
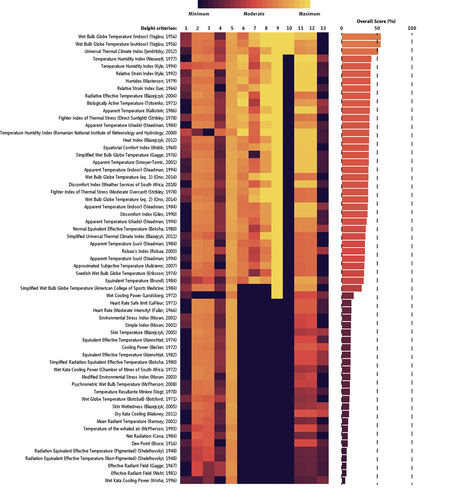
The overall score for each of the 61 TSIs against the Delphi criteria 1 to 13 and the associated weightings is illustrated in , with detailed scores presented in Table S2. Twenty-six of the 61 TSIs (42.6%) demonstrated overall scores below 25%, and 32/61 TSIs (52.5%) demonstrated scores between 25.1% and 50%. Finally, three TSIs (4.9%) scored above 50%, indicating that they satisfied (at least partly) the criteria to be considered for adopting a TSI to protect individuals who work in the heat. These TSIs were the indoor (WBGTIN; overall score: 55.4%) and outdoor (WBGTOUT; overall score: 55.1%) Wet-Bulb Globe Temperature, as well as the Universal Thermal Climate Index (UTCI; overall score: 51.7%).
Figure 2. Overall score of the 61 TSIs. Black (minimum) and yellow (maximum) colors indicate the score of each TSI across the different Delphi criteria listed in . Detailed scores and full references are provided in Table S2 in the supplementary material.
Comparisons of the TSIs against the benchmark
Air temperature, which is considered the benchmark in occupational heat exposure, demonstrated very weak associations with core temperature (r = −0.034, p < 0.05), heart rate (r = −0.137, p < 0.05) and the magnitude of dehydration (r = 0.153, p < 0.05), as well as moderate associations with mean skin temperature (r = 0.574, p < 0.05) and mean body temperature (r = 0.527, p < 0.05). The association of air temperature was higher than 42.6% of the TSIs for core temperature, 82.0% of the TSIs for mean body temperature, 85.2% of the TSIs for heart rate, 93.4% of the TSIs for mean skin temperature, and 95.1% of the TSIs for the magnitude of dehydration. Similarly, air temperature had a greater Area Under the ROC curve (AUC = 0.740) than 88.5% (54/61) of TSIs (criterion #5). On the other hand, air temperature scored 0 in the Delphi criteria 6 to 10 since no published categories or guidance are available. Air temperature was found to be more cost-effective than 68.9% and 72.1% of TSIs during the first year of operation and over a decade, respectively. The cost for hourly calculation of air temperature at a single workplace over the first year of operation was 723.6 EUR (788.8 USD), while the cost of performing hourly measurements of air temperature over a decade escalates to 6571.4 EUR (7162.8 USD), indicating that measuring air temperature alone is considerably cheaper compared to the average cost required for measuring a TSI. In summary, the overall score of air temperature was 15.5%, therefore higher than 41.0% (25/61) of the occupational meteo-based TSIs.
Discussion
Of the 61 occupational meteo-based TSIs evaluated in this study, we found that the Wet-Bulb Globe Temperature and the Universal Thermal Climate Index score best when ranked against the criteria determined by our previous Delphi exercise [Citation7]. Therefore, these TSIs have the highest potential to reflect the physiological strain experienced by workers and should therefore be adopted in occupational settings. Adoption of these TSIs will also facilitate cross-sector and -country comparisons allowing for further improvements in workers’ health and safety recommendations.
The total score of the analyzed TSIs ranged from 4.7 to 55.4% with an average of 26.5 ± 14.5%. Three TSIs scored relatively higher in the Delphi criteria, namely the indoor and outdoor Wet-Bulb Globe Temperature and the Universal Thermal Climate Index. The difference between these three TSIs and the remaining 58 was primarily due to the fact that they have published health-related recommendations – a Delphi criterion that was deemed as the most important by experts (some of whom are authors of this article) for adopting a TSI to protect individuals who work in the heat. Overall, the standard deviation of the weightings across all Delphi criteria was 5.1 ± 1.8%, with a range from 3.0% to 9.5% [Citation7]. It is logical to suspect that fluctuations on the weighting assigned to the Delphi criterion related to health-related recommendations may have affected the ranking of the TSIs. However, even if this Delphi criterion was given, for instance, a 10% weighting by experts (making it the 3rd criterion of importance), the indoor and outdoor Wet-Bulb Globe Temperature and the Universal Thermal Climate Index would still rank at #1, #2, and #4, respectively. Even if equal weightings were given to all Delphi criteria, the indoor and outdoor Wet-Bulb Globe Temperature and the Universal Thermal Climate Index would rank among the best TSIs at #2, #3, and #10, respectively. This is in line with previous studies that have shown the increased capacity of these TSIs in assessing parameters of physiological heat strain and in predicting productivity losses in different environments [Citation1,Citation9,Citation15,Citation20,Citation50]. Moreover, these notions are further supported by the fact that the Wet-Bulb Globe Temperature (cited/used in 8970 articles) and the Universal Thermal Climate Index (cited/used in 2920 articles) are two widely-accepted and -adopted TSIs (Google Scholar metrics on 19 January 2022; Fig. S1). A Google Scholar search for “Wet Bulb Globe Temperature” in the article title resulted in 547 published papers from 36 countries, while a similar search for the more recent “Universal Thermal Climate Index” resulted in 134 articles published from 25 countries (country of first author was considered; Fig. S2). Therefore, by adopting these TSIs, future studies will allow for direct comparison with previously published data across many countries.
Nearly all the tested TSIs showed statistically significant correlations with the mean skin temperature (98%), the mean body temperature (97%), and the heart rate (92%) of the workers, while 59% of them were correlated with core body temperature. The reduced correlations observed between the tested TSIs and workers’ core body temperature may be due to the fact that the latter is mostly related with work intensity [Citation15], a parameter that was intentionally left uncontrolled in the present study. Almost half of the TSIs were associated with hydration status (urine specific gravity and/or urine color), and more than half provide categories to characterize the level of heat stress experienced by workers. On the other hand, only the indoor and outdoor Wet-Bulb Globe Temperature [Citation23,Citation51–53], as well as the Universal Thermal Climate Index [Citation54] have been included in health-and-safety recommendations. The annual cost of using a TSI on a daily basis ranges from 1,373 to 2,864 EUR, reaching 13,068.8 to 26,254.7 EUR over a decade. Air temperature alone was cheaper to measure than any other TSI and had a stronger association with mean skin temperature, mean body temperature, heart rate, and hydration status than 82% of the studied TSIs. However, these associations were higher for the indoor and outdoor Wet-Bulb Globe Temperatures, as well as the Universal Thermal Climate Index. Also, there are no official occupational recommendations for air temperature, probably because of its limited relevance for workplaces with high humidity and/or radiant heat (e.g., blast furnaces and dry cleaning). In contrast, indoor and outdoor Wet-Bulb Globe Temperatures, as well as the Universal Thermal Climate Index have been widely accepted and adopted across all occupational environments, and they have been included in health-and-safety recommendations [Citation6].
Technological advancements are continuously reducing the costs associated with heat stress monitoring. In many cases, companies have installed sensors that wirelessly transmit data which are logged and relayed in real-time to company supervisors and health-and-safety experts. While such monitoring may be more expensive to implement, it does not require person-hours each week and may render the above estimates as exaggerated. Regardless, implementing heat stress monitoring can be challenging for many industries (e.g., across large and/or remote agricultural fields). Also, these systems may be less affordable in low-income countries, as they require significant technological infrastructure to support their use. Although these costs may seem high for small enterprises, they are quite reasonable since the tested TSIs can increase the workers’ healthy life by 11.2 years on average if implemented at a workplace characterized by elevated heat stress. This is especially important if we consider that the risk for life-threatening diseases [Citation1] and fatal accidents [Citation55] is exponentially increased when people work in adverse ambient conditions. The ongoing global warming is projected to cause about one fatality from occupational heat stress every 14 to 24 minutes during the years 2020 to 2030 [Citation56]. This may be only the tip of the iceberg, since the economic burden related to heat-induced decrease in labor productivity [Citation1,Citation9,Citation14,Citation15,Citation20,Citation57] may exacerbate the problem [Citation58]. It is therefore imperative that urgent measures should be taken to protect the billions of people who are currently exposed to adverse climatic conditions, as well as the even larger number of people who will be affected in the near future [Citation59]. Some of the countries in southern Europe have already implemented regulations [Citation52] or they are currently developing relevant legislation that includes the adoption of TSIs to safeguard their workforce in the face of rising global temperature associated with climate change. Similarly, the International Labor Organization is supporting the enactment of legislation in countries situated in the Gulf region [Citation23,Citation53]. These legislations are either fully or partly based on TSIs, and as such they are an important component of heat-health risk assessment. The adoption of TSIs as a proactive method to protect people working under heat stress is encouraged by reputable organizations and it is further supported by the results of the present study.
We investigated the capacity of occupational meteo-based TSIs to quantify the physiological heat strain experienced by hundreds of workers across multiple industries in nine countries. While such a large-scale analysis provides many advantages in terms of ecological validity and statistical power, we acknowledge that certain considerations should be taken into account. Our study shows that the best TSIs address only 55% of the criteria determined by our Delphi exercise and that the correlations between TSIs and physiological heat strain parameters are low or modest. Previous studies evaluating whether TSIs reflect the physiological heat strain experienced by working people have reported higher correlations [Citation9,Citation14–16,Citation18–21]. These studies were either well-controlled laboratory experiments [Citation14,Citation20,Citation21] or small-scale field studies evaluating a group of workers at a single work site, wearing similar clothing, and performing similar jobs [Citation9,Citation15,Citation16,Citation18,Citation19]. Therefore, it is likely that the 45% of the Delphi criteria that has not been addressed by even the best TSIs in our study is explained by differences that modify the heat strain response and the associated health outcomes. These are (1) altered work characteristics (work intensity, clothing, work schedule, in- versus out-door work, etc.) between industries as well as between countries within the same industry [Citation1,Citation15], (2) varying technological advancements and regulations between countries [Citation1,Citation15,Citation60], (3) different inter- and intra-individual factors of the workers [Citation60–62], and (4) availability of heat mitigation strategies (hydration regimes, provision of electric fans, air conditioning, work-rest cycles, etc.) [Citation15,Citation63]. To maintain the ecological validity of our study, we opted not to split our workers into similar groups (e.g., based on metabolic rate and/or clothing). Despite the seemingly low performance of even the best TSIs against the Delphi criteria, it is remarkable that some TSIs based only on four pieces of meteorological information (temperature, humidity, wind, and solar radiation) effectively satisfied these strict criteria in a series of field studies across multiple industries and countries.
In the last few years, our workplaces have been rapidly evolving through new digital technologies including artificial intelligence, widespread connectivity, the internet of things, big data applications, wearables, mobile devices, and online platforms [Citation64]. These advancements allow the collection of workers’ data combined with the use of big data and algorithms for decision-making, changing the nature and location of work, who works and when, as well as how work is organized and managed. While monitoring workers is probably as old as work is, digitalization allows for new, continuous, and lower-cost forms of worker monitoring and management, through mobile devices, wearable or embedded sensory or other monitoring devices from various sources both in and outside the workplace.
The findings from this series of three companion papers demonstrate that work-related applications and systems should employ the indoor and outdoor Wet-Bulb Globe Temperatures, or the Universal Thermal Climate Index to inform management and make evidence-based decisions. This can lead to a rationalized organization of work and production as well as improved worker health and safety, where the real-time workers’ data collected are used to provide automated feedback to workers on their health and positively influence their behaviors. For example, in construction and agriculture, automated scheduling software can use historical and real-time data on weather and seasonal patterns for scheduling tasks and employees based on the indoor and outdoor Wet-Bulb Globe Temperatures, or the Universal Thermal Climate Index. This will allow employers to adjust schedules and to allocate shifts in response to the present and future conditions in the workplace. Also, analytics could identify associations between workplace practice and safety and health risk, reducing worker exposures to heat stress and producing individually tailored prevention or job resources to manage heat stress. Such practices can be effectively applied to traditional forms of work that require physical presence as well as to a dispersed workforce, such as teleworkers, or moving workers including drivers and couriers.
The data presented in this series of studies demonstrate that the indoor and outdoor Wet-Bulb Globe Temperature [Citation51], as well as the Universal Thermal Climate Index [Citation54] can support the development of effective occupational heat mitigation strategies in different countries and industries, particularly considering their relevance for big-data analytics used in climate services for the occupational and the general populations. However, it should be noted that our assessments involved monitoring people working in developed countries, and thus our results do not necessarily reflect the practices and conditions under which workers perform their jobs in other countries. Also, we did not examine the capacity of TSIs to quantify the physiological heat strain experienced by workers wearing heavily protective clothing that reduces heat dissipation, such as firefighters.
In conclusion, based on knowledge gained in the previous parts of this series of companion papers, where all occupational meteo-based TSIs were identified [Citation6] and the 17 criteria to consider when adopting a TSI were determined [Citation7], the present evaluation of 61 occupational meteo-based TSIs in a series of field studies performed in multiple industries across nine countries showed that the Wet-Bulb Globe Temperature and the Universal Thermal Climate Index have the highest potential to quantify the physiological strain experienced by individuals working in the heat. Adoption of these TSIs will facilitate more effective cross-sector and -country comparisons promoting and standardizing improvements in occupational health and safety.
Author contributions
Conceptualization: LGI, ADF, LN, GH, GPK; Data curation: LGI, ADF; Formal Analysis: LGI, ADF; Funding acquisition: ADF, LN; Investigation: LGI, KM, LT, MV, EN, JFP, SRN, PCD, GAG, MB, IBM, GPK, LN, ADF; Methodology: LGI, GH, GPK, LN, ADF; Project administration: LGI, ADF; Software: LGI, KM, ADF; Supervision: ADF; Validation: ADF; Visualization: LGI, ADF; Writing – original draft: LGI, ADF; Writing – review & editing: LGI, KM, LT, MV, EN, JFP, SRN, PCD, GAG, MB, GH, IBM, GPK, LN, ADF.
Supplemental Material
Download PDF (529.2 KB)Disclosure statement
No potential conflict of interest was reported by the authors.
Supplemental material
Supplemental data for this article can be accessed here.
Additional information
Funding
References
- Flouris AD, Dinas PC, and Ioannou LG, et al. Workers’ health and productivity under occupational heat strain: a systematic review and meta-analysis. Lancet Planet Health. 2018;2(12):e521–e531. doi:10.1016/s2542-5196(18)30237-7.
- Casanueva A, Burgstall A, and Kotlarski S, et al. Overview of existing heat-health warning systems in Europe. Int J Environ Res Public Health. 2019;16(15):2657. doi:10.3390/ijerph16152657.
- Morabito M, Messeri A, and Noti P, et al. An occupational heat-health warning system for Europe: the HEAT-SHIELD platform. Int J Environ Res Public Health. 2019;16(16):2890. doi:10.3390/ijerph16152657.
- Morris NB, Piil JF, and Morabito M, et al. The HEAT-SHIELD project - Perspectives from an inter-sectoral approach to occupational heat stress. J Sci Med Sport. 2021; 24(8):747–755. doi:10.1016/j.jsams.2021.03.001.
- Ioannou LG, Foster J, and Morris NB, et al. Occupational heat strain in outdoor workers: A comprehensive review and meta-analysis. Temperature. 2022 (in press). doi:10.1080/23328940.2022.2030634.
- Ioannou LG, Mantzios K, and Tsoutsoubi L, et al. Indicators to assess physiological heat strain – Part 1: Systematic review. Temperature. 2022 (in press). doi:10.1080/23328940.2022.2037376.
- Ioannou LG, Dinas PC, Notley SR, et al. Indicators to assess physiological heat strain – Part 2: Delphi exercise. Temperature. 2022 (in press). doi:10.1080/23328940.2022.2044738.
- Ioannou LG, Tsoutsoubi L, and Mantzios K, et al. A free software to predict heat strain according to the ISO 7933: 2018. Ind Health. 2019;57(6):711–720. doi:10.2486/indhealth.2018-0216.
- Ioannou LG, Tsoutsoubi L, and Samoutis G, et al. Time-motion analysis as a novel approach for evaluating the impact of environmental heat exposure on labor loss in agriculture workers. Temperature. 2017;4(3):330–340. doi:10.2486/indhealth.2018-0216.
- Miller VS, and Bates GP. The thermal work limit is a simple reliable heat index for the protection of workers in thermally stressful environments. Ann Occup Hyg. 2007;51(6):553–561. doi:10.2486/indhealth.2018-0216.
- Vatani J, Golbabaei F, and Dehghan SF, et al. Applicability of Universal Thermal Climate Index (UTCI) in occupational heat stress assessment: a case study in brick industries. Ind Health. 2016;54(1):14–19. doi:10.2486/indhealth.2015-0069.
- Nassiri P, Monazzam MR, and Golbabaei F, et al. Application of Universal Thermal Climate Index (UTCI) for assessment of occupational heat stress in open-pit mines. Ind Health. 2017;55(5):437–443. doi:10.2486/indhealth.2015-0069.
- Hajizadeh R, Golbabaei F, and Farhang Dehghan S, et al. Validating the heat stress indices for using in heavy work activities in hot and dry climates. J Res Health Sci. 2016;16(2):90–95. Spring.
- Ioannou LG, Mantzios K, and Tsoutsoubi L, et al. Effect of a simulated heat wave on physiological strain and labour productivity. Int J Environ Res Public Health. 2021;18(6):3011. doi:10.2486/indhealth.2015-0069.
- Ioannou LG, Mantzios K, and Tsoutsoubi L, et al. Occupational heat stress: multi-country observations and interventions. Int J Environ Res Public Health. 2021;18(12):6303. doi:10.3390/ijerph18126303.
- Meade RD, D’Souza AW, and Krishen L, et al. The physiological strain incurred during electrical utilities work over consecutive work shifts in hot environments: a case report. J Occup Environ Hyg. Dec 2017;14(12):986–994. doi:10.1080/15459624.2017.1365151.
- Ioannou LG, Tsoutsoubi L, and Mantzios K, et al. The impacts of sun exposure on worker physiology and cognition: multi-country evidence and interventions. Int J Environ Res Public Health. 2021;18(14):7698. doi:10.3390/ijerph18147698.
- Meade RD, Lauzon M, and Poirier MP, et al. An evaluation of the physiological strain experienced by electrical utility workers in North America. J Occup Environ Hyg. 2015;12(10):708–720. doi:10.1080/15459624.2015.1043054.
- Meade RD, Lauzon M, and Poirier MP, et al. The physical demands of electrical utilities work in North America. J Occup Environ Hyg. 2016;13(1):60–70. doi:10.1080/15459624.2015.1077966.
- Foster J, Smallcombe JW, and Hodder S, et al. An advanced empirical model for quantifying the impact of heat and climate change on human physical work capacity. Int J Biometeorol. 2021;65(7):1215–1229. doi:10.1007/s00484-021-02105-0.
- Foster J, Smallcombe JW, and Hodder SG, et al. Aerobic fitness as a parameter of importance for labour loss in the heat. J Sci Med Sport. 2021;24(8):824–830. doi:10.1016/j.jsams.2021.05.002.
- Sweigert RI, and Schabacker WH. The delphi technique: how well does it work in setting educational goals?. Atlanta, Georgia, USA: US Department of Health Education & Welfare National Institute of Education. TM 003627; ED 09415. 19. 1974.
- Flouris AD, Ioannou LG, and Dinas PC, et al. Assessment of occupational heat strain and mitigation strategies in Qatar. International Labour Organization, Doha, Qatar. 2019.
- Morris NB, Levi M, and Morabito M, et al. Health vs. wealth: Employer, employee and policy-maker perspectives on occupational heat stress across multiple European industries. Temperature. 2020;1–18. doi:10.1080/23328940.2020.1852049.
- Casanueva A, Kotlarski S, and Fischer AM, et al. Escalating environmental summer heat exposure—a future threat for the European workforce. Reg Environ Change. 2020;20(2):40. doi:10.1007/s10113-020-01625-6.
- Kenny GP, Wilson TE, and Flouris AD, et al. Heat exhaustion. Handb Clin Neurol. 2018;157:505–529. doi:10.1016/b978-0-444-64074-1.00031-8.
- Epstein Y, Yanovich R, and Longo DL. Heatstroke. N Engl J Med. Jun 20 2019;380(25):2449–2459. doi:10.1056/NEJMra1810762.
- Flouris AD, Babar Z, and Ioannou LG, et al. Improving the evidence on health inequities in migrant construction workers preparing for big sporting events. BMJ. 2021;374:n1615. doi:10.1136/bmj.n1615.
- Orlov A, Sillmann J, and Aunan K, et al. Economic costs of heat-induced reductions in worker productivity due to global warming. Glob Environ Change. 2020;63:102087. doi:10.1016/j.gloenvcha.2020.102087.
- Maloney SK, and Forbes CF. What effect will a few degrees of climate change have on human heat balance? Implications for human activity. Int J Biometeorol. 2011;55(2):147–160. doi:10.1007/s00484-010-0320-6.
- Morabito M, Pavlinic DZ, and Crisci A, et al. Determining optimal clothing ensembles based on weather forecasts, with particular reference to outdoor winter military activities. Int J Biometeorol. 2011;55(4):481–490. doi:10.1007/s00484-010-0357-6.
- Notley SR, Meade RD, and Kenny GP. Time following ingestion does not influence the validity of telemetry pill measurements of core temperature during exercise-heat stress: The Journal Temperature toolbox. Temperature. 2021;8(1):12–20. doi:10.1080/23328940.2020.1801119.
- Ramanathan NL. A new weighting system for mean surface temperature of the human body. J Appl Physiol. 1964;19(3):531–533.
- Burton AC. Human calorimetry: II. The average temperature of the tissues of the body: three figures. J Nutr. 1935;9(3):261–280.
- Armstrong LE, Maresh CM, Castellani JW, et al. Urinary indices of hydration status. Int J Sport Nutr Exerc Metab. 1994;4(3):265–279.
- Misailidi M, Mantzios K, and Papakonstantinou C, et al. Environmental and psychophysical heat stress in adolescent tennis athletes. Int J Sports Physiol Perform. 2021; 1–6. doi:10.1123/ijspp.2020-0820.
- Swinscow TDV Correlation and regression. Statistics at Square One Ninth Edition, revised by M J Campbell. BMJ Publ. Group; 1997.
- World Health Organization. Health factors involved in working under conditions of heat stress: report of a WHO scientific group. HM Stationery Office; 1969.
- International Organisation for Standardardization. ISO 7933: ergonomics of the thermal environment - Analytical determination and interpretation of heat stress using calculation of the predicted heat strain. Geneva, Switzerland: International Organisation for Standardardization; 2004.
- International Organization for Standardization. ISO 7726: ergonomics of the thermal environment - Instruments for measuring physical quantities. 2 ed. Geneva, Switzerland: International Organization for Standardization; 1998.
- OECD.Stat. PPPs and exchange rates. Available from Apr 1st, 2019. https://stats.oecd.org/Index.aspx?DataSetCode=SNA_TABLE4
- Internatioanl Labour Organization. Global wage report 2018/19: what lies behind gender pay gaps. International Labour Organization; 2018.
- International Labour Organization. Wages, productivity and labour share in China. Bangkok, Thailand: ILO Regional Office for Asia and the Pacific: Regional Economic and Social Analysis Unit (RESA). 2016.
- Torrance GW, Feeny D. Utilities and quality-adjusted life years. Int J Technol Assess Health Care. 1989;5(4):559–575.
- World Bank. The cost of air pollution: strengthening the economic case for action. 2016. http://documents.worldbank.org/curated/en/781521473177013155/The-cost-of-air-pollution-strengthening-the-economic-case-for-action
- Rintamäki H, and Rissanen S. Heat strain in cold. Ind Health. 2006;44(3):427–432. doi:10.2486/indhealth.44.427.
- ACGIH. TLVs and BEIs, threshold limit values for chemical substances and physical agents and biological exposure indices. Cincinnati: Signature Publications; 2012.
- International Organization for Standardization. ISO 7243: hot environments-estimation of the heat stress on working man, based on the WBGT index (wet bulb globe temperature). Geneva, Switzerland: International Organization for Standardization; 1989.
- Błażejczyk K, Bröde P, Fiala D, et al. UTCI–new index for assessment of heat stress in man. Przegląd Geograficzny. 2010;82(1):49
- Smallcombe JW, Foster J, and Hodder S, et al. Impact of fan use on physical work capacity in extreme heat: 99 may 29 10:45 AM - 11:00 AM. Med Sci Sports Exercise. 2019;51(6S):15. doi:10.1249/01.mss.0000560531.57940.a8.
- Yaglou CP, and Minard D. Prevention of heat casualties at marine corps training centers, Ohio, USA. 1956.
- Ministry of Labor Welfare and Social Insurance: Department of Labor Inspection. Occupational heat strain. Vol. 4789:291. Cyprus: Official Gazette of the Republic of Cyprus; 2014.
- Qatar Ministry of Administrative Development Labour and Social Affairs. Specifying measures to protect workers from heat stress: no. (17) for the year 2021. Qatar Ministry of Administrative Development Labour and Social Affairs; 2020.
- Jendritzky G, de Dear R, Havenith G. UTCI—why another thermal index? Int J Biometeorol. 2012;56(3):421–428.
- Anderson BG, and Bell ML. Weather-related mortality: how heat, cold, and heat waves affect mortality in the United States. Epidemiology. 2009;20(2):205–213. doi:10.1097/EDE.0b013e318190ee08.
- Kjellstrom T, Lemke B, and Otto M, et al. Occupational heat stress: contribution to WHO project on “Global assessment of the health impacts of climate change”, which started in 2009. Mapua: Health and Environment International Trust. 2014.
- Zander KK, Botzen WJW, and Oppermann E, et al. Heat stress causes substantial labour productivity loss in Australia. Nat Clim Chang. 2015;5(7):647–651. doi:10.1038/nclimate2623.
- Gunnell D, Platt S, and Hawton K. The economic crisis and suicide. BMJ. 2009;338(may15 1):b1891. doi:10.1136/bmj.b1891.
- International Labour Organization. Working on a warmer planet: the impact of heat stress on labour productivity and decent work. Geneva: Publications Production Unit, International Labour Organization; 2019.
- Notley SR, Flouris AD, and Kenny GP. On the use of wearable physiological monitors to assess heat strain during occupational heat stress. Appl Physiol Nutr Metab. 2018;43(9):869–881. doi:10.1139/apnm-2018-0173.
- Flouris AD, McGinn R, and Poirier MP, et al. Screening criteria for increased susceptibility to heat stress during work or leisure in hot environments in healthy individuals aged 31–70 years. Temperature. 2018;5(1):86–99. doi:10.1080/23328940.2017.1381800.
- Ioannou LG, Gkikas G, Mantzios K, et al. Chapter 32 - Risk assessment for heat stress during work and leisure. In: Tsatsakis AM, editor. Toxicological risk assessment and multi-system health impacts from exposure. Amsterdam, The Netherlands: Academic Press; 2021. p. 373–385. doi: 10.1016/B978-0-323-85215-9.00004-0
- Morris NB, Jay O, and Flouris AD, et al. Sustainable solutions to mitigate occupational heat strain - an umbrella review of physiological effects and global health perspectives. Environ Health. 2020;19(1):95. doi:10.1186/s12940-020-00641-7.
- Moore PV OSH and the future of work. Benefits and risks of artificial intelligence tools in workplaces. European Agency for Safety and Health at Work; 2019. Available from 2020 Oct 24.https://osha.europa.eu/sites/default/files/publications/documents/OSH_future_of_work_artificial_intelligence_0.pdf