
 ?Mathematical formulae have been encoded as MathML and are displayed in this HTML version using MathJax in order to improve their display. Uncheck the box to turn MathJax off. This feature requires Javascript. Click on a formula to zoom.
ABSTRACT
The aim of this study is to investigate these enzymes as possible biomarkers in two colorectal cancer cell lines: HT29, SW480, SW620, and Colo205. With 1,168,929 individuals currently diagnosed with colorectal cancer in the United States, there remains a need to find biomarkers to improve diagnosis and expand treatment options for patients. Due to their role in proliferation and cell cycle regulation, we hypothesized an increase in salvage pathway enzyme (APRT, DCK, and HPRT) expression and possible presentation within colon cancer cells. Enzyme surface localization was assessed utilizing confocal microscopy, flow cytometry, and scanning electron microscopy. General protein expression was evaluated utilizing immunohistochemistry and Western blot analysis. While we found no statistically significant presence of either APRT or DCK on the membranes of SW620, Colo205, and HT29 cells, but found significant expression of HPRT on the surface of HT29, SW480, and SW620 cells. The average population fluorescence increased by 28%, 58%, and 40% in HT29, SW620, and SW480 cells, respectively, when compared to isotype controls. Confocal microscopy images revealed direct overlap between SW620 cells stained with a membrane dye and anti-HPRT antibody, indicating co-localization on the plasma membrane. In addition, cells treated with gold labelled HPRT antibody experienced significant changes in gold weight percentage on both SW620 and HT29 cells when compared to isotype controls. When evaluating expression within normal tissue, there was insignificant levels of HPRT binding. These data collectively suggest that HPRT may be a possible biomarker target for the identification and treatment of colorectal cancer.
Introduction
Colorectal Cancer (CRC) is one of the leading causes of death in the United States. Every year 49,700 individuals die as a result of CRC while an estimated 1,168,929 are currently diagnosed with the diseas.Citation1 CRC is one of the most common cancers in the western world as 1 in 21 men and 1 in 23 women are predicted to develop the diseas.Citation2–Citation4
In order to combat disease progression, a variety of markers have been identified that act as useful tools for predicting tumour aggressiveness, mucin content, and aneuploidy in cancer DN.Citation5-Citation7These markers are valuable when determining treatment options for individuals with a unique blend of cancer characteristics. Recent research using cultured cancer cells have identified cancer biomarkers such as the 1,25-Dihydroxyvitamin D3 receptor that may act as a marker for colon carcinoma cell differentiation and growth. Receptors such as Vitamin D receptor are upregulated on colon cancer cell surfaces and can serve as a target for tumour reduction and elimination. Additionally, markers such as CD133 and CD44 have also been identified for the elimination of cancer stem cell.Citation2,Citation8 While a number of tumor antigens have been identified, additional markers will aid in better understanding colorectal cancer disease progression and could lead to additional treatment options.
In the search to further characterize colorectal cancer cells, we decided to evaluate the salvage pathway enzymes Hypoxanthine Guanine Phosphoribosyltransferase (HPRT), Adenine Phosphoribosyltransferase (APRT) and Deoxycytidine Kinase (DCK) as a possible upregulated target. Salvage pathway enzymes act as recycling agents, reusing the components of old nucleotides to skip energetically expensive steps in the formation of nucleotide base.Citation9 The salvage pathway is the chosen method of nucleotide synthesis for a majority of the cell cycle in humans as 90% of free purines are recycle.Citation10 Responsible for the salvage of adenine in the cell cycle, APRT is found constitutively expressed in a majority of mammalian cell.Citation11 DCK is primarily involved in the phosphorylation of deoxycytidine in the production of cytosin.Citation12 HPRT functions by transferring phosphoribose from phosphoribosyl pyrophosphate (PRPP) to hypoxanthine or guanine bases in the purine biosynthesis of inosine and guanin.Citation10,Citation13
A deficiency of HPRT results in a spectrum of diseases that directly correspond with the availability of the protein. Individuals with a complete lack of functional HPRT will develop Lesh-Nyhan syndrome, while individuals with a partial deficiency will develop gout-like symptoms characteristic of Kelley-Seegmiller syndrom.Citation14–Citation16 Because the gene is located on the X chromosome, it is an X-linked recessive condition that predominantly affects males of diseased families. Evaluation of the hprt gene has become a common biomarker for mutational assessment, and over 500 mutations in the gene have been describe.Citation17
Having functional salvage pathway enzymes is important in the survival and functionality of mammalian cells. Salvage enzymes, such as HPRT, are known as common housekeeping genes, and are integral in several daily cellular functions regulating cell proliferation and cell cycle progressio.Citation10,Citation18 We evaluated these enzymes because of their intimate role in the production of nucleotides necessary to maintain rapid cell proliferation. Additionally, these enzymes maintain responsibility for synthesizing GTP and ATP which provide the critical energy source for several cellular processes that are found upregulated within malignant cell.Citation19–Citation21
The aim of this study was to evaluate HPRT, APRT, and DCK as potential biomarkers for CRC. We assessed the expression of the proteins on the surface of four CRC cell lines in addition to evaluation within tumor tissue and normal tissue to determine the clinical relevance of the protein expression. Results from these experiments could provide an additional marker for the characterization of colorectal cancer.
Results
Flow cytometry reveals an overall increase in fluorescence when colon cancer cell lines were exposed to HPRT antibody, but not when treated with DCK or APRT antibodies
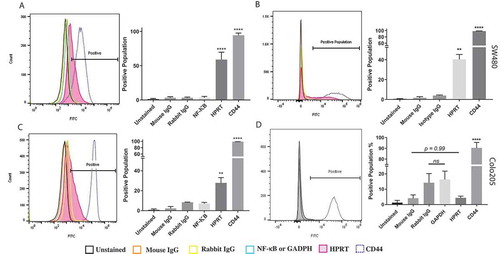
Flow cytometry revealed no significant presence of APRT (p-value = 0.93) or DCK (p-value = .243) on the surface of SW620 cells (). There was also no statistically significant presence of both enzymes (APRT, p-value = 0.39; DCK, p-value = 0.57) on the surface of HT29 cells or Colo205 cells (APRT, p-value = 0.75; DCK, p-value = 0.96). We did find that SW480, SW620, and HT29 cells had statistically significant HPRT expression on the surface of the cells. The average fluorescence of the cell population increased by 27.73% in HT29 (p-value = 0.013), 39.6% in SW480 (p-value = 0.0095), and 58.85% in SW620 cells (p-value = 0.0079) when compared to isotype controls (). This indicates a strong presence of HPRT on the surface of the cells. shows insignificant isotypic binding, lower than 3% average of the total population (p-value = 0.374) in SW620 cells, 7% (p-value = 0.11) in HT29 cells, and 3.94% (p-value = 0.058) in SW480 cells. While these cell lines showed positive HPRT surface localization, Colo205 cells showed no significant increase in the surface presence of HPRT (p-value = 099). All cells were gated to exclude dead cells and cell doublet populations.
Figure 1. Analysis of APRT and DCK expression on SW620 and HT29 colon cancer cells. A, Cells treated with APRT antibodies experienced no shift in the fluorescent population and had similar fluorescent signatures to isotype controls. B, Cells treated with DCK antibodies experienced an insignificant change in the population when compared to isotype controls, indicating no surface presence. Statistical analysis of APRT and DCK binding reveal insignificant levels of either protein on the surface of SW620 cells. APRT antibodies were mouse and were compared against mouse isotype controls, and DCK antibodies were rabbit and were compared against rabbit isotype controls for statistical analysis. Insignificant shifts in the fluorescent intensity of the cells was observed when treated with both B, APRT and DCK antibodies. Statistical analysis of APRT and DCK binding in HT29 cells showed insignificant levels of the proteins on the surface. C, Insignificant surface binding was also observed in Colo205 cells as well with no shifts in the fluorescent population upon treatment with either APRT or DCK antibodies.
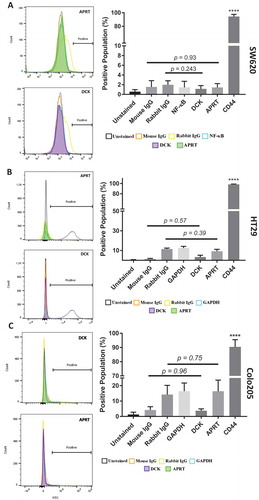
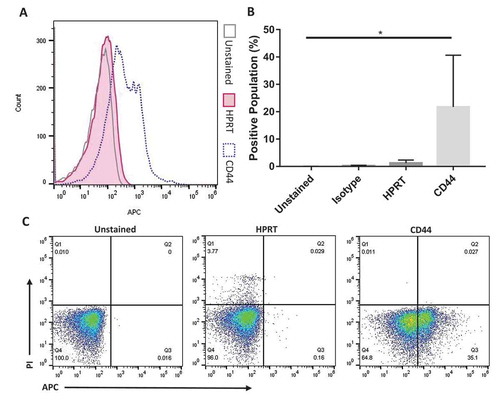
Figure 2. Flow cytometry analysis of HPRT expression on HT29, SW480, and SW620 cells. The following samples were utilized in order to evaluate the expression of HPRT on the surface of CRC cells: Unstained (auto-fluorescence control), Mouse IgG (Non-specific binding control), Rabbit IgG (Isotype control), NF-κB (cytosolic protein control), and CD44 (positive surface antigen). A, When treated with anti-HPRT antibody (pink), the histogram representation of the cell population showed a definitive shift in the population towards a higher fluorescence. Statistical analysis shows significant HPRT binding on the surface of SW620 cells (p value < 0.0001). B, SW480 cells treated with anti-HPRT antibody experienced a shift in fluorescent intensity, indicating HPRT surface localization. Upon statistical evaluation anti-HPRT treated cells show a significant difference when compared to isotype antibody controls (p-value = 0.0095). C, The same fluorescent shift in the population is seen when HT29 cells are exposed to anti-HPRT antibody. There was a shift in the population equivalent to 20%, which is statistically significant from the IgG controls. This indicates that HPRT has significant surface associations in HT29 cells. Statistical analysis shows significant HPRT binding with a p value of 0.0016. There is a significant difference between the levels of HPRT between the cell lines. While HPRT is statistically significant in both cell lines, the difference between the cell line expression is also statistically significant as SW620 cells have over 25% higher expression (p value = 0.0002). D, There was no significant change in the fluorescent population upon HPRT antibody treatment on the surface of Colo205 cells (p-value = 0.99).
HPRT is strongly associated with the plasma membrane of SW620 cells
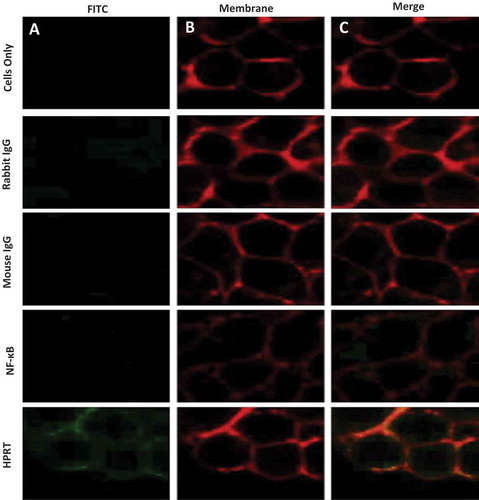
To ensure antibody binding was towards surface HPRT and not cytoplasmic HPRT, confocal microscopy was performed to visualize protein localization on SW620 cells (). In all controls we observed a minimal FITC signal, indicating insignificant antibody binding, with the exception of samples treated with anti-HPRT. SW620 cells treated with anti-HPRT FITC antibody had a noteworthy association with the plasma membrane. These images reveal a direct overlap between the plasma membrane and antibodies targeting HPRT. In addition, the FITC channel reveals a distinguishable external presence of HPRT as fluorescent antibody binding is only seen on the periphery of the cells.
Figure 3. Plasma membrane co-localization of HPRT in SW620 cells. SW620 cells were dyed with both a FITC dye and a Rhodamine Red membrane dye to label antibody treatments and the plasma membrane respectively. Utilizing unstained cells, IgG treated cells, and NF-κB treated cells as controls, plasma membrane associations were evaluated to determine whether any of the treatments significantly bound to the membrane of SW620 cells. A, Each sample was analyzed and imaged by a 488nm laser to illuminate FITC positive cells. These images show the binding of the respective antigen treatment. B, Samples were also imaged in a 594nm laser to show rhodamine positive cells. This dye binds to the plasma membrane of all cells. C, The two images obtained from column A and B were merged to show associations between treated antibodies and the plasma membrane of cells. These results show a clear overlap between cells treated with anti-HPRT antibody and those treated with the membrane dye.
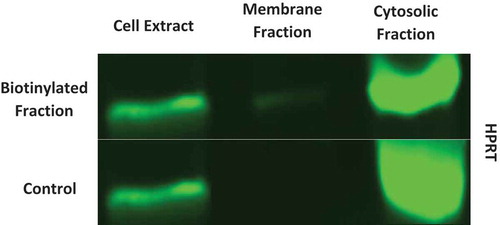
Western Blot analysis shows there is a significant presence of HPRT within SW620 cancer cells. Along with a clear presence of the protein, this analysis also confirmed HPRT as a membrane associated protein, as it is found in the biotinylated fraction of the cells ().
Figure 4. Western analysis of HPRT expression in both cytosolic and membrane fractions. Surface proteins were biotinylated and isolated for analysis. SW620 cell extract, membrane fractions, and cytosolic fractions were probed for HPRT along with a non-biotinylated control. This data shows that there is a very significant presence of HPRT within SW620 cytosol in addition to a clear presence on the surface of the cells.
Scanning electron microscopy reveals a random distribution of the protein across the surface of HT29 and SW620 cells
To evaluate whether surface HPRT binding was distributed across the membrane randomly, we utilized scanning electron microscopy to physically visualize the position of the enzyme on the surface of the cells. As pictured in and , both cell lines show an increase in gold particle binding when exposed to anti-HPRT antibodies. This same increase in expression is not seen with isotype controls and further implicates HPRT on the surface of the cells. The protein appears to be randomly presented across the plasma membrane with no clear pattern of expression. EDAX analysis () for each sample shows an increase in the gold percentage when cells were treated with anti-HPRT antibodies. A significant increase in sample elemental gold percentages is seen as SW620 cells (p-value of 8.14x10⁻⁶) and HT29 cells (p-value of 1.74x10⁻⁴) were treated with gold labelled HPRT antibodies. This analysis provides a further confirmation that HPRT is present on the surface of SW620 and HT29 colon cancer cells.
Figure 5. Scanning Electron Microscopy Images and resulting EDAX in HT29 and SW620 cells. Cells were labelled with gold towards their respective antibody treatment. The size scale is shown in each image and represents a 2µm distance. 5a-A & 5b-A, Images were obtained using a Back Scatter Electron (BSE) detector. This detector is specialized to image heavy metals within samples, and highlights enhanced gold within the sample. Any distinguishable large particles of gold represent a bound antibody. 5a-B & 5b-B, Images were also obtained with a Gaseous Side Electron (GSE) detector, which showed cell morphology to ensure correct cell structure and integrity. 5a-C & 5b-C, EDAX analysis of each sample showed the gold elemental peaks for all the elements present within the sample. Silicon is the highest represented element because cells were mounted on silicon cover slips for analysis. The gold elemental peak is indicated with a gold arrow. Images obtained from this analysis show the exact location of the HPRT bound to the surface of the cell, and show no patterns indicating a random distribution of the protein across the surface of the cell.
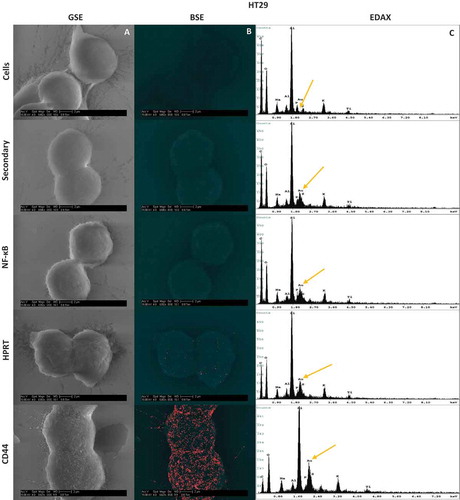
Figure 5. (Continued).
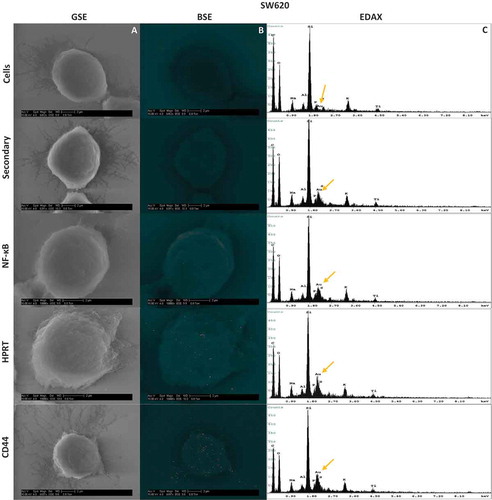
Figure 6. Gold percentage of SW620 and HT29 cells. The gold elemental composition of each sample is denoted on the Y-axis. The increase in the gold percentage when cells were exposed to HPRT and CD44 shows a quantifiable increase in the gold present on the outside of the cell. A, Gold elemental percentages in SW620 cells exposed to HPRT antibody had a gold weight of approximately 11.2%, which is statistically significant to the IgG controls used for background binding (p value < 0.0001). These data indicate a statistically significant presence of HPRT on the surface of SW620 cells. B, Gold elemental percentages in HT29 cells. Gold weight was approximately 10.4% with a p value < 0.0001.
Within normal colon samples from patients, there is insignificant levels of HPRT binding
To evaluate whether HPRT would be useful as a biomarker target for CRC patients, we measured the proteins levels on the surface of normal patient tissue. Flow cytometry revealed insignificant HPRT presence within normal colon tissue from healthy patients when compared to isotype controls (p value = 0.998) and unstained controls (p value = 0.996). When compared to a CD44 control, HPRT levels were minimal and shared similar binding to that of the isotype control, indicating its presence to be negligible in normal tissue ().
Figure 7. Normal colon tissue stained with HPRT antibodies shows no significant increase in fluorescence. A, Normal colon cells were treated with a variety of antibodies in order to select the correct cell population. Once this population was established, the fluorescent profile of each sample was obtained and graphed. Shown is the unstained control, CD44 positive control, and HPRT. There is a significant shift in the population when cells were exposed to anti-CD44 fluorescent antibodies, but a minimal shift is seen for anti-HPRT treated cells. B, Statistical analysis shows that HPRT had insignificant fluorescent increases when compared to isotype controls. C, These images portray the cell population of interest in quadrant Q3, which are CD45- and PI-, ensuring that cells analysed were not inherit lymphocytes within the tissue or dead cells.
HPRT expression within malignant tissue demonstrates the variable nature of HPRT upregulation
In order to evaluate HPRT expression levels within malignant tissue, 94 patient samples were stained (). While the overall average staining intensity of all malignant samples (p-value = 0.545) was insignificant when compared to normal patients, in 59% of the malignant tissue stained for HRPT, there was a substantial increase in the protein expression, while 41% of the patient samples showed insignificant increases in HPRT expression (). This elevation was statistically significant from normal tissue (p < 0.001) and demonstrates unique HPRT production within a cohort of the patients (). This expression was also significant when compared to the GAPDH control, which was utilized to assess housekeeping levels of protein expression.
Table 1. HPRT levels within malignant and normal colon tissue.
Figure 8. Evaluation of HPRT expression within patient tissue. All tissues were stained with a monoclonal anti-HPRT antibody. The resulting converted grayscale image is pictured in the top left corner of each image while the grayscale plot is below. A, Tissue from a 79-year-old female patient with stage IIB colon adenocarcinoma and B, tissue from a 48-year-old female patient with stage IV colon adenocarcinoma. These malignant tissues are significantly darker stained than normal colon tissue. C, Normal colon tissue from a 36-year-old male patient and D, tissue from a 31-year-old male patient. These tissues show an upregulation of HPRT within malignant cells.
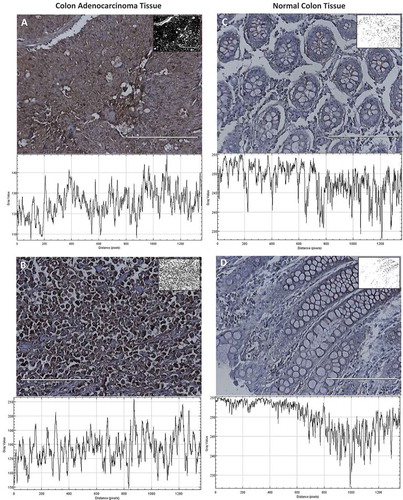
Figure 9. Statistical Analysis of HPRT expression within patient tissue. Quantification of tissue (n = 94) was conducted utilizing a grayscale. The lower the gray value, the darker the tissue is stained. An isotype control was run to establish the gray value of unstained tissue and to account for non-specific antibody binding. There is a statistically significant presence of HPRT in approximately half of the tissues obtained from patients which are labelled as HPRT Cancer Tissue (+). Patient tissue that did not show significant staining are labelled as HPRT Cancer Tissue (-). This increased expression shows that in some patients there is an increased expression of the protein when compared to normal tissue. GAPDH served as a positive control to establish housekeeping levels of staining and showed no statistical difference in expression between normal tissue and cancer tissue. This data indicates that HPRT may be upregulated within some patients and provides insight into how the protein may present on the surface of the cell.
Analysis within malignant colon samples confirms the variable nature of HPRT surface localization within patients
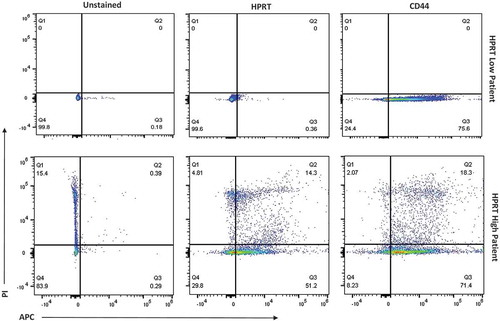
Three malignant biopsy samples were obtained from patients with colorectal cancer. Of the three samples obtained, two of them had no HPRT surface localization, while one of the samples had elevated surface HPRT (). This confirms the variation found within the tissues and the cell lines evaluated as the observed HPRT over-expression and subsequent surface presentation was not found within all the patients. Patients without surface localization had expression similar to the Colo205 cancer cell line tested, while patients with surface localization had HPRT expression similar to levels observed in SW620, HT29, and SW480 cell lines. As one of the patients had a significant level of HPRT on the surface of their tumor cells, it demonstrates there is potential for the protein to be targeted within those individuals who experience an up-regulation of the enzyme within their tumors.
Figure 10. Evaluation of HPRT surface expression in malignant HPRT tissue. Malignant tissue was treated with PI and anti-CD45 antibodies in order to isolate the correct cell population. Upon analzying three separate patients with colon cancer, there were two patients with “HPRT low” tumors and one patient with an “HPRT High” tumor.
Discussion
HPRT is a common housekeeping gene critical to the successful production and regulation of nucleotides within the cell cycl.Citation10 Our results show a significant presence of HPRT on the surface of HT29, SW620, and SW480 colorectal cancer cell lines. These results show a different role of HPRT within a malignant environment that has not been reported. Currently, HPRT is understood to be expressed at a relatively constant level within tumor cells as it is commonly used as an endogenous control for several molecular technique.Citation22–Citation27 Our results question the current view of HPRT within colon cancer tissue as it has shown to possess unique characteristics within cancer cell lines in addition to within malignant colon tissue. HPRT expression appears to be very similar to the expression of other biomarkers for colorectal cancer, such as the Vitamin D3 receptor which also shows presence on the surface of colon cancer cells and serves as a marker for cell differentiation and growt.Citation28 This marker is currently used to reduce tumors and it is likely that HPRT could serve this same purpose within colon cancer tissue as it seems to be related to cell proliferation, and appears to be absent on the surface of healthy tissue.
There is other evidence of salvage enzymes serving as diagnostic and prognostic biomarkers to diagnose and monitor cancer development in patient.Citation29 Thymidine Kinase 1 (TK1), another salvage pathway enzyme, serves as a serum biomarker for cancer recurrence and has shown to have potential as a therapeutic biomarker as wel.Citation30–Citation33 HPRT may also be used in a similar setting to aid in diagnosing cancers as it appears to only be upregulated in cancer tissue. Unlike TK1, it does not appear to be stage dependent, which would be useful as an early diagnostic companion tool to detect early stage cancer.Citation34 While pathologists analyze patient biopsy tissue, HPRT could also be evaluated to help in the initial diagnosis.
While HPRT is present on SW620, SW480 and HT29 cells, the relative abundance of the protein is not equal between the cell lines. SW620, the highest expressing cell line, has upwards of 25% more protein on the surface when compared to the lowest expressing HT29 cells. SW620 cells are derived from a metastatic lymph node and are aggressive, fast growing cancer cells. In contrast, HT29 cells are derived from a colorectal adenocarcinoma originating in the mucus glands in the colon and rectum and are consequently less aggressive. Our results potentially indicate that HPRT surface expression may be more abundant in aggressive, rapidly proliferating cells, but this needs to be further explored.
We hypothesize the observed surface expression of HPRT in these cell lines may point to a regulatory element of HPRT expression that has lost function in cancer cells within certain patient.Citation34 The HPRT gene has several regulatory transcription factors that control its expression (P53, NF-κB, FOXL1, etc…) which may be altered in SW620, SW480 and HT29 cells due to mutation. Loss of hprt gene control may increase levels of the protein in the cell and subsequently result in the export of the protein to the extracellular matrix where it may transiently reside on the surface of the cell. Further investigation into the mechanism by which this cytosolic protein is transported to the plasma membrane of these cancer cells needs to be evaluated to elucidate how HPRT is able to localize to the surface, and if it provides any functional advantage to the cancer cell. Furthermore, HPRT has shown to have a unique expression profile within a cohort of patients as determined by IHC staining. The over-expression of HPRT within these patients also points to a loss of HPRT regulation and may aid in determining which patients may experience this unique surface expression HPRT. While we were able to evaluate a few malignant cell lines and tumors for HPRT surface presentation, further testing with more patient samples will need to be done to determine how prevalent HPRT surface expression is and which patients could benefit from potentially targeting the protein. As colo205 cells do not show significant HPRT surface localization, further investigation into the mechanism of surface presentation needs to be conducted to determine the reason some cells express HPRT on the surface while others do not.
HPRT could be used as a valuable marker for studies evaluating biomarker targetin.Citation35 Testing against this antigen could provide researchers with significant advantages when evaluating therapy efficiency and may lead to a new biomarker target for the treatment of a subset of colorectal cancer patients who experience an upregulation and surface presentation of the protein.
Conclusions
As a surface biomarker that is not present in normal cells, HPRT could be used as a valuable target for immunotherapies. Patients who experience an elevation in HPRT within their tumors may use the protein as a means to reduce tumor burden by targeting HPRT+ cells.
Materials and methods
Chemicals
Anti-HPRT monoclonal antibody (Thermo Fischer Scientific) was aliquoted and stored at −20°C. Mouse-FITC and Rabbit-FITC antibodies (Sigma Aldrich) were stored at 4°C and were used in dark conditions. Bovine Serum Albumin (Sigma Aldrich) and Sodium thiosulfate (Macron Fine Chemicals) were dissolved in PBS at a 1% concentration and stored at 4°C. 50% Glutaraldehyde stock (Electron Microscopy Sciences) was stored at −20°C and workable solutions were diluted to 0.25% in PBS and stored at 4°C. Glycine (Thermo Fischer Scientific) was diluted to 0.2mM in PBS and stored at 4°C. NF-kB polyclonal antibody (Bioss Antibodies), DCK polyclonal antibody (rabbit: Abnova) and monoclonal antibody (mouse: Santa Cruz, Dallas TX) and APRT polyclonal antibodies (mouse: One World Labs, San Diego, Cal; rabbit: Abnova) were stored at −20°C. CD44 monoclonal antibody (One World Lab) was stored at −20°C. Propidium Iodide (Sigma Aldrich Inc.) was stored at 4°C and aliquoted for use. Fc Block was purchased from Biolegend and stored at 4°C. An APC-Conjugation Kit (Abcam) was stored at −20°C.
Cell culture conditions
The human colon carcinoma cell lines SW620, SW480, Colo205 and HT29 were obtained from the American Type Culture Collection. HT29 and Colo205 cells were grown in RPMI 1640 medium supplemented with 10% fetal bovine serum and 2mM L-Glutamine (all from Hyclone). SW620 and SW480 cells were grown in DMEM medium supplemented with 10% fetal bovine serum and 4mM L-Glutamine (all from Hyclone). The cell media was replaced every 48 hours and cells were trypsinized and the cell population was reduced by half once 90% confluence was obtained. Cells were treated with Acutase (Stem Cell Technology) when utilized for flow cytometry and when plated for all other applications. Cell viability was evaluated using a trypan blue staining, and cells were utilized for all applications when the viability was greater than 98%. All cells were grown at 37°C and 5% CO2. Cell lines were authenticated in May of 2016 by the University of Arizona Genetics Core.
Flow cytometry
The surface presence of HPRT, APRT, and DCK in cultured cells was evaluated measuring the fluorescence intensity of antibodies against each of the salvage pathway enzymes. All samples were analyzed on a Blue/Red Attune (Applied Biosystems), and 25,000–50,000 events were recorded per sample. Briefly, 3-5x10⁵ cells were incubated with 200µL of PBS containing 1µg of primary antibody treatment for 15 minutes on ice. Cells were then labelled with FITC-conjugated secondary (mouse or rabbit) antibody for 15 minutes on ice. Isotypic IgG and unstained cells served as negative controls to ensure correct cell gating. The forward/side-scatter plots were used to gate out cell doublets, dead cells, and cell debris. Using unstained and isotype controls as guides, the positive population was determined by the overall shift in the fluorescent intensity. Each cell line was independently analyzed four times and the data was plotted using FlowJo Software (FlowJo Enterprise). Cells were washed appropriately after each step of the protocol.
Patient tissue dissociation and analysis
Healthy and malignant colon tissue samples were obtained from the Utah Valley Regional Medical Center. Tissue samples were minced using sterile scalpels into pieces ranging from 2-3mm in length and were suspended in Hanks media (5% FBS). Minced tissue was then placed in a solution of Collagenase IV on a shaker for 1–4 hours depending on the fat percentage of the tissue. Once dissociated the solution was washed through a 100 micron filter, to produce a single cell suspension. These cells were then washed and treated with an Fc block to minimize non-specific antibody binding. Following blocking, cells were treated with anti-CD45 FITC, anti-HPRT APC and PI to aid in the selection of correct cell populations for analysis. Cells were gated on CD45- and PI- populations to avoid analysis of lymphocytes resident in the tissue and dead cells.
Biotinylation and western blot analysis
Cells were analysed for surface presence along with general expression within the cell utilizing the Pierce Cell Surface Protein Isolation Kit (Thermo Scientific). Briefly, 3 flasks of SW620 cells were grown to 95% confluency, washed, and treated with a kit-provided biotin solution. Following rocking on a shaker for 30 minutes at 4°C, the cells were treated with a quenching solution. Cells were detached from the flask via cell scraping and transferred to a 50mL conical vial for washing. Then, cells were treated with a lysis solution and incubated for 30 minutes at 4°C. Cell lysis was added to a neutravidin gel and incubated for 60 minutes at room temperature. This solution was then passed through a filter and proteins bound to biotin are trapped within the column. The neutravidin gel was washed 4 times and the flow through was collected and labelled “cytosolic fraction”. The biotin labelled protein was then eluted from the column utilizing a 50mM DTT solution and labelled “membrane fraction”.
Both membrane fractions and cytosolic fractions along with cell extract from SW620s were evaluated for protein expression utilizing standard Western Blotting techniques described in Sewda et al. with slight modifications.Citation36 Briefly, each sample was boiled for 5 minutes prior to running on a 12% polyacrylamide gel under reducing conditions. Gels were then transferred to a nitrocellulose membrane (Biorad Laboratories), blocked, and treated with an anti-HPRT monoclonal antibody overnight at 4°C. Following primary antibody treatment, membranes were washed and treated with a rabbit fluorescent secondary antibody (Licor) for 1 hour. Membranes were then imaged on a Licor Odyssey CLx. SW620 cells were utilized for this analysis because their expression of HPRT on the membrane is significantly higher than that of HT29 cells.
Confocal microscopy
Flourescently-stained cells were examined under an epiflouresence microscope (Olympus, Tokyo, Japan) equipped with a laser confocal system (Bio-Rad Laboratories, Hercules, CA) containing a 15mW Krypton/Argon laser. Image processing was carried out with Laser Sharp Computer Software (Bio Rad Laboratories). After treatment with acutase, cells were plated at a concentration of 400,000 cells/mL on glass coverslips. Following one to two days of growth, cells were incubated in 500uL of PBS containing 2.5µg of anti-HPRT antibody for 15 minutes on a shaker at 4°C. Cells were then labelled with 2.5µg of FITC-conjugated secondary antibody for 15 minutes on a shaker at 4°C. Then, cells were incubated at 37°C for 10 minutes with a 1:1000 dilution of a Cell Mask Deep Red plasma membrane dye (Fisher Scientific).
Electron microscopy
Following acutase treatment, cells were plated at a concentration of 400,000 cells/mL on glass coverslips. After one to two days of growth, cells were placed in 6 well plates and washed with PBS three times and with 1% PBS-BSA for 5 minutes at 4°C followed by a sodium azide wash. Cells were then incubated with 2.5µg or 5µg of primary antibody conjugated to Biotin for 15 minutes on a shaker at 4°C. After primary incubation, cells were washed with 1% PBS-BSA followed by two washes with PBS. Then, cells were washed with 1% PBS-BSA and 1% PBS-sodium thiosulfate for 5 minutes on a shaker at 4°C. Cells were incubated with 2.5µg of Streptavidin-gold conjugate (Nanoprobes, Yaphank, NY) for 15 minutes on a shaker at 4°C. This is followed by a 1% PBS-BSA wash and three PBS washes. Cells were then fixed with a 0.25% Glutaraldehyde solution diluted in PBS for 5 minutes. The reaction was then extinguished by adding a 0.2mM PBS-Glycine Solution and incubating for 10 minutes until the solution turned a slight yellow color. Cells were then washed three times with ddH2O. Solutions A and B from the Nanoprobes gold enhancement kit (Nanoprobes Inc.) were incubated together for 5 minutes. Solutions C and D were then added, vortexed, and 40µL of the gold enhancement were added to each sample and incubated for 5 minutes. Each sample was put through a series of dehydrations with 70%, 80%, 90%, and 100% ethanol. Gold labelled samples were examined under a Phillips XL-30 ESEM using a 15kV electron stream under low vacuum conditions at 1 Torr. A Gaseous Side Electron (GSE) detector was utilized to image the cell morphology and topography. A Back Scatter Electron (BSE) detector was utilized to visualize gold particles on the cell surface. Once images for the cells were obtained, the elemental composition of the cells was evaluated using energy dispersive spectroscopy (EDAX) and X-rays. EDAX analysis will provide a k-ratio, a Z value, an A value, and an F value. The k-ratio represents the element’s peak height compared to a sample of the pure element collected under the same conditions. The Z value represents a correction in the atomic number taking backscattered election yield of the pure element and the sample. The A value represents a compensation for X-rays generated in the sample that are cannot emit energy. The F value represents a correction for the generation of X-rays. We used these EDAX output values to normalize our samples gold weight percentages using the following equation:
Immunohistochemistry
Colorectal Adenocarcinoma tissue arrays were obtained from BioMax. These tissues contain various stages of cancer along with corresponding benign and normal tissue from 100 different patients. HPRT levels were assessed utilizing standard immunohistochemistry staining. Tissues were rehydrated in a series of ethanol washes before treatment with a DIVA (Biocare Medical) solution to retrieve antigen. Tissues were then incubated with a Background Sniper (Biocare Medical) solution to reduce non-specific antibody binding. Following blocking, a primary antibody is added to the tissue at a concentration of 1:100 to 1:200 and incubated overnight at 4°C. Following primary staining, tissues were washed and then treated with secondary antibody conjugated to a HRP polymer (Biocare Medical) and incubated for an hour. Following washing, a DAB Peroxidase solution was incubated with the tissues. Areas of antibody binding converted the colorless substrate to a brown product, effectively highlighting the target protein. Tissues were treated with hematoxylin (Biocare Medical) to stain the nucleus of the cells. Along with HPRT treatment, a universal negative antibody (Biocare Medical) was used as a negative control, and a GAPDH antibody was used as a positive control.
Tissues were quantified utilizing ImageJ software. All images were evaluated using the IHC toolbox ImageJ plugin. The DAB option is chosen and the tissue image is then removed of all other staining except for DAB. Following this analysis, the image is then converted to a grayscale and a threshold is applied in order to eliminate areas of no staining inherit within the tissue image. Once the threshold is applied the average gray value of the tissue is collected. The same threshold is applied to all tissue samples in order to ensure consistency.
Statistical analysis
ANOVA statistical analysis with the multiple comparison method were used to determine the differential surface expression of the various treatments for flow cytometry data on all cell lines. In addition, two-way ANOVA tests were performed to compare the mean expression of HPRT between SW620 and HT29 cells. EDAX data was analyzed using an ANOVA with the multiple comparison method in addition to unapired t tests to determine significance between samples. All statistical analysis was evaluated using GraphPad Prism 7 software. Differences were considered significant when the p value was < 0.05.
Abbreviations
| HPRT | = | Hypoxanthine Guanine Phosphoribosyltransferase |
| APRT | = | Adenine Phosphoribosyltransferase |
| DCK | = | Deoxycytidine Kinase |
| GSE | = | Gaseous Side Electron |
| BSE | = | Back Scatter Electron |
| EDAX | = | Energy Dispersive Spectroscopy |
Disclosure of Potential Conflicts of Interest
The authors declare that they have no competing interests
Ethics approval and consent to participate
All procedures performed in studies involving human participants were in accordance with the ethical standards of the institutional and/or national research committee and with the 1964 Helsinki declaration and its later amendments or comparable ethical standards.
Acknowledgments
We would like to acknowledge Michael D. Anderson for conducting the staining of cells for scanning electron microscopy analysis.
We would also like to thank a team of doctors at the Utah Valley Regional Medical Center for providing healthy tissue samples.
References
- American Cancer Society. Cancer facts & figures 2015. Cancer Facts Fig. 2015;2015:1–9.
- Wang C, Xie J, Guo J, Manning HC, Gore JC, Guo N. 2012. Evaluation of CD44 and CD133 as cancer stem cell markers for colorectal cancer. Oncol Rep. 28:1301–1308. doi:10.3892/or.2012.1910.
- Fong Y, Fortner J, Sun RL, Brennan MF, Blumgart LH. Clinical score for predicting recurrence after hepatic resection for metastatic colorectal cancer: analysis of 1001 consecutive cases. Ann Surg. 1999;230. 309-318-321. doi:10.1097/00000658-199909000-00004.
- Lynch HT. 030306 hereditary colorectal cancer. Color Cancer. 2003;348:919–932. [Internet]. http://www.med.upenn.edu/gastro/documents/NEJMhereditarycolorectalcancer.pdf
- Finkelstein SD, Sayegh R, Christensen S, Swalsky PA. 1993. Genotypic classification of colorectal adenocarcinoma. Biologic behavior correlates with K-ras-2 mutation type. Cancer. 71:3827–3838. doi:10.1002/(ISSN)1097-0142.
- Leibovitz A, Stinson JC, McCombs III WB, Mccoy CE, Mazur KC, Mabry ND. Classification of human colorectal adenocarcinoma cell lines. Cancer Res. 1976;36:4562–4569. [Internet]. www.ncbi.nlm.nih.gov/pubmed/1000501
- Vasen HFA, Watson P, Mecklin JP, Lynch HT. 1999. New clinical criteria for Hereditary Nonpolyposis Colorectal Definition (HNPCC, Lynch Syndrome) proposed by the international collaborative group on HNPCC. Gastroenterol. 116:1453–1456. doi:10.1016/S0016-5085(99)70510-X.
- Schneider M, Huber J, Hadaschik B, Siegers GM, Fiebig -H-H, Schüler J. 2012. Characterization of colon cancer cells: a functional approach characterizing CD133 as a potential stem cell marker. BMC Cancer. 12:96. doi:10.1186/1471-2407-12-96.
- Becerra AL. 1998. The role of gene duplication in the evolution of purine nucleotide salvage pathways. Origins of life and evolution of the biosphere. 28:539–553.
- Stout JT, Caskey CT. 1985. HPRT: gene structure, expression, and mutation. Annual Reviews Genetics. 19:127–148.
- Mummaneni P, Yates P, Simpson J, Rose J, Turker MS. 1998. The primary function of a redundant Sp1 binding site in the mouse aprt gene promoter is to block epigenetic gene inactivation. Nucleic Acids Res. 26:5163–5169. doi:10.1093/nar/26.22.5163.
- Sabini E, Ort S, Monnerjahn C, Konrad M, Lavie A. 2003. Structure of human dCK suggests strategies to improve anticancer and antiviral therapy. Nat Struct Biol. 10:513–519. doi:10.1038/nsb942.
- Wilson JM, Tarr GE, Kelley WN. 1983. Human hypoxanthine (guanine) phosphoribosyltransferase; an amino acid substitution in a mutant form of the enzyme isolated from a patient with gout. proc Natl Acad Sci USA. 80:870–873.
- Nyhan EL. 2008. Lesch-Nyhan Disease. Nucleosides, Nucleotides and Nucleic Acids. 27: 6–7, 559–563.
- Zoref-Shani E, Feinstein S, Frishberg Y, Bromberg Y, Sperling O. 2000. Kelley-Seegmiller syndrome due to a unique variant of hypoxanthine-guanine phosphoribosyltransferase: reduced affinity for 5-phosphoribosyl-1-pyrophosphate manifested only at low, physiological substrate concentrations. Biochim Biophys Acta Mol Basis Dis. 1500:197–203. doi:10.1016/S0925-4439(99)00103-9.
- Torres RJ, Puig JG. 2007. Hypoxanthine-guanine phosophoribosyltransferase (HPRT) deficiency: lesch-nyhan syndrome. Orphanet J Rare Dis. 2:48. doi:10.1186/1750-1172-2-48.
- Kostalova E, Pavelka K, Vlaskova H, Musalkova D, Stiburkova B. Clinica Chimica Acta Corrigendum to “ Hyperuricemia and gout due to de fi ciency of hypoxanthine – guanine phosphoribosyltransferase in female carriers : new insight to differential diagnosis. Clin Chim Acta. 2015;447:121. [Internet]. Elsevier B.V. doi:10.1016/j.cca.2015.04.018.
- Jones PA, Taylor SM, Mohandas T, Shapiro LJ. 1982. Cell cycle-specific reactivation of an inactive X-chromosome locus by 5-azadeoxycytidine. Proc Natl Acad Sci U S A. 79:1215–1219. doi:10.1073/pnas.79.4.1215.
- Maddika S, Ande SR, Panigrahi S, Paranjothy T, Weglarczyk K, Zuse A, Eshraghi M, Manda KD, Wiechec E, Los M. Cell survival, cell death and cell cycle pathways are interconnected: implications for cancer therapy. Drug Resist Updat. 2007;10:13–29. doi:10.1016/j.drup.2007.01.003.
- Kaziro Y, Itoh H, Kozasa T, Nakafuku M, Satoh T. 1991. Structure and function of signal-transducing GTPbinding proteins. Annu Rev Biochem. 60:349–400.
- Meller M, Vadachkoira S, Luthy DA, Williams MA. 2005. Evaluation of housekeeping genes in placental comparative expression studies. Placenta. 26:601–607. doi:10.1016/j.placenta.2004.09.009.
- Carver BS, Tran J, Gopalan A, Chen Z, Shaikh S, Carracedo A, Alimonti A, Nardella C, Varmeh S, Scardino PT, et al. 2009. Aberrant ERG expression cooperates with loss of PTEN to promote cancer progression in the prostate. Nat Genet. 41:619–624. doi:10.1038/ng.370.
- Liu DW, Chen ST, Liu HP. Choice of endogenous control for gene expression in nonsmall cell lung cancer. Eur Respir J Off J Eur Soc Clin Respir Physiol. 26;2005:1002–1008.
- Reijm EA, Jansen MP, Ruigrok-Ritstier K, van Staveren IL, Look MP, van Gelder ME, Sieuwerts AM, Sleijfer S, Foekens JA, Berns EM. 2011. Decreased expression of EZH2 is associated with upregulation of ER and favorable outcome to tamoxifen in advanced breast cancer. Breast Cancer Res Treat. 125:387–394. doi:10.1007/s10549-010-0836-9.
- Boonstra R, Timmer-Bosscha H, van Echten-Arends J, van der Kolk DM, van den Berg A, de Jong B, Tew KD, Poppema S, de Vries EGE. 2004. Mitoxantrone resistance in a small cell lung cancer cell line is associated with ABCA2 upregulation. Br J Cancer. 90:2411–2417. doi:10.1038/sj.bjc.6601863.
- Lukasiak S, Schiller C, Oehlschlaeger P, Schmidtke G, Krause P, Legler DF, Autschbach F, Schirmacher P, Breuhahn K, Groettrup M. 2008. Proinflammatory cytokines cause FAT10 upregulation in cancers of liver and colon. Oncogene. 27:6068–6074. doi:10.1038/onc.2008.201.
- Morimoto-Tomita M, Uchimura K, Bistrup A, Lum DH, Egeblad M, Boudreau N, Werb Z, Rosen SD. 2005. Sulf-2, a proangiogenic heparan sulfate endosulfatase, is upregulated in breast cancer. Neoplasia Neoplasia Press Inc. 7:1001–1010.
- Shabahang M, Buras RR, Davoodi F, Schumaker LM, Nauta RJ, Evans SR. 1,25-Dihydroxyvitamin D3 receptor as a marker of human colon carcinoma cell line differentiation and growth inhibition. Cancer Res. 53;1993:3712–3718.
- Alegre MM, Weyant MJ, Bennett DT, Yu JA, Ramsden MK, Elnaggar A, Robison RA, O’Neill KL. 2012. Thymidine kinase 1 upregulation is an early event in breast tumor formation. p. 2012.
- Li HX, Lei DS, Wang XQ, Skog S, He Q. Serum thymidine kinase 1 is a prognostic and monitoring factor in patients with non-small cell lung cancer. Oncol Rep. 2005;13:145–149. [Internet]. [accessed 2017 Nov 3]. http://www.ncbi.nlm.nih.gov/pubmed/15583816
- Alegre MM, Weyant MJ, Bennett DT, Yu JA, Ramsden MK, Elnaggar A, et al. Serum detection of thymidine kinase 1 as a means of early detection of lung cancer. Anticancer Res. 2014;34:2145–2152.
- He E, Xu XH, Guan H, Chen Y, Chen ZH, Pan ZL, et al. Thymidine kinase 1 is a potential marker for prognosis and monitoring the response to treatment of patients with breast, lung, and esophageal cancer and non-hodgkin’s lymphoma. Nucleosides Nucleotides and Nucleic Acids. 2010;29:352–358. [Internet]. [accessed 2017 Nov 3]. http://www.ncbi.nlm.nih.gov/pubmed/20544519
- Alegre MM, Robison RA, O’Neill KL. Thymidine kinase 1: a universal marker for cancer. Cancer Clin Oncol. 2013;2:159–167. [Internet]. http://www.ccsenet.org/journal/index.php/cco/article/view/26281
- Townsend MH, Felsted AM, Ence ZE, Piccolo SR, Robison RA, O’Neill KL. Elevated expression of hypoxanthine guanine phosphoribosyltransferase within malignant tissue. Cancer Clin Oncol. 2017;6:19. [Internet]. http://ccsenet.org/journal/index.php/cco/article/view/70556
- Townsend MH, Anderson MD, Weagel EG, Velazquez EJ, Weber KS, Robison RA, O’Neill KL. 2017. Non-small-cell lung cancer cell lines A549 and NCI-H460 express hypoxanthine guanine phosphoribosyltransferase on the plasma membrane. Onco Targets Ther. 10:1921–1932. doi:10.2147/OTT.S128416.
- Sewda K, Coppola D, Enkemann S, Yue B, Kim J, Lopez AS, Wojtkowiak JW, Stark VE, Morse B, Shibata D, Vignesh S, Morse DL. 2016. Cell-surface markers for colon adenoma and adenocarcinoma. Oncotarget. 7:17773–17789. doi:10.18632/oncotarget.7402.