
ABSTRACT
This review article collects knowledge on the use of eye-tracking and machine learning methods for application in automated and interactive geovisualization systems. Our focus is on exploratory reading of geovisualizations (abbr. geoexploration) and on machine learning tools for exploring vector geospatial data. We particularly consider geospatial data that is unlabeled, confusing or unknown to the user. The contribution of the article is in (i) defining principles and requirements for enabling user interaction with the geovisualizations that learn from and adapt to user behavior, and (ii) reviewing the use of eye tracking and machine learning to design gaze-aware interactive map systems (GAIMS). In this context, we review literature on (i) human-computer interaction (HCI) design for exploring geospatial data, (ii) eye tracking for cartographic user experience, and (iii) machine learning applied to vector geospatial data. The review indicates that combining eye tracking and machine learning is promising in terms of assisting geoexploration. However, more research is needed on eye tracking for interaction and personalization of cartographic/map interfaces as well as on machine learning for detection of geometries in vector format.
ABSTRAITE
Cet article de synthèse recueille des connaissances sur l'utilisation de méthodes de suivi oculaire et d'apprentissage automatique appliquées à des systèmes de géovisualisation automatisés et interactifs. Nous nous concentrons sur la lecture exploratoire de géovisualisation (abrégé en géoexploration) et sur les outils d'apprentissage automatique pour l'exploration de données géospatiales vectorielles. Nous examinons particulièrement les données géospatiales non étiquetées, sujettes à confusion ou inconnues de l'utilisateur. La contribution de cet article est dans 1) la définition de principes et de besoins pour permettre l'interaction de l'utilisateur avec les outils de géovisualisation qui apprennent de l'utilisateur et s'adaptent à son comportement 2) l'analyse de l'utilisation de méthodes de suivi oculaire et d'apprentissage pour la conception de systèmes de cartes interactives sensibles au regard (GAIMS). Dans ce contexte, nous examinons la littérature sur 1) la conception des interfaces homme-machine (HCI) pour l'exploration de données géospatiales 2) l'utilisation du suivi oculaire pour des expériences cartographiques, et 3) l'apprentissage appliqué aux données géospatiales vectorielles. L'état de l'art montre que la combinaison du suivi oculaire et de l'apprentissage est prometteuse pour assister la géoexploration. Il manque cependant des recherches sur le suivi oculaire pour les interactions et la personnalisation des interfaces cartographiques ainsi que sur l'apprentissage automatique pour la détection de géométries vectorielles.
1. Introduction
In this digitally enabled era, enormous volumes of geospatial data are constantly produced. Data collection is not a challenge anymore as it was before but making sense of the collected data is. Interpreting the geospatial content is particularly challenging for humans when the data is confusing or unknown to them. This kind of data may contain phenomena, patterns or relationships that are unstructured, unannotated, unclear, and therefore unfamiliar to the user. The task of reading geovisualizations of such data is not easy for human interpreters as the readers want to understand the data but are not specifically certain about what they are searching for. This is often the case dealt in the security and defense sectors which have caught more and more attention lately due to pressing global safety and security crises. In such data exploration cases, humans naturally tend to seek readily familiar shapes and patterns in the data (Jäkel et al., Citation2016; Wertheimer, Citation1923). To be able to recognize different shapes and patterns, the data should be examined from different viewpoints, for which the visual analytics and geovisual exploration (abbr. geoexploration) tools are often utilized (Andrienko & Andrienko, Citation1999). As suggested by many researchers (e.g. Çöltekin et al., Citation2017; Koua & Kraak, Citation2004; Richter et al., Citation2015), these tools are necessary for visual search, data mining, and improving our understanding of not only phenomena, facts, and attributes about geographic features but also fundamental distributions, patterns, and trends in the geospatial data. Nonetheless, the efficient use of these tools can be left deficient due to inadequate classification and parameterization in geovisualization. Therefore, the facilitation of human–computer interaction (HCI) in the most user-driven and informative manner during map use is necessary.
The central motivation of our research is to seek ways to enable map users to see the geospatial data differently than their original ideas. Their individual behavioral data can be utilized as input to revisualize, modify, and reform the geospatial data to assist in information extraction as well as discover new insights or patterns. For that, we need new kinds of interactive methods (e.g. utilizing eye tracking as a tool to interact with geospatial data) and new data processing approaches (e.g. machine learning, deep learning methods for vector geospatial data). Matching user behavioral data (e.g. eye movements) with the vector characteristics of map features can be a way for developing such interactive geovisualization tools (e.g. Göbel et al., Citation2019). When integrated, eye tracking and machine learning can steer HCI in a more user-centered and informative manner. The main challenges for this development are (i) gaze-based interaction with cartographic displays and (ii) machine learning tools for vector geospatial data processing. Next, we detail the current state and the challenges in eye tracking and machine learning, respectively.
Eye tracking has been commonly used to collect users’ eye movements to measure user experience towards any kind of visual stimulus or interface as well as for cartographic usability research (e.g. Çöltekin et al., Citation2010; Fabrikant et al., Citation2010; Ooms, Citation2012) and therefore, it can aid for either evaluating the map design or for exploring the cognitive processes of map users. However, interaction with systems going beyond geovisualization and analytical approaches of assessing map reading (considering factors such as map structure, hierarchy or dynamic interfaces) are still the remaining challenges for eye tracking in geospatial context. Hence, we would like to tackle the challenges of finding ways to guide map users through gaze activity for enhancing their geoexploration performance. Within this article, we use the term geoexploration for exploratory reading of geovisualizations, or geovisual exploration.
In geospatial domain, eye tracking has rarely been utilized as a tool to interact with visual displays (e.g. Göbel et al., Citation2020) unlikely to its implementation in other domains such as gaming industry (e.g. CitationTobii Concept Validation Tool). For example, an eye tracking headset can be engineered for immersive and enriched game experience by letting PCs know where users are visually focused, so that the users’ instincts can be integrated into games. UX/UI for cartographic displays is not this developed yet. Although we collect tremendous amounts of eye movement data, we do not utilize this personal data during user interaction. Eye movements can be used not only to guide the attention of map users effectively, but also to make geospatial content clearer by incorporating this information into design on-the-go. This can be done by altering visual variables, modifying visualization type through grouping, and revisualizing similar map features based on users’ attentional feedback, which are the eye movements, in this case.
Machine learning algorithms, on the other hand, can be used to identify and cluster map features with the same characteristics, therefore exploring patterns and relationships in the data. Acknowledged machine learning methods and data processing frameworks have mainly been developed in the machine vision domains for raster data processing. Accordingly, there exist several applications of machine learning in geo domain, such as land-use and land-cover classification of remotely sensed images, or clustering point clouds within LIDAR images (e.g. Ding et al., Citation2018; Kumar et al., Citation2019). There is a lack of research in applied contexts for vector geospatial data, although machine learning holds great potential for characterizing such data and understanding the patterns and relationships within topographic or other complex terrain maps, particularly in cases of unknown data explained earlier. This situation is largely due to machine learning being extremely difficult for humans to conceive (Andrienko et al., Citation2022) but there is a growing body of knowledge on white-box AI to make AI transparent, explainable and interpretable (Xu et al., Citation2019).
Applying AI to learn geometries and topologies by detecting geometrical structures in vector data and processing vector datasets directly without rasterization will be advantageous for eye tracking in cartographic research. For instance, if map stimuli used in eye tracking experiments were in vector format, it would be more straightforward to match the map features that the participants look at with the actual vector data of the map stimuli (e.g. linear or polygon features). In their previous work, Göbel et al. (Citation2019) demonstrated that it is possible to correlate the coordinates of map features with the collected gaze coordinates, thus, to list the map features (e.g. lines or polygons) that are looked at. If such an eye tracking system is combined with machine learning, we can obtain information about attentive map features, as well as can recognize all the other unseen map features that have similar characteristics with the ones that are already looked at. This way we can reorganize the data in a way that is interesting to the users or somehow steer them into discovering new phenomenon, structures, or patterns in the geovisual scene. We previously introduced a concept for designing such Gaze-Aware Interactive Map System (GAIMS) (Keskin & Kettunen, Citation2021) and hypothesized that highlighting the already seen features might steer users’ attention to unseen areas and help them make sense of the map. Therefore, GAIMS uses highlighting to revisualize vector map features (i.e. lines and polygons) receiving the highest attention from map users, and the ones having the same vector characteristics (e.g. curvature, length, number of segments, etc.) as those throughout the whole map ().
Figure 1. GAIMS workflow: Highlighting vector features based on eye tracking data.
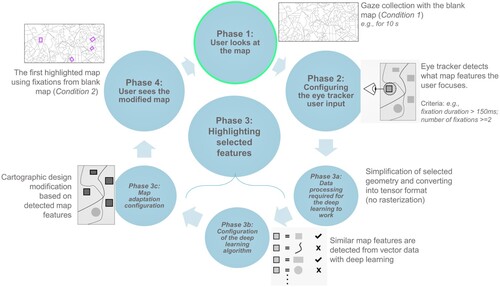
Implementing above mentioned user-driven approach into map design (i.e. combining eye tracking and machine learning to support geoexploration) will allow for effectively bringing out diverse characteristics of complex features in the vector geospatial data. By integrating these topics and synthesizing from what has been researched earlier, we present a literature review of state-of-the-art methods for interactive geovisualization systems that learn from and adapt to user behavior by incorporating machine learning and eye tracking. With this literature review, we aim
to define principles and requirements for enabling user interaction with the geovisualizations that learn from and adapt to user behavior (see RQ1)
to review the use of eye tracking to design automated and interactive geovisualizations (i.e. gaze-aware interactive map systems: GAIMS) (see RQ2)
to create extensive knowledge about the state of the art of machine learning methods for interactive geoexploration (see RQ3)
Consequently, our main research questions are:
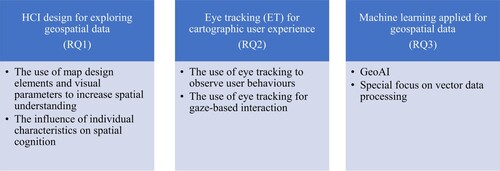
RQ1: How can map users be assisted in exploring unknown geospatial data? (see HCI design for exploring geospatial data, Section 2)
RQ2: What methods can be used to design geovisualizations that are tailored to users’ attentional behavior and enhance their spatial understanding? (see Eye tracking for cartographic user experience, Section 3)
RQ3: How can the patterns or information among map features be understood using only the geometries presented in maps without any prior/additional information? (see Machine learning applied for geospatial data, Section 4)
Linking our research questions with research goals, we present the related literature in the order shown in . In this context, we used narrative review by selecting, comparing, and summarizing existing theories and models in the fields of Human–Computer Interaction, eye tracking, and GeoAI, as well as incorporating our research experience. Our reviewing methodology is a mixture of a status quo and issue review, and we considered the research in the last 25 years to answer our three main research questions.
Figure 2. Contents of the literature review.
2. Human–computer interaction design for exploring geospatial data
Human–computer interaction (HCI) and geographic information science (GIScience) are strongly interdisciplinary as they both borrow theories, methods and techniques from other scientific domains. HCI involves computer science, cognitive, social and organizational psychology, ergonomics, human factors, linguistics, artificial intelligence, philosophy, sociology, anthropology, engineering, and design. Humans and computers are good at different things. As explained by Richter et al. (Citation2015): ‘While humans are better at tasks involving unfamiliar pattern interpretation, adaptation to changing contexts and heuristics, machines can detect, process, store and retrieve accurately and efficiently large amounts of data, interpret familiar patterns and efficiently conduct complicated calculations’ (p. 3). Accordingly, ‘a meaningful human–computer interaction’ is made possible if both parties work as a team in which their strengths are combined. Human and computer should complement each other in a way that user capabilities are enhanced with the assistance of the computer when performing complex cognitive tasks (Richter et al., Citation2015). This is a subject of applied cognitive science, in other words, cognitive engineering.
Cognitive engineering deals with the design and construction of machines by integrating cognitive psychology, cognitive science, and human factors (Norman, Citation1986). The goal of cognitive engineering is to minimize the gap between psychological user variables and physical system variables by translating users’ psychological intentions into physical actions in the mechanical system. User requirements play a central role in user interface design, and this is called user-centered design in which users are involved in the entire usability cycle. When these cognitive engineering theories and methods and the principles of human communication and reasoning are implemented in geospatial context, it is called ‘spatial cognitive engineering’ (Raubal, Citation2009).
Keeping the above definitions in mind, we list five important considerations of Fuchs et al. (Citation2009) when humans and machines are to be combined:
Confirmation bias: A human inclination to seek new information verifying the current hypothesis while avoiding information and interpretations that contradict prior beliefs. People tend to favor default options or a status quo when they make choices, rather than taking the time to consider and adopt an alternative option, and they also take the path of the least resistance or prefer to do what they have been doing, even when they could make improvements, especially when they have a series of alternatives. The reasons for this decision bias roots in people’s limited attention and tendency to search for satisfaction, and the (false) belief that the default option is the most popular and would limit physical and psychological risk (Eidelman & Crandall, Citation2009; Kahneman et al., Citation1991; Leonard, Citation2008; Samuelson & Zeckhauser, Citation1988).
No free lunch: There is no optimal search or learning configuration. Accordingly, modifying one parameter that helps to solve some issues might have an opposite effect for other issues.
Strengths and weaknesses: Humans are good at identifying the problem at hand, making decisions related to optimization, limiting the search space, and extracting information albeit the data is noisy or incomplete. On the other hand, the machines are capable of working low-cost, fast, tireless, and performing large searches in large and unstructured search spaces.
No labels: The difficulty to pre-determine data ranges and labels until engineers gain experience with the data.
User requirements: are composed of control (i.e. steering the machine learning process through the decisions made by engineers), robustness (i.e. the insensitivity to small errors or deviations from assumptions), and understandability (i.e. straightforward visualization of results and their textual representation to facilitate reporting) (Fuchs et al., Citation2009).
Besides supporting exploratory analysis, visualization and visual analytics systems serve as ‘human insights’ interfaces that support and enable decision-making. Therefore, they are capable of answering ‘why’ and ‘so what’ questions that decision makers frequently ask. Ideally, if AI-based visualization systems learn from user behavior, they can suggest subsequent actions and provide easily reportable results as well aslet users specify what they are searching for based on their needs, instead of instructing what is shown and how. This is what makes visualization a fundamental component for ‘sense making, analysis, and communication in the emerging human-machine enterprise world’ (Basole et al., Citation2019; Shneiderman, Citation2002).
Information visualization and data visualization are broader concepts which include geovisualization and cartographic visualization (spatial, temporal, or attribute, or a combination of all three). Geovisualization is defined as ‘the processes of creating interactive visualizations for geographic analysis, using maps, map-like displays, multimedia, plots, and graphs (also in combination) to aid visual thinking and insight or hypotheses generation, and a perspective on cartography’ (Çöltekin et al., Citation2018, p. 1). It emphasizes knowledge construction instead of knowledge storage or information transmission and when created by considering human understanding, it facilitates geoexploration and decision-making processes (MacEachren & Kraak, Citation1997). The powerful traits of geovisualization come from its interaction with several other disciplines including visual analytics, information visualization, scientific visualization, statistics, computer science, art and design, and cognitive science (Çöltekin et al., Citation2018).
On the other hand, data or information exploration is the process of examining a dataset in a systematic or unstructured way to uncover initial patterns, characteristics, and points of interest. This can be done through summarizing and plotting the data, and conducting statistical analyses to gain insights and test or build post-hoc hypotheses (Çöltekin et al., Citation2018; Idreos et al., Citation2015). The exploration is generally performed using both automated methods as mentioned in the previous sentence and manual activities that are dependent on individual differences (e.g. age, gender, expertise, etc.). Accordingly, information exploration and geoexploration are interconnected in a sense that individual characteristics (see Section 2.2) and information-seeking behavior are associated. Observing geoexploration behavior provides a more accurate prediction of the information exploration patterns compared to studying individual differences (Choi et al., Citation2016). Therefore, understanding how people interact with information provides an essential input to design those representation or visualizations. Next, we present research on this topic and the influence of individual characteristics on spatial cognition.
2.1. The use of map design elements and visual parameters to increase spatial understanding
People’s abilities of information extraction are also influenced by map design elements and visual parameters. Defining map design and visualization parameters are essential for interactive geoexploration tools. Çöltekin et al. (Citation2017) listed three primitives, which could be turned into practical guidelines for customized geovisualizations:
from design perspective, Bertin (Citation1967) visual variables (as we also explain in detail later in this section),
from task perspective, (Knapp, Citation1995) six-step taxonomy including task (simple or complex), goal, physical actions, mental actions, data, and visual operators,
from human factors perspective, Hegarty et al.’s (Citation2006) work on spatial abilities at different scales and working memory
In this chapter, we discuss the influence of symbology and visual variables used to depict map features on the usability of maps and their role in the development of interactive map displays.
Bertin’s (Citation1967) visual variables (i.e. position, size, shape, color hue, color value, saturation, orientation, and texture) together with the added variables regarding the technological advancements (e.g. transparency: Morrison (Citation1974); crispness, resolution: MacEachren (Citation1992)) are the fundamental design elements that characterize map symbols and encode map-related information (please read Roth (Citation2017) for a detailed overview). These graphical elements maintain the harmonious visual hierarchy and have a huge impact on perception and distinguishing between different map symbols.
The map design process needs to find a balance between preserving the visual coherence throughout the whole map series while at the same time presenting context- aware information, which characterizes the individual map types (Flink et al., Citation2011). Inherently, visual variables may function differently in static, interactive, and animated geovisualizations. Kettunen and Oksanen (Citation2019) found that the graphical parameters of an animated vector field visualization did not affect the interpretation of wind fields when searching for the most intensive locations of wind, neither in simple nor integrative visual search. They concluded that the communicative power of motion as a visual cue overdrives visual changes in the graphical parameters, such as line length, density, or width. On the other hand, map structure and symbology are important parameters in map reading. Visual variables such as color, size, shape, and location, visual search processes utilized in map reading, learning processes related to maps (e.g. Keskin et al., Citation2018; Ooms, Citation2012), and the influence of graphics or text on spatial cognition have all been often studied. For example, Palka et al. (Citation2018) showed the effects of associating a cartographic symbol with a descriptive text on evacuation maps. They found out that mixed information locations (i.e. legend and labels) require an extensive understanding, association and storage, whereas locations with unusual information should be shown using a cartographic representation that map users are familiar to.
Accordingly, subject responses (e.g. reaction times, response accuracy) to map stimuli have been systematically collected, analyzed, and compared in several controlled user studies (e.g. Garlandini & Fabrikant, Citation2009; Keskin, Citation2020; Kettunen, Citation2014; Ooms, Citation2012).
To make cartographic representation more understandable, we need to relate the geometric principles to cognitive processes. The links between geometry and cognition should be described as a central factor in map design. The efficiency of a cartographic representation’s design is judged by its understandability. The visual variables that will be utilized in map design can be chosen, for example, using Shneiderman’s (Citation2002) visual information mantra strategy: overview first, zoom and filter, details on demand. This leads to thinking about the user interaction and how it should be designed for maps. Development of an interactive and analytical mapping system is divided into two intertwined domains: the behavioral domain, which represents the user’s perspective and interaction with the system, and the construction domain, which represents the system developer’s perspective and the entire system. An explorative map, by serving as a presentation medium, an interface, and a thinking tool, allows its users to visually confirm or originate ideas, discover hidden concepts, and add value to a geodatabase. As suggested within Bloom’s (Citation1956) taxonomy; when a user is exposed to a geodatabase at maximum, (s)he aims to acquire the highest possible degree of intelligence order of ‘knowledge – comprehension – application – analysis – synthesis – judgment’. Exploratory interaction is a two-way information gathering process, and the greater the user freedom when using explorative maps (e.g. during geoexploration), the higher learning effort and risk of ‘getting lost’ due to limitless design possibilities. This characteristic of exploratory maps makes it difficult to facilitate them for one-time use as well as to measure their usability since the knowledge discovery tasks and goals are mostly not well defined or limited and require qualitative assessment (Meng & Reichenbacher, Citation2005).
For successful geospatial technology design, consideration of the user experience is essential. There are various kinds of interaction such as command-line interfaces, graphical user interfaces (GUIs), menu selection and forms, pointers (e.g. mouse, touchpad or screens, light pens), speech, and gestures (Wardlaw, Citation2010). The schematization of geographical information for efficient communication, as well as the cognitive processes included in the interaction between maps and map users, has been a subject of several cartographic usability experiments (e.g. Flink et al., Citation2011; Nivala et al., Citation2008). Therefore, the question arises: How will the users interact with the map since there are quite many visual design elements to take into consideration? One of the most applied types of interaction is selection, in other words, highlighting or brushing (e.g. Fuchs et al., Citation2009). Interactive visual analysis (IVA) enables users to make flexible selections by depicting various activities or data items using multiple views, allowing the user to interactively select (brush) a subset of data in the visual scene and view the corresponding attribute information as well. The ‘curse of dimensionality for IVA’ might complicate reasoning when many attribute dimensions are available (Fuchs et al., Citation2009). However, this issue can be overcome by incorporating machine learning algorithms into interactive map design. In Section 4, we will present the research on machine learning in geospatial domain and its potential use for cartographic interaction.
2.2. The influence of individual characteristics on spatial cognition
Within the rapidly personalized digital era, it is important to design any kind of product with a possibility for customization based on user actions and preferences. Similarly, while creating map interfaces, the spatial cognition abilities and limitations of individuals shall be considered. On the contrary of allocentric design, egocentric (self-centered) design can be seen as a typical personalization method, embedding individual user profiles as the ego center on the map. Map usability is measured by counting on the pragmatic requirements that are objective, relatively easy to measure, and purpose- oriented (e.g. the effectiveness and efficiency of using maps). It can also be measured by hedonistic requirements that are subjective, vague, and not related to the purpose of the map (e.g. users’ emotions in the process of interacting with the map, such as joy or anger) (Meng, Citation2005). For example, egocentric design can be realized by tracking individuals’ gaze activity and modifying the display accordingly. In this context, effectiveness is linked with issues such as whether map content matches the user expectations, the map symbols are understood by the user, or the interaction is handled with the expected degree of performance. On the other hand, efficiency is associated with the time spent to successfully complete the operation such as searching, comparing, navigating, or the price of the service compared to its performance, and so on (Meng, Citation2005).
In recent years, cartographers have extensively studied human factors affecting spatial cognition. When dealing with geovisualizations, it is evident that the performance and preferences of user groups vary based on their individual characteristics (e.g. age, gender, expertise, education, and cultural background) (e.g. Allen, Citation2020; Montello & Freundschuh, Citation2005; Palka et al., Citation2018). However, neither cartographers, nor psychologists or neuroscientists fully understand all aspects that influence human behavior. The variety of individual traits can lead cartographers to focus more on personalized designs by characterizing users as, for example, one-time user, first-time user, returning user, and expert user. Consequently, machine learning methods can be applied to assess user performance simultaneously and modify the map design according to their unique performance. Treating individuals differently can improve the usability of cartographic designs (Raubal, Citation2009; Richter et al., Citation2015). Several studies focus on the influence of individual differences on the cognitive procedures of information extraction from maps such as visual search, spatial memory, wayfinding, and so on. For instance, Kulhavy and Stock (Citation1996) examined the effect of general map knowledge on map learning, whereas Keskin et al. (Citation2018) explored the influence of expertise on the memorability of the main structuring map elements (see also Ooms et al., Citation2015; Thorndyke and Stasz, Citation1980). It is evident that throughout the years, cartographers have striven to build know-how about how individual differences affect map users’ spatial cognition based on empirical research. However, there is still a need for a systematic understanding and structuring of human factors.
In addition to the characteristics of maps and their readers, time- and environment-related factors of the map reading situation have an impact on spatial understanding. Such social factors as being in a supervised experiment (Kettunen & Oksanen, Citation2019), acting in a group (Slocum et al., Citation2001) or being surrounded by traffic (Miura, Citation2016) affect the cognitive capabilities and performance of map readers. Unlikely of commonly referred laboratory conditions, constantly changing conditions of nature such as weather and lighting also have immense reflections on map reading and user experience. However, their effects typically are not counterbalanced while designing geovisualizations and cartographic user experiments.
3. Eye tracking for cartographic user experience
To measure both the influence of map design elements, visual parameters (see Section 2.1), and individual characteristics (see Section 2.2) on spatial cognition, eye tracking is a very straightforward quantitative method. It allows the tracking the movements of the participant’s eyes (i.e. point of regard, POR) that are registered at a certain sampling rate (Duchowski, Citation2017; Holmqvist et al., Citation2011). It can be used to observe users’ attentional behavior towards a map design (see Section 3.1) or to enable interaction with it (see Section 3.2).
3.1. Use of eye tracking to observe user behaviors
Understanding how people perceive indeed helps us design better maps and other spatial representations. Hence, studying eye movement behavior allows for improving existing cognitive models as well as creating new ones to identify and predict human behavior in space and their spatial reasoning. Eye tracking is widely used for measuring visual attention and cognitive processes through several spatio-temporal tasks on maps and geovisualizations (Kiefer et al., Citation2017).
For example, Putto et al. (Citation2014) investigated the effect of different visualizations of elevation information on eye movements during map-reading tasks, such as visual search, area selection, and route planning on static 2D maps. On the other hand, Çöltekin et al. (Citation2010) investigated whether user efficiency can be defined by a specific event sequence of interaction, and how these user strategies can be integrated to improve dynamic display designs and user interaction. Göbel et al. (Citation2019) presented a framework that allows for automatically logging cartographic features that have been inspected while users perform free exploration, focused search, and route planning (with interaction) tasks with digital interactive maps.
However, based on the literature, we notice that the eye tracking research in cartography has focused mostly on the usability experiments where eye movement data is captured during different map-reading tasks and has discussed how this gained insight about user behavior can be integrated into map design. However, eye tracking has rarely been utilized as a tool to interact with geovisualizations.
3.2. Use of eye tracking for gaze-based interaction
Gaze-based interaction is gradually penetrating our daily lives through video games, public displays, wearables, mobile applications and even social media filters. There are two types of gaze-based interactions used in HCI research: implicit and explicit (Rudi et al., Citation2020). Explicit techniques use gaze as a pointer and eye fixations or movements as pursuits to trigger an interaction between the user and the visual display. Controlling the interfaces with eye movements for interactions, such as zoom, pan, and select, can be given as examples of types of interaction. In fact, there are systems facilitating real- time interaction with gaze-based interfaces that correlate eye pursuit movements with dynamic objects without prior knowledge or preparation phase such as calibration (e.g. Vidal et al., Citation2013). Similarly, gaze-aware interactive map displays that demand less cognitive effort from their users can be designed to increase the level of interaction.
Implicit gaze-based interaction methods record and interpret the user’s visual attention and use this input to predict the information requirements of users, and adapt the interface accordingly (Rudi et al., Citation2020). This approach is used to building smart systems in which machines and humans work as a team to achieve a common goal that is to increase users’ understanding of the content and accordingly their performance while using the system. One of the rare examples of implicit gaze-aware interaction is Intention-Aware Gaze-Based Assistance on Maps in which gaze is used to create smooth interface adaptations (Göbel, Citation2021). This system aims at recognizing users’ activities and intentions from visual attention derived from gaze data while interacting with maps, then triggering map adaptation.
Furthermore, eye tracking can be combined with other methods for enabling smooth interactions. For example, Jokinen et al. (Citation2021) developed a model that creates realistic finger and eye movement simulations and shows human-like adaptation for interface development and evaluated touchscreen keyboard designs of mobile phones. Such systems contribute to establishing theories of usability and design. Similarly studying and modelling how users interact with geovisualizations provides the basis for our vision in assembling this review article and can lead to efficient design paradigms and reading support techniques in geovisualization and cartography. On the other hand, Jokinen et al.’s (Citation2021) model is based on Fitts’ law, which is a predictive model of human movement primarily used in HCI and ergonomics, Adaptive Control of Thought-Rational cognitive architecture, ability-based model, and optimal control model relying on Markov Decision Process which is implemented via reinforcement learning. Reinforcement learning (not included in this literature review), is a different paradigm than supervised and unsupervised learning and defined as the process of teaching machine learning models to make a series of judgments (Otterlo & Wiering, Citation2012). Next chapter, we detail machine learning and its use in geospatial domain.
4. Machine learning applied to geospatial data
Machine learning can serve both to process geospatial data and to increase the interactivity of the cartographic products, for example, by revealing spatial patterns and relationships through effective geovisualization strategies. It can introduce new analytical views for map reading by including structure, hierarchy, and dynamic interfaces to maps. Based on user interaction, the data can be revisualized, e.g. emphasizing the roads with star-like configurations, selecting/highlighting urban green spaces adjacent to water bodies, etc. In this section, we first give a brief introduction on machine learning, and then focus on its usage in vector geospatial data processing.
4.1. GeoAI
To understand structures and patterns in complex geospatial data, it is common to incorporate data mining (for further reading see (Han et al., Citation2011)), knowledge discovery databases (KDD), and visualization methods. Koua and Kraak (Citation2004) explained that the KDD framework can be implemented into geovisualizations through computational and visual analysis methods. Based on information visualization and cartographic visualization techniques, derived structures and patterns can be displayed as graphical representations to allow for gaining insight into the data as well as assessing, filtering, and mapping outputs, which results in a better understanding of geographical processes (Koua & Kraak, Citation2004). Recently artificial intelligence (AI) has brought new challenges and opportunities to geospatial research and therefore, a term called geospatial AI (i.e. GeoAI) was born.
GeoAI can be regarded as a study subject to develop intelligent computer programs to mimic the processes of human perception, spatial reasoning, and discovery about geographical phenomena and dynamics; to advance our knowledge; and to solve problems in human environmental systems and their interactions, with a focus on spatial contexts and roots in geography or geographic information science (GIScience). (for more detail, please read Gao, Citation2021)
Janowicz et al. (Citation2020) outlined GeoAI methods for geographic knowledge discovery, spatially explicit model production, question answering, and social sensing.
Concerning the applications in the geospatial domain, it can be noted that: in machine learning, a human being handles feature extraction, and a machine does the classification, whereas, in deep learning (or deep neural networks), both feature extraction and classification are handled by machines, which makes deep learning self- teaching similarly to humans.
A neural network, which imitates the decision-making processes in the human brain and makes computers act like interconnected human brain cells, can be taught to recognize visual stimuli such as maps, and classify them according to elements they contain. The first artificial neural network (ANN) was introduced by psychologist Rosenblatt (Citation1958) to model the visual data processing and object recognition processes in the human brain. In the simplest form, an ANN should have at least three layers to be called a deep neural network: (i) an input layer, (ii) an output layer, and a hidden layer (Basheer & Hajmeer, Citation2000). ANN is ideal for geographical analysis of large, noisy, non- ideal, and complex datasets in which the relationships are unclear or even hidden, due to its ability to perform pattern recognition and classification (Koua & Kraak, Citation2004).
LeCun et al. (Citation1989) established the modern framework of convolutional neural networks (CNNs) which are composed of neurons that self-optimize through learning. The neurons within CNN layers are organized into three dimensions; height, width, and depth and there are three types of layers; convolutional, pooling, and fully connected. The convolutional layer, which includes several kernels to compute different feature maps, learns feature representations of the inputs, for instance, the new feature map can be achieved by first convolving the input with a learned kernel, which is shared by all spatial locations of the input, and then applying an element-wise nonlinear activation function on the convolved results. The pooling layer that is usually placed between two convolutional layers reduces the resolution of the feature maps. One or more fully connected layers in which high-level reasoning is performed remain as a result of many convolutional and pooling layers. To generate global semantic information, unlike in standard ANN, each neuron of a feature map of the current layer is connected to a region of neighboring neurons in the previous layer. The entire network including the input raw image vectors and the final output of the class score expressed a single perceptive score function (the weight) and the last layer contains loss functions regarding the classes. CNN allows image-specific features to be encoded in the architecture, which makes the network better suited for image-focused tasks as decreasing the number of parameters needed to build up the model (Gu et al., Citation2018; O’Shea & Nash, Citation2015).
Graph convolutional neural networks (GCNN) are one of the most frequently used ANN methods for spatial data. Bruna et al. (Citation2014) and Henaff et al. (Citation2015) introduced GCNNs as a result of signal processing and spectral graph theory. There are several methods of GCNN; however, Kipf and Welling (Citation2017) described a GCNN formulation that has faster training periods and greater prediction accuracy and is recently being used in a variety of applications (Pope et al., Citation2019) as well as for the geospatial domain. For instance, Zhang et al. (Citation2022) constructed an object-based classification framework of remote sensing images using GCNN and achieved 97.2% overall accuracy for automatic object segmentation and 66.9% for manual object segmentation circumstances. He et al. (Citation2020) proposed a model called RoadTagger which is an end-to-end architecture combining both CNN and GCNN to infer road attributes such as lane count and road type from satellite imagery. Ma et al. (Citation2021) provided an end-to-end feature extraction framework, which is less sensitive to data distribution and computational powers compared to traditional CNN by using dynamic point-wise convolutional operations in multiple scales. Their method empirically achieved state-of-the-art semantic segmentation performance in feature representativeness, segmentation accuracy, and technical robustness.
Additionally, self-organizing map (SOM) neural network caught particular attention in the geo-domain, as it is a powerful tool to organize complex information spaces, to create abstractions where the underlying relationships are unclear, or classes of interest are not explicit (Koua & Kraak, Citation2004). Because outcomes of most SOMs are primarily two-dimensional, cartographers and others involved in geographic visualization can easily see them being integrated into interactive visualization settings. Those who are having trouble communicating the outcomes of sophisticated computational techniques to policy makers and the general public may find SOMs to be particularly helpful in a variety of situations (Skupin & Agarwal, Citation2008). Koua and Kraak (Citation2004) explained that SOM can be used as a data mining tool to project input data into a different measurement space based on similarities and relationships in the data that can help with pattern detection. Compared to the original attribute space, similarity space allows for better outcomes, e.g. search for structures in the multi-dimensional input, as SOM adapts its internal structures to multidimensional input structural qualities including regularities, similarities, and frequencies. Agarwal and Skupin (Citation2008) provided some diverse applications of SOM in GIS., e.g. visual exploration of spatial interaction using flow data (Yan & Thill, Citation2008), visualizing human movement (Skupin, Citation2008) or climate modelling (Hewitson, Citation2008).
4.2. Special focus on vector data processing
Even though machine learning methods have become a significant part of scientific research in many disciplines, these tools might still fail to perform pattern analysis and knowledge mining with vector data. This is because such data can often only be modeled as graph structures and typically not as more common grid-like, array, or raster structures (Yan et al., Citation2019). Therefore, there have been fewer applications for vector data compared to the use of deep learning algorithms processing the raster data. We list some of the deep learning research performed for vector data in the geospatial domain as follows:
Veer et al. (Citation2019) compared the accuracy of deep learning models (i.e. CNN, Long- Short Term Memory (LSTM) as Recurrent Neural Net (RNN) architecture) against baselines of shallow learning methods (i.e. K-nearest neighbor classifier; Logistic regression, Support Vector Machine (SVM) with Radial Basis Function (RBF) kernel, Decision tree classifier) for vector data classification tasks without rasterization of the geometry data. In terms of performance, this research shows that deep learning methods are competitive with the shallow learning methods and favors CNN over LSTM.
Yan et al. (Citation2019) proposed a GCNN architecture to analyze graph-structured vector geospatial data for a building pattern classification task in which grouped buildings were modeled as graphs whose pattern features are directly extracted by labeled training data, and indices for the characteristics of individual buildings were investigated to collect the input variables. They confirmed that GCNN is successful in identifying regular and irregular building patterns and considerably superior over existing methods for the analysis of graph-structured vector geospatial data.
Hu et al. (Citation2021) introduced a geo-semantic analysis framework to model the relationship between traffic interaction and urban functions at the road segment level by using GCNN which takes the contextual and topological information into account to classify social functions along streets. Their results confirmed relatively less loss and higher accuracy, compared to other methods of road pattern extraction.
Sester (Citation2008) applied SOM for a typification task to reduce the number of objects for presentation on a smaller scale while preserving their spatial distribution and density. In this context, with its characteristic of approximating the density in the input space, SOM represents the areas with many stimuli with many neurons and the areas with fewer objects in the input space with fewer neurons. SOM can be used for either linear or areal vector features. For instance, Sen et al. (Citation2014) implemented the SOM method for the selection process within hydrographic model generalization and as a result, stream density and pattern were maintained in each subunit, and continuous and semantically correct networks were obtained. For collapsing areal objects while preserving topological relationships, Haunert and Sester (Citation2008) introduced the straight skeleton algorithm which is a powerful tool for the derivation of linear representations for polygons with high flexibility.
Heinzle and Anders (Citation2007) and Heinzle et al. (Citation2007) used the stroke approach (i.e. single source shortest path algorithm) to automatically detect patterns in road networks with linear, cellular, and radial configurations. This approach seems useful for inferring implicit information, such as topological connections, relations between elements, and configurations of geometric features, which are not explicitly stored in GIS. Therefore, an automated enrichment of GIS with new geometric and thematic information contributes to the usability of GIS.
It not a straightforward task to select the correct machine learning algorithm or method but answering the following questions helps make a decision: (i) is the input data labeled or unlabeled? (ii) is the research problem well-defined or will the algorithm need to predict new problems? (iii) what is the dimensionality of the algorithms (e.g. number of features, attributes, or characteristics) and can they support the input data? (CitationIBM Blog). We contemplate that unsupervised clustering algorithms would be useful for obtaining patterns and relationships within vector geospatial data that lacks labels or attribute information, therefore unknown to its users. Once this information is acquired via the selected method, it can facilitate the data interpretation if geospatial content is revisualized based on the vector characteristics or geometries of the data.
5. Discussion and outlook
The motivation for this paper is to identify the remaining challenges in cartographic usability research that should be tackled to improve human–computer interaction during geoexploration and similar map reading processes. Therefore, we strive to find new means to make sense of unknown geospatial data by leveraging cutting-edge technologies such as eye tracking and machine learning. In this context, we focused on research questions about user-centered geovisualization and interaction to facilitate spatial understanding of confusing and unknown geospatial data (see Research Questions in Section 1). Overall, we see that combining human-driven attention from eye tracking and the data-driven AI classification of geospatial data brings the insights from both human and machine processing together for added human understanding. We first list what we have learned from the literature review:
Interaction with geospatial data through eye movements, in other words, utilizing gaze as an interactive tool, is promising for future map systems such as GAIMS. Therefore, the technical and methodological challenges for designing such systems must be tackled in depth and more implementations must be developed.
Users are a central and active part of cartographic design and the usability cycle, not a passive component of those. The behavioral input from them (i.e. eye movements) holds a great potential to change the ways of interacting with geospatial data. Map users can be enabled to steer the geovisualization with gaze so that it would bebe tailored to their individual cognitive behavior. In other words, map design can be personalized based on the time and attention a user spends. This way it might become possible to better understand geospatial content without prior/additional information or overly heavy mental efforts.
Both deep learning algorithms summarized within this paper (e.g. SOM, GCNN) and the methods used for cartographic generalization of line and polygon features can be combined to efficiently extract vector features. However, vector geospatial data processing is still a challenge in machine learning, and it has not been studied enough either in geospatial or other related domains. According to the reviewed literature, we can conclude that there is no straightforward solution that fits all map applications. It is obvious that more research is needed in this field, especially interdisciplinary information exchange is essential.
We next highlight the remaining challenges to be tackled for designing gaze-aware interactive geovisualizations (e.g. Keskin & Kettunen, Citation2021), and finally present future perspectives.
5.1. Remaining challenges
The integration of eye tracking and machine learning is indeed not straightforward and raises new challenges as well. We classify these challenges in two folds: (1) related to system design, and (2) related to the implementation of the methodology:
Modifying map design based on eye movements and how they can be implemented in the system are challenges related to experimental design. Such interactive map system should not only learn from and adapt to users’ gaze behavior but also modify the geovisualization using deep learning algorithms in real or semi-real time. In this context, optimization or tuning of visual variables is one of the primary design concerns. If we consider highlighting as an interaction, we must decide, for instance, whether we highlight map features by using the same color, or their corresponding conventional color scheme. Furthermore, the design choices must be made whether the line width of revisualized features will be the same throughout the whole map or if different values of visual variables will be assigned to each map feature class. These decisions are important due to each visual variable and their different values have a different effect on spatial understanding (e.g. Keskin et al., Citation2018). It should be noted that utilizing eye tracking as an interaction tool introduces some challenges such as precision and Midas Touch Effect (Jacob, Citation1990). First, a fixation is less precise than mouse tracking due to the area of a fixation being rather large (about 1°). Second, users might unintentionally trigger and act with eye movements. Therefore, it is important to take dwell time or additional eye gestures into account while designing such gaze-based interaction (Göbel, Citation2021).
Providing revisualized (highlighted) map designs based on users’ eye movement data in real-time or semi-real time is a performance-related issue that can be tackled in two folds. First, the selected geospatial dataset should be suitable in terms of its size and variety of features it includes to extract lines or polygons that are of interest (e.g. in this context, one must consider not only the training dataset but also the test and validation datasets for machine learning). Later, the amount of collected eye movement data should suffice to characterize users’ gaze behavior as this data will be utilized for the highlighting procedure.
5.2. Future perspectives
Combining machine learning and eye tracking is promising in terms of improving the usability of geovisualizations. Forecasting the emerging technological developments, we can envision a system that is a combination of the state-of-the-art of present and future solutions (e.g. Keskin & Kettunen, Citation2021). It is not the scope of this article, but this research can also be extended from static 2D maps towards multi-dimensional dynamic map displays or using mobile eye tracking in real-life conditions, the attention towards dynamic areas of interest in the visual scene can be studied. Furthermore, other types of interactions might be integrated, such as enabling touch and eye tracking simultaneously (Jokinen et al., Citation2021) or enriching gaze-based interaction with audio (Kwok et al., Citation2019). However, we should always bear in mind the behavioral and ethical problems that this type of continuous data collection arises and this requires dedicated research.
It is worth mentioning that to develop interactive, adaptive and personalized geovisualizations, a multidisciplinary approach and collaborative efforts of disciplines are needed. Besides the knowledge and principles existing within geosciences and cartography, theories and methods from psychology, computer sciences, cognitive and neuroscience, UX/UI design, and HCI must be brought together. Creating a common body of knowledge should be encouraged because these disciplines might have similar problems as we, cartographers do, and even readily available solutions for them. Often the case is that different disciplines use different terminology, but we need to form a common language.
To be integrated with functions of machines, people's conceptual representations must be formalized. In terms of conceptualizations and reasoning processes, the closer the system's view is to the user's vision, the more likely the system is to successfully facilitate human–computer interaction and give cognitively adequate responses to the users’ spatio-temporal challenges. Different viewpoints on the nature of conceptual representations in the human cognitive system have resulted in several formal methods to cognitive modelling, as well as representation and processing of geographic knowledge. This has, among other things, raised a question of whether a hybrid spatial cognitive model exists that encompasses ‘the entire ground,’ and if so, what its components are (Raubal, Citation2009). This persisting question should always be kept in mind when designing such systems in the future.
6. Summary
Within this article, we reviewed possibilities on creating interactive geovisualization and map systems for exploring geospatial data that is confusing or unknown for its user. Our focus was on the potential uses of eye tracking and on the aids that machine learning can bring to the geoexploration in the form of geospatial data classification. We covered relevant literature on geoexploration and geovisualization as well as human–computer interaction and GeoAI. The review illustrates that interactive eye-tracker systems are in their advent and probably fit well into geoexplorative use when further developed. Careful consideration of the users’ needs and behavioral characteristics in reading geovisualizations will be essential for such systems in future, which calls for further research on these topics. Eye tracking interaction can be essentially facilitated with machine learning approaches on confusing or unknown geospatial data, particularly on vector geometries and attributes that have not been thoroughly considered in the GeoAI thus far. Consequently, future implementations of gaze-adaptive maps can provide users with more satisfying map-reading experiences with more useful spatial knowledge learned.
Acknowledgments
This research is funded by the Finnish Scientific Advisory Board for Defence (MATINE) through the TUGEVA project.
Disclosure statement
No potential conflict of interest was reported by the author(s).
Additional information
Notes on contributors
Merve Keskin
Merve Keskin, D.Sc., is a senior research scientist specialized in cognitive cartography, cartographic user experiment design, HCI/UX/UI principles, neuroscientific user testing methods (i.e. eye tracking, EEG), and GIS (i.e. visualization, map design, data management, geostatistical analysis, classification). She obtained her doctoral degree in geomatics engineering in 2020 within the frame of a joint-PhD agreement between Ghent University (UGent) and Istanbul Technical University (ITU) with a thesis titled ‘Exploring the Cognitive Processes of Map Users Employing Eye Tracking and EEG’ in which she focused on the learning and recall strategies of expert and novice map users. Her doctoral thesis was awarded as the most successful thesis of the year by ITU. As a part of her PhD studies, she had an opportunity to work in a multicultural and interdisciplinary environment (e.g. experimental psychology, marketing, information and communication technologies, etc.). She is currently working as a post-doc researcher in Geospatial Representation and Interaction research group at the Department of Geoinformatics and Cartography at FGI/NLS.
Pyry Kettunen
Pyry Kettunen, D.Sc. (Tech.), acts as a Research Manager and Group Leader at the FGI-GEOINFO, leading the group of Geospatial Representation and Interaction that has consisted of ten researchers at several career stages from bachelor's thesis makers to post-doctoral researchers. Kettunen has received funding for and successfully lead work in several research and development projects in national and international contexts, for instance, NTDB Generalisation for the National Land Survey of Finland, FGI research in the BASMATI project for the EU BONUS programme, and the TUGEVA project for the Finnish Scientific Advisory Board for Defence (MATINE). He has taken part in more than a dozen of such projects as a researcher and developer. Kettunen has authored and co-authored more than 70 articles and papers on his and co-researchers’ scientific research, mainly concentrated on spatial cognition of landmarks, wayfinding and map reading, web maps, geospatial user interfaces, and cartographic data and visualization. He has reviewed actively for scientific journals and conferences and belongs to several such review boards and committees. Kettunen has vice-chaired two commissions of the global International Cartographic Association since 2011 and chairs the Finnish ProGIS association.
References
- Agarwal, P., & Skupin, A. (2008). Self-organising maps: Applications in geographic information science. Wiley.
- Allen, G. L. (2020). Applied spatial cognition: From research to cognitive technology. Psychology Press.
- Andrienko, G. L., & Andrienko, N. V. (1999). Interactive maps for visual data exploration. International Journal of Geographical Information Science, 13(4), 355–374. https://doi.org/10.1080/136588199241247
- Andrienko, N., Andrienko, G., Adilova, L., Wrobel, S., & Rhyne, T.-M. (2022). Visualanalytics for human-centered machine learning. IEEE Computer Graphics and Applications, 42(1), 123–133. https://doi.org/10.1109/MCG.2021.3130314
- Basheer, I. A., & Hajmeer, M. (2000). Artificial neural networks: Fundamentals, computing, design, and application. Journal of Microbiological Methods, 43(1), 3–31. https://doi.org/10.1016/S0167-7012(00)00201-3
- Basole, R. C., Stork, A., & Basole, R. C. (2019). Visualization 4.0. IEEE Computer Graphics and Applications, 39(6), 8–16. https://doi.org/10.1109/MCG.2019.2937475
- Bertin, J. (1967). Semiology of graphics (translation by WJ berg 1983). University of Wisconsin Press.
- Bloom, B. S. (1956). Taxonomy of educational objectives. Vol. 1: Cognitive domain. McKay. 20(24), 1.
- Bruna, J., Zaremba, W., Szlam, A., & LeCun, Y. (2014). Spectral networks and locally connected networks on graphs. ArXiv:1312.6203 [Cs]. http://arxiv.org/abs/1312.6203.
- Choi, D., Shah, C., & Singh, V. (2016). Probing the interconnections between geo-exploration and information exploration behavior. In Proceedings of the 2016 ACM international joint conference on pervasive and ubiquitous computing (pp. 1170–1175).
- Çöltekin, A., Bleisch, S., Andrienko, G., & Dykes, J. (2017). Persistent challenges in geovisualization – a community perspective. International Journal of Cartography, 3(sup1), 115–139. https://doi.org/10.1080/23729333.2017.1302910
- Çöltekin, A., Fabrikant, S. I., & Lacayo, M. (2010). Exploring the efficiency of users’ visual analytics strategies based on sequence analysis of eye movement recordings. International Journal of Geographical Information Science, 24(10), 1559–1575. https://doi.org/10.1080/13658816.2010.511718
- Çöltekin, A., Janetzko, H., & Fabrikant, S. (2018). Geovisualization. Geographic Information Science & Technology Body of Knowledge. Q2. https://doi.org/10.22224/gistbok/2018.2.
- Ding, P., Zhang, Y., Deng, W.-J., Jia, P., & Kuijper, A. (2018). A light and faster regional convolutional neural network for object detection in optical remote sensing images. ISPRS Journal of Photogrammetry and Remote Sensing, 141, 208–218. https://doi.org/10.1016/j.isprsjprs.2018.05.005
- Duchowski, A. T. (2017). Eye tracking methodology: Theory and practice. Springer.
- Eidelman, S., & Crandall, C. S. (2009). A psychological advantage for the status quo. In J. T. Jost, A. C. Kay & H. Thorisdottir (Eds.), Social and psychological bases of ideology and system justification (pp. 85–106). Oxford University Press.
- Fabrikant, S. I., Hespanha, S. R., & Hegarty, M. (2010). Cognitively inspired and perceptually salient graphic displays for efficient spatial inference making. Annals of the Association of American Geographers, 100(1), 13–29. https://doi.org/10.1080/00045600903362378
- Flink, H.-M., Oksanen, J., Pyysalo, U., Rönneberg, M., & Sarjakoski, L. T. (2011). Usability evaluation of a map-based multi-publishing service. In A. Ruas (Ed.), Advances in cartography and GIScience (Volume 1, pp. 239–257). Springer.
- Fuchs, R., Waser, J., & Groller, M. E. (2009). Visual human+machine learning. IEEE Transactions on Visualization and Computer Graphics, 15(6), 1327–1334. https://doi.org/10.1109/TVCG.2009.199
- Gao, S. (2021). Geospatial artificial intelligence (GeoAI). Oxford University Press.
- Garlandini, S., & Fabrikant, S. I. (2009). Evaluating the effectiveness and efficiency of visual variables for geographic information visualization. In K. S. Hornsby, C. Claramunt, M. Denis, & G. Ligozat (Eds.), Spatial information theory (Volume 5756, pp. 195–211). Springer. https://doi.org/10.1007/978-3-642-03832-7_12.
- Göbel, F. (2021). Visual attentive user interfaces for feature-rich environments [Doctoral Thesis], ETH Zurich. https://doi.org/10.3929/ethz-b-000513243.
- Göbel, F., Kiefer, P., & Raubal, M. (2019). Featureyetrack: Automatic matching of eye tracking data with map features on interactive maps. GeoInformatica, 23(4), 663–687. https://doi.org/10.1007/s10707-019-00344-3
- Göbel, F., Kurzhals, K., Schinazi, V. R., Kiefer, P., & Raubal, M. (2020). Gaze-adaptive lenses for feature-rich information & spaces. ACM Symposium on Eye Tracking Research and Applications (pp. 1–8). https://doi.org/10.1145/3379155.3391323.
- Gu, J., Wang, Z., Kuen, J., Ma, L., Shahroudy, A., Shuai, B., Liu, T., Wang, X., Wang, G., Cai, J., & Chen, T. (2018). Recent advances in convolutional neural networks. Pattern Recognition, 77, 354–377. https://doi.org/10.1016/j.patcog.2017.10.013
- Han, J., Pei, J., & Kamber, M. (2011). Data mining: Concepts and techniques. Elsevier.
- Haunert, J.-H., & Sester, M. (2008). Area collapse and road centerlines based on straight skeletons. GeoInformatica, 12(2), 169–191. https://doi.org/10.1007/s10707-007-0028-x
- He, S., Bastani, F., Jagwani, S., Park, E., Abbar, S., Alizadeh, M., Balakrishnan, H., Chawla, S., Madden, S., & Sadeghi, M. A. (2020). Roadtagger: Robust road attribute inference with graph neural networks. Proceedings of the AAAI Conference on Artificial Intelligence, 34(07), 10965–10972. https://doi.org/10.1609/aaai.v34i07.6730
- Hegarty, M., Montello, D. R., Richardson, A. E., Ishikawa, T., & Lovelace, K. (2006). Spatial abilities at different scales: Individual differences in aptitude-test performance and spatial-layout learning. Intelligence, 34(2), 151–176. https://doi.org/10.1016/j.intell.2005.09.005
- Heinzle, F., & Anders, K. H. (2007). Characterising space via pattern recognition techniques: identifying patterns in road networks. In Generalisation of geographic information (pp. 233–253). Elsevier Science BV. https://doi.org/10.1016/B978-008045374-3/50014-4
- Heinzle, F., Anders, K. H., & Sester, M. (2007, June). Automatic detection of pattern in road networks-methods and evaluation. In J. Schiewe & M. Hahn (Eds.), Proc. of joint workshop visualization and exploration of geospatial data, Stuttgart, Germany, 27–29 June 2007. www.isprs.org/proceedings/XXXVI/4-W45/PDF/21_Heinzle.pdf
- Henaff, M., Bruna, J., & LeCun, Y. (2015). Deep convolutional networks on graph-structured data. ArXiv:1506.05163 [Cs]. http://arxiv.org/abs/1506.05163.
- Hewitson, B. C. (2008). Climate analysis, modelling, and regional downscaling using self-organizing maps. In P. Agarwal & A. Skupin (Eds.), Self-organising maps: Applications in geographic information science (pp. 137–163). Wiley.
- Holmqvist, K., Nyström, M., Andersson, R., Dewhurst, R., Jarodzka, H., & Van de Weijer, J. (2011). Eye tracking: A comprehensive guide to methods and measures. OUP.
- Hu, S., Gao, S., Wu, L., Xu, Y., Zhang, Z., Cui, H., & Gong, X. (2021). Urban function classification at road segment level using taxi trajectory data: A graph convolutional neural network approach. Computers, Environment and Urban Systems, 87, 101619. https://doi.org/10.1016/j.compenvurbsys.2021.101619
- IBM Blog. Retrieved July 4, 2021, from https://www.ibm.com/cloud/blog/supervised-vs-unsupervised-learning
- Idreos, S., Papaemmanouil, O., & Chaudhuri, S. (2015). Overview of data exploration techniques. In Proceedings of the 2015 ACM SIGMOD international conference on management of data (pp. 277–281).
- Janowicz, K., Gao, S., McKenzie, G., Hu, Y., & Bhaduri, B. (2020). GeoAI: Spatially explicit artificial intelligence techniques for geographic knowledge discovery and beyond. International Journal of Geographical Information Science, 34(4), 625–636. https://doi.org/10.1080/13658816.2019.1684500
- Jäkel, F., Singh, M., Wichmann, F. A., & Herzog, M. H. (2016). An overview of quantitative approaches in gestalt perception. Vision Research, 126, 3–8. https://doi.org/10.1016/j.visres.2016.06.004
- Jacob, R. J. (1990, March). What you look at is what you get: eye movement-based interaction techniques. In Proceedings of the SIGCHI conference on human factors in computing systems (pp. 11–18). https://doi.org/10.1145/97243.97246
- Jokinen, J., Acharya, A., Uzair, M., Jiang, X., & Oulasvirta, A. (2021). Touchscreen typing As optimal supervisory control. In Proceedings of the 2021 CHI conference on human factors in computing systems (pp. 1–14). https://doi.org/10.1145/3411764.3445483
- Kahneman, D., Knetsch, J. L., & Thaler, R. H. (1991). The endowment effect, loss aversion, and status quo bias: Anomalies. Journal of Economic Perspectives, 5(1), 193–206. https://doi.org/10.1257/jep.5.1.193
- Keskin, M. (2020). Exploring the cognitive processes of map users employing eye tracking and EEG [PhD Thesis], Ghent University.
- Keskin, M., & Kettunen, P. (2021). Designing AI-assisted interactive map displays to explore spatial information. Abstracts of the ICA, 3, 1–2. https://doi.org/10.5194/ica-abs-3-148-2021
- Keskin, M., Ooms, K., Dogru, A. O., & De Maeyer, P. (2018). Digital sketch maps and eye tracking statistics as instruments to obtain insights into spatial cognition. Journal of Eye Movement Research, 11(3). https://doi.org/10.16910/jemr.11.3.4.
- Kettunen, P. (2014). Analysing landmarks in nature and elements of geospatial images to support wayfinding. Finnish Geodetic Institute.
- Kettunen, P., & Oksanen, J. (2019). Motion of animated streamlets appears to surpass their graphical alterations in human visual detection of vector field maxima. Cartography and Geographic Information Science, 46(6), 489–501. https://doi.org/10.1080/15230406.2018.1553113
- Kiefer, P., Giannopoulos, I., Raubal, M., & Duchowski, A. (2017). Eye tracking for spatial research: Cognition, computation, challenges. Spatial Cognition & Computation, 17(1–2), 1–19. https://doi.org/10.1080/13875868.2016.1254634
- Kipf, T. N., & Welling, M. (2017). Semi-supervised classification with graph convolutional networks. ArXiv:1609.02907 [Cs, Stat]. http://arxiv.org/abs/1609.02907.
- Knapp, L. (1995). A task analysis approach to the visualization of geographic data. In T. L. Nyerges, D. M. Mark, R. Laurini, & M.J. Egenhofer (Eds.), Cognitive aspects of human-computer interaction for geographic information systems (pp. 355–371). Springer.
- Koua, E. L., & Kraak, M.-J. (2004). Geovisualization to support the exploration of large health and demographic survey data. International Journal of Health Geographics, 13. https://doi.org/10.1186/1476-072X-3-12
- Kulhavy, R. W., & Stock, W. A. (1996). How cognitive maps are learned and remembered. Annals of the Association of American Geographers, 86(1), 123–145. https://doi.org/10.1111/j.1467-8306.1996.tb01748.x
- Kumar, B., Pandey, G., Lohani, B., & Misra, S. C. (2019). A multi-faceted CNN architecture for automatic classification of mobile LiDAR data and an algorithm to reproduce point cloud samples for enhanced training. ISPRS Journal of Photogrammetry and Remote Sensing, 147, 80–89. https://doi.org/10.1016/j.isprsjprs.2018.11.006
- Kwok, T. C. K., Kiefer, P., Schinazi, V. R., Adams, B., & Raubal, M. (2019). Gaze-guided narratives: Adapting audio guide content to gaze in virtual and real environments. Proceedings of the 2019 CHI Conference on Human Factors in Computing Systems (pp. 1–12). https://doi.org/10.1145/3290605.3300721.
- LeCun, Y., Boser, B., Denker, J., Henderson, D., Howard, R., Hubbard, W., & Jackel, L. (1989). Handwritten digit recognition with a back-propagation network. Advances in Neural Information Processing Systems, 2, 396–404.
- Leonard, T. C. (2008). Richard H. Thaler, Cass R. Sunstein, Nudge: Improving decisions about health, wealth, and happiness. Constitutional Political Economy, 19(4), 356–360. https://doi.org/10.1007/s10602-008-9056-2
- Ma, L., Li, Y., Li, J., Tan, W., Yu, Y., & Chapman, M. A. (2021). Multi-scale point-wise convolutional neural networks for 3D object segmentation from LiDAR point clouds in large-scale environments. IEEE Transactions on Intelligent Transportation Systems, 22(2), 821–836. https://doi.org/10.1109/TITS.2019.2961060
- MacEachren, A. (1992). Visualizing uncertain information. Cartographic Perspective, 13. https://doi.org/10.14714/CP13.1000
- MacEachren, A. M., & Kraak, M.-J. (1997). Exploratory cartographic visualization: Advancing the agenda. Computers & Geosciences, 23(4), 335–343. Elsevier https://doi.org/10.1016/S0098-3004(97)00018-6
- Meng, L. (2005). Ego centres of mobile users and egocentric map design. In L. Meng, T. Reichenbacher, & A. Zipf (Eds.), Map-based mobile services (pp. 87–105). Springer.
- Meng, L., & Reichenbacher, T. (2005). Map-based mobile services. In L. Meng, T. Reichenbacher, & A. Zipf (Eds.), Map-based mobile services: Theories, methods and implementations (pp. 1–10). Springer. https://doi.org/10.1007/3-540-26982-7_1
- Miura, K. (2016). Eye fixation tendency on wayfinding in street space with heavy traffic conditions: A study on the eye fixation in wayfinding in the streets of Roma (part 2). Journal of Architecture and Planning, 81(722), 959–969. https://doi.org/10.3130/aija.81.959
- Montello, D., & Freundschuh, S. (2005). Cognition of geographic information. In R. B. McMaster & E. L. Usery (Eds.), A research agenda for geographic information science. CRC Press.
- Morrison, J. L. (1974). A theoretical framework for cartographic generalization with the emphasis on the process of symbolization. International Yearbook of Cartography, 14(1974), 115–127.
- Nivala, A.-M., Brewster, S., & Sarjakoski, T. L. (2008). Usability evaluation of web mapping sites. The Cartographic Journal, 45(2), 129–138. https://doi.org/10.1179/174327708X305120
- Norman, D. A. (1986). User centered system design: New perspectives on human-computer interaction. Xiii, 186 p. : Col. Ill. Hillsdale, NJ: Lawrence Erlbaum Assoc. Includes Bibliography and Index. http://papers.cumincad.org/cgi-bin/works/Show&_id=caadria2010_044/paper/aec5.
- Ooms, K., De Maeyer, P., & Fack, V. (2015). Listen to the map user: cognition, memory, and expertise. The Cartographic Journal, 52(1), 3–19. https://doi.org/10.1179/1743277413Y.0000000068
- Ooms, K. (2012). Maps, how do users see them?: An in depth investigation of the map users’ cognitive processes [Dissertation], Ghent University. http://hdl.handle.net/1854/LU-3103344
- O’Shea, K., & Nash, R. (2015). An Introduction to Convolutional Neural Networks. ArXiv:1511.08458 [Cs]. http://arxiv.org/abs/1511.08458.
- Otterlo, M. V., & Wiering, M. (2012). Reinforcement learning and Markov decision processes. In M. Wiering & M. van Otterlo (Eds.), Reinforcement learning. Adaptation, learning, and optimization (pp. 3–42). Springer.
- Palka, G., Serrhini, K., & Andrieu, D. (2018). How evacuation maps work: Comparison of stakeholders’ visual strategies. International Journal of Cartography, 4(1), 25–48. https://doi.org/10.1080/23729333.2018.1434603
- Pope, P. E., Kolouri, S., Rostami, M., Martin, C. E., & Hoffmann, H. (2019). Explainability methods for graph convolutional neural networks. 2019 IEEE/CVF Conference on Computer Vision and Pattern Recognition (CVPR) (pp. 10764–10773). https://doi.org/10.1109/CVPR.2019.01103.
- Putto, K., Kettunen, P., Torniainen, J., Krause, C. M., & Tiina Sarjakoski, L. (2014). Effects of cartographic elevation visualizations and map-reading tasks on eye movements. The Cartographic Journal, 51(3), 225–236. https://doi.org/10.1179/1743277414Y.0000000087
- Raubal, M. (2009). Cognitive engineering for geographic information science: Cognitive engineering for geographic information science. Geography Compass, 3(3), 1087–1104. https://doi.org/10.1111/j.1749-8198.2009.00224.x
- Richter, K.-F., Tomko, M., & Cöltekin, A. (2015). Are we there yet? Spatial cognitive engineering for situated human-computer interaction. https://doi.org/10.5167/UZH-118002.
- Rosenblatt, F. (1958). The perceptron: A probabilistic model for information storage and organization in the brain. Psychological Review, 65(6), 386. https://doi.org/10.1037/h0042519
- Roth, R. E. (2017). Visual variables. In D. Richardson, N. Castree, M. F. Goodchild, A. Kobayashi, W. Liu, & R. A. Marston (Eds.), International encyclopedia of geography: People, the earth, environment and technology (pp. 1–11). John Wiley & Sons, Ltd. https://doi.org/10.1002/9781118786352.wbieg0761
- Rudi, D., Kiefer, P., Giannopoulos, I., & Raubal, M. (2020). Gaze-based interactions in the cockpit of the future: A survey. Journal on Multimodal User Interfaces, 14(1), 25–48. https://doi.org/10.1007/s12193-019-00309-8
- Samuelson, W., & Zeckhauser, R. (1988). Status quo bias in decision making. Journal of Risk and Uncertainty, 1(1), 7–59. https://doi.org/10.1007/BF00055564
- Sen, A., Gokgoz, T., & Sester, M. (2014). Model generalization of two different drainage patterns by self-organizing maps. Cartography and Geographic Information Science, 41(2), 151–165. https://doi.org/10.1080/15230406.2013.877231
- Sester, M. (2008). Self-organizing maps for density-preserving reduction of objects in cartographic generalization. In P. Agarwal & A. Skupin (Eds.), Self-organising maps: Applications in geographic information science (pp. 107–120). Wiley Online Library.
- Shneiderman, B. (2002). Inventing discovery tools: Combining information visualization with data mining. Information Visualization, 1(1), 5–12. https://doi.org/10.1057/palgrave.ivs.9500006
- Skupin, A. (2008). Visualizing human movement in attribute space. In P. Agarwal & A. Skupin (Eds.), Self-organising maps: Applications in geographic information science (pp. 121–135). Wiley.
- Skupin, A., & Agarwal, P. (2008). Introduction: What is a self-organizing map? In P. Agarwal & A. Skupin (Eds.), Self-organising maps: Applications in geographic information science (pp. 1–20). Wiley Online Library.
- Slocum, T. A., Blok, C., Jiang, B., Koussoulakou, A., Montello, D. R., Fuhrmann, S., & Hedley, N. R. (2001). Cognitive and usability issues in geovisualization. Cartography and Geographic Information Science, 28(1), 61–75. https://doi.org/10.1559/152304001782173998
- Thorndyke, P. W., & Stasz, C. (1980). Individual differences in procedures for knowledge acquisition from maps. Cognitive psychology, 12(1), 137–175. https://doi.org/10.1016/0010-0285(80)90006-7
- Tobii Concept Validation Tool. Retrieved September 8, 2021, from https://tech.tobii.com/get-started/
- Veer, R., van ‘t Bloem, P., & Folmer, E. (2019). Deep learning for classification tasks on geospatial vector polygons. ArXiv:1806.03857 [Cs, Stat]. http://arxiv.org/abs/1806.03857.
- Vidal, M., Bulling, A., & Gellersen, H. (2013). Pursuits: Spontaneous interaction with displays based on smooth pursuit eye movement and moving targets. Proceedings of the 2013 ACM International Joint Conference on Pervasive and Ubiquitous Computing (pp. 439–448).
- Wardlaw, J. (2010). Principles of interaction. In M. (Muki). Haklay (Ed.), Interacting with geospatial technologies (pp. 179–198). Wiley Online Library.
- Wertheimer, M. (1923). A brief introduction to gestalt, identifying key theories and principles. Psychologische Forschung, 4(1), 301–350. https://doi.org/10.1007/BF00410640
- Xu, F., Uszkoreit, H., Du, Y., Fan, W., Zhao, D., & Zhu, J. (2019, October). Explainable AI: A brief survey on history, research areas, approaches and challenges. In J. Tang, M. Y. Kan, D. Zhao, S. Li, & H. Zan (Eds.), CCF international conference on natural language processing and Chinese computing (pp. 563–574). Springer.
- Yan, J., & Thill, J.-C. (2008). Visual exploration of spatial interaction data with self-organizing maps. In P. Agarwal & A. Skupin (Eds.), Self-organising maps (pp. 67–85). Wiley Online Library.
- Yan, X., Ai, T., Yang, M., & Yin, H. (2019). A graph convolutional neural network for classification of building patterns using spatial vector data. ISPRS Journal of Photogrammetry and Remote Sensing, 150, 259–273. https://doi.org/10.1016/j.isprsjprs.2019.02.010
- Zhang, X., Tan, X., Chen, G., Zhu, K., Liao, P., & Wang, T. (2022). Object-based classification framework of remote sensing images With graph convolutional networks. IEEE Geoscience and Remote Sensing Letters, 19, 1–5. https://doi.org/10.1109/LGRS.2021.3072627