
 ?Mathematical formulae have been encoded as MathML and are displayed in this HTML version using MathJax in order to improve their display. Uncheck the box to turn MathJax off. This feature requires Javascript. Click on a formula to zoom.
ABSTRACT
Validation of physics models using the newly uncovered physics with a 2-D electron cyclotron emission imaging (ECEi) system for magnetic fusion plasmas has either enhanced the confidence or substantially improved the modeling capability. The discarded “full reconnection model” in sawtooth instability is vindicated and established that symmetry and magnetic shear of the 1/1 kink mode are critical parameters in sawtooth instability. For the 2/1 instability, it is demonstrated that the 2-D data can determine critical physics parameters with a high confidence and the measured anisotropic distribution of the turbulence and its flow in presence of the 2/1 island is validated by the modelled potential and gyro-kinetic calculation. The validation process of the measured reversed-shear Alfvéneigenmode (RSAE) structures has improved deficiencies of prior models. The 2-D images of internal structure of the ELMs and turbulence induced by the resonant magnetic perturbation (RMP) have provided an opportunity to establish firm physics basis of the ELM instability and role of RMPs. The importance of symmetry in determining the reconnection time scale and role of magnetic shear of the 1/1 kink mode in sawtooth instability may be relevant to the underlying physics of the violent kink instability of the filament ropes in a solar flare.
Graphical abstract
1. Introduction
The Magneto-hydro-dynamic (MHD) and Alfvénic instabilities in solar, space and laboratory plasmas have attracted researchers for many decades. These instabilities are closely associated with explosive events such as disruptions in tokamak plasmas [Citation1], coronal mass ejection (CME) in solar flares [Citation2], and geomagnetic storms [Citation3]. The physics of enhanced energy transport and disruptions induced by the MHD and Alfvénic instabilities in fusion plasma devices has been vigorously studied to achieve improved confinement and stability of the plasmas. The ultimate goals are to perfect theoretical models with a predictive capability and to achieve preemptive control of harmful instabilities. Such progress has been accelerated through a precise validation with multi-dimensional advanced imaging diagnostic systems in recent years. The synergy between theoretical modelings and multi-dimensional experimental constraints in the validation process is essential for physics understanding of complex plasma dynamics. For example, new findings in magnetic reconnection experiment with sophisticated multi-dimensional probe arrays in laboratories [Citation4,Citation5] have partly validated the physics of reconnection events in the solar flare and geomagnetic storms. Note that such probe array measurements are useful in low-temperature plasmas, and the physics can be extrapolated to different plasma regimes with a caution. In geomagnetic plasma studies, unresolved physics will be benefited by the magnetospheric multiscale (MMS) program [Citation6]. Presently the performance of fusion plasmas has routinely reached to a temperature above ~10keV at a high plasma density and International Thermonuclear Experimental Reactor (ITER) based on the tokamak concept is under construction to demonstrate a burning plasma physics creating significant fusion power (~500 MW). Effective control of the critical MHD and Alfvénic instabilities that affect the stability and confinement of the plasma [Citation7] can be achieved with validated models. This will ensure the success of ITER and future fusion reactors will greatly benefit from this knowledge. Since the present theoretical modelings have been validated with conventional diagnostic information [Citation8], deficiencies in modeling can be further clarified with advanced diagnostics. Therefore, multi-dimensional measurements with adequate spatial and time resolution in fusion plasma research are critical so that the physics validation can be performed with precision and tight constraints. The 2-D electron cyclotron emission imaging (ECEi) system [Citation9] has been developed for such needs, and the newly-uncovered physics has provided an opportunity to improve the theoretical models for toroidal fusion devices.
This paper is organized as follows: In Section 2, a brief review of toroidal fusion devices is given with a definition of the rotational transform (magnetic field helicity) which is essential for a stable equilibrium in these devices. Among the MHD instabilities driven by the current and pressure gradient in tokamak plasmas [Citation7], the sawtooth, neoclassical tearing mode (NTM), Alfvén eigenmode and edge localized mode (ELM) instabilities are addressed [Citation7]. In Section 3, advantages and shortfalls of diagnostic techniques employed for the study of these critical instabilities are discussed: They are Faraday rotation polarimetry and motional Stark effect (MSE) spectroscopy for the current density profile measurement and soft x-ray tomography for 2-D presentation of critical instabilities [Citation8]. A brief review of the electron cyclotron emission (ECE) measurement of the electron temperature (Te) profile and evolution toward the 2-D ECEi system for visualization of Te fluctuations follow. In Section 4, the newly-uncovered physics in the study of the critical instabilities with the 2-D ECEi diagnostic system are addressed together with the background of these instabilities. They are vindication of the ‘full reconnection model’ for the sawtooth instability, improved accuracy in determination of the critical parameters of the 2/1 mode and multiscale interaction between the 2/1 mode and micro-turbulence in NTM instability, deficiency in modeling of the Alfvénic eigenmode instability, and newly measured dynamics of the edge-localized modes (ELMs) and ELM-crash in 2-D will further improve understanding. Relevance of these new findings to the solar and space plasma physics is addressed in Section 5 and a summary section follows.
2. Review of fusion plasma devices and critical instabilities in tokamak plasmas
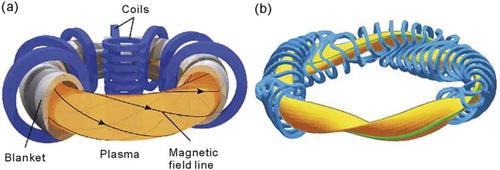
In the course of fusion plasma research, various concepts of toroidal fusion devices have been proposed. Among them, promising fusion plasma devices are merged into two groups; stellarator and tokamak families as illustrated in . In both families, a stable equilibrium requires a helical magnetic field line (i.e. field line pitch) instead of straight solenoidal field in a closed torus. The field line pitch is defined as a ‘rotational transform’ (t/2π) in the stellarator and ‘safety factor’ (q) in the tokamak, and they are related by q = 2π/t [Citation10]. In the stellarator family, the rotational transform is induced by sets of complex external coil systems as shown in , and it is non-trivial to change the rotational transform once the device is assembled. There are two ways to achieve the rotational transform in stellarators. The complex external coil structures can be arranged to generate rotation of elongated flux surfaces around the torus (e.g. LHD, Japan) or to make the magnetic axis non-planar (e.g. Wendelstein-7X, Germany). In the tokamak family (tokamaks and reverse field pinches), a helically axisymmetric nested magnetic surface is generated by superposition of an applied toroidal magnetic field (BT) by external coils and poloidal magnetic field (BP) induced by driven toroidal plasma current (IP) as shown in . The degree of helicity proportional to (Bp/BT) at fixed geometry (R, r, and κ, where R is the major radius, r is the minor radius and κ is the elongation factor of the nested flux surface) is characterized by the safety factor q(r) as shown in Equation (1).
In the tokamak plasma, the safety factor profile, q(r), can easily be manipulated by an external current drive system to influence the stability and confinement of the plasma. Note that the current required for a stable equilibrium is also a source of instability in tokamak plasmas. The safety factor profile, q(r), contains a series of rational surfaces (q = m/n = 1, 2, 3, …, where m and n are poloidal and toroidal mode number, respectively) on a nested poloidal surface. On a rational surface, the field line returns to the same point after m and n of the poloidal and toroidal angles, respectively (e.g. on the q = 1 surface, the point fully wraps around poloidally for one full toroidal turn), and a resonant mode can grow on these rational surfaces. Since the safety factor profile, q(r), is the key parameter for the stability of critical MHD and Alfvénic modes, it is extremely important to measure the q(r) accurately with a good spatial and temporal resolution.
Figure 1. Schematics of magnetically confined plasma in (a) tokamak and (b) stellarator configuration. In tokamak configuration, the rotational transform (helically twisted magnetic field) is formed by both the toroidal field by external coils and poloidal field induced by the toroidal plasma current. In stellarator configuration, the rotational transform is produced entirely by non-axisymmetric external coils.
Source: Y. Xu, Matter and Radiation at Extremes, 1, 192e200, 2016, [email protected].
The plasma pressure profile gradient in the toroidal plasma is mostly positive definite toward the center of the plasma and free energy from it is a potential source of instabilities. There are various modes of plasma operation and distinctive profile characteristics can be found either in the core or edge of the plasma pressure profile. Historically, tokamak plasma operation was started with relatively low energy confinement mode (L-mode) where the edge pedestal height was low (i.e. moderate pressure gradient in this region). As the shape of the plasma was evolved from a circular plasma with the plasma in contact with a material surface (a ‘limiter’ plasma) to an elongated plasma with magnetic divertors, a high confinement mode (H-mode) with high pedestal pressure [Citation11] was discovered in the ASDEX device in Germany and the energy confinement time was almost twice higher compared to that of the L-mode for the same heating power. Note that there is a wide variation in confinement time within L and H mode plasmas. While high edge pedestal in the H-mode plasma has the advantage of higher confinement and bootstrap current, higher free energy due to steep pressure gradient and large bootstrap current at the edge can each be a source of edge instabilities. At the edge of H-mode plasmas, the edge-localized mode (‘ELM’), characterized by a periodic burst of Dα light due to a partial collapse of the edge pedestal pressure, has been observed. Another improved confinement mode under study is the internal transport barrier (ITB) mode [Citation12], where the core confinement is significantly enhanced with the L-mode edge plasmas. This mode of operation has a relatively broad current profile due to the heating beam driven current. The ITB mode with high-pressure gradient in the core of the plasma can excite internal instabilities such as the NTM instability.
The free energy from the pressure gradient or energetic particles at rational surfaces of the q profile can also drive benign and/or harmful resonant MHD and Alfvénic instabilities. Ironically, the harmful modes driven by the plasma current which is required for a stable equilibrium, limit the increase of the confined energy due to enhanced transport and a rapid growth of these modes often leads to minor and/or major disruptions. Therefore, effort for an effective control of these harmful instabilities has been continued, but the progress has been mainly empirical. In order to develop a predictive capability in theoretical modelings for full control of these instabilities, fully validated theoretical models are needed. This capability is essential for future advanced fusion devices, where the plasma pressure and current density will be significantly higher than those of the present devices. Furthermore, any new underlying physics of these MHD models validated in fusion plasma devices can also be applied for interpretation of similar MHD phenomena in a nature such as explosive behavior of magnetic flux ropes in a solar flare. Among MHD instabilities at the resonant rational surfaces, the critical MHD instabilities are sawtooth oscillation (m/n = 1/1 mode in kink or tearing) within the q ~ 1 surface in the core, neoclassical tearing modes (NTM) (2/1 tearing mode) near the q ~ 2 layer and edge localized mode (ELM) (high m/n mode) at the pedestal of the H-mode plasma where the pressure gradient is extremely steep and the edge current profile is significantly modified by the bootstrap current. Alfvénic instabilities, such as the reverse shear Alfvénic eigenmode (RSAE) and toroidal Alfvénic eigenmode (TAE) are driven by the energetic particles.
3. Conventional and advanced diagnostics essential for the study of critical MHD and Alfvénic instabilities
In the course of studying the physics of MHD and Alfvénic instabilities, various diagnostic tools [Citation8] have been employed to measure physical quantities that can influence the stability and confinement of the current-carrying plasma. To monitor the current flow of the plasma, various types of magnetic probes positioned at various places on the vacuum vessel wall are employed to measure the change of the magnetic flux induced by the plasma current flow and its fluctuations [Citation8]. They are simple and easy to be deployed but a drawback is lack of internal plasma information. Therefore, a local measurement of the plasma current profile (or safety factor profile) with an adequate spatial and temporal resolution is essential to understand the dynamics of the current flow in these instabilities.
High-temperature plasmas in a magnetic field create a wide range of electromagnetic emissions from radio frequency to gamma ray. Besides the cyclotron emission from gyration motion of the charged particles, emissions originate from various mechanisms such as atomic transitions in the main and impurity particle species, acceleration in a transiently developed electric field, bremsstrahlung, etc. These emissions have been widely used to characterize the events in plasmas as well as to monitor instabilities. Among them, soft x-ray (SXR) emission [Citation8] has been widely used for the study of MHD and Alfvénic instabilities, since SXR has a strong dependence on the electron temperature (Te) and implementation is relatively easy compare to the active systems that require sophisticated instrumentation which may not be easily deployed in some cases. Since comprehensive measurement with high spatiotemporal resolution [Citation9] is essential to the study the localized MHD and Alfvénic instabilities, tomographic techniques perfected in the medical field have been applied but precise physics information may be limited due to accessibility constraints (i.e. the diagnostic requires many views for a unique tomographical solution) and the dependence of the emission on more than one plasma parameter.
In order to address fast time dynamics of the localized MHD modes and Alfvén waves in linear and non-linear phases, both high spatial and temporal resolutions are essential. Therefore, a fast detection of the electron cyclotron emission (ECE) has been widely used for this application [Citation8]. Note that the electron temperature is known to be a flux surface quantity, since electrons can rapidly follow changes of the local magnetic field due to its high thermal velocity. For example, the timescale of thermal electron motion with Te ~1 keV at BT ~ 2T is a nano-second timescale whereas the upper bound timescale of the MHD instabilities is ~μ-second timescale, and the particle collision frequency is in similar timescale.
3.1. Measurement of the current density profile in tokamak plasmas
As noted in the previous section, precise measurement of the plasma current density and pressure profile is critical for stability analysis of the MHD and Alfvénic instabilities in tokamak plasmas. The confidence in measurement of the plasma pressure profile (i.e. plasma density and temperature profiles) in tokamak plasmas is well established and will not be discussed in this paper. There are two principal methods for measurement of the current density (or equivalently, poloidal field) in tokamak plasmas and both methods are technically complex and many factors can limit the required accuracy for the stability analysis: polarimetric measurement based on Faraday rotation [Citation13–Citation15] and spectroscopy based on the motional Stark effect (MSE) [Citation16–Citation21]. Since the required accuracy level varies for different instabilities under study, it is important to be aware of limitations of these methods which are critical for the model validation process.
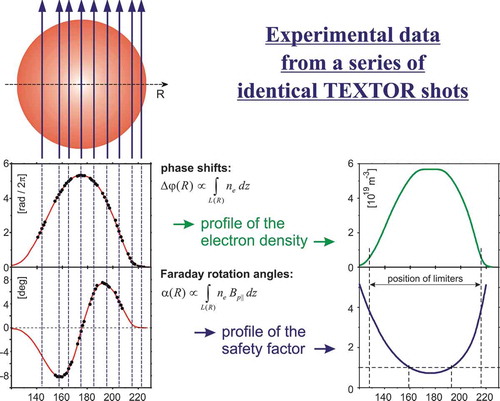
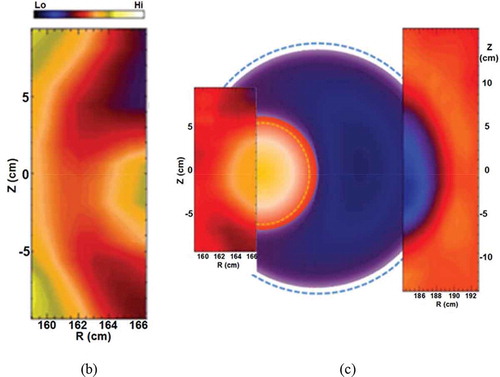
The polarimeter based on the Faraday rotation [Citation13–Citation15] requires a double inversion process, since the measured Faraday rotation angle is a convolution of the plasma density and magnetic field along the path of an electromagnetic wave propagating through the plasma. Also, the unfolding process relies on the accuracy of the equilibrium geometry. As an example, the most successful measurement of the current density profile was the polarimetry system on TEXTOR [Citation13] where the plasma shape was circular. The unfolding process is easier in the plasma in a circular cross-section compared to a shaped plasma. Much attention was given to instrument calibration, and various tests were performed in order to minimize errors in measurement and the double inversion process as illustrated in . Here, chordal arrangement of the probe beams on the poloidal cross-section is given. The increased data points of the line-integrated electron density and Faraday rotation angle are achieved by a radial ‘jogging’ of the plasma to enhance the spatial resolution. Then, double inversion process is applied to obtain the safety factor profile, q(r), as shown with q0 ~ 0.75 in this figure. However, an intrinsic weakness of the polarimetry is that the signal is typically small near the magnetic axis, where the poloidal field (Bp) approaches zero, and also near the edge of the plasma where the plasma density is close to zero. Since the q value at the edge of the tokamak plasma is usually a large number (>3), relative accuracy can be reasonable. On the other hand, the q value near the axis, including q0, is small (q ~ 1.0) in a positive definite current profile; then, the relative error becomes large. Note that the q0 is proportional to the derivative of the measured Faraday rotation angle profile across the axis. In addition, an application of this technique to shaped plasmas (plasma with finite elongation) further complicates the analysis due to the nature of chordal measurement and complexity of the instrumentation.
Figure 2. Illustration of double inversion process of the measured Faraday rotation angles using 9 chords of probe beams. In order to increase the precision, radial jogging of the plasma was performed as shown in the plot of line densities and Faraday rotation angles (left side). Then Abel inversion is introduced to invert the line integral density into the local density. Then the local density profile is used to evaluate the poloidal field which is used to calculate safety factor profile (right side).
Source: partial figure from H. Soltwisch
The spectroscopic method based on the Motional Stark Effect (MSE) [Citation16–Citation21] and Zeeman splitting [Citation22] measures polarization angle of the MSE or Zeeman splitting and the resultant pitch angle measured depends on system geometry from equilibrium reconstruction. The nature of the MSE spectroscopy is the local measurement of the magnetic field line pitch angle by measuring the polarization of the emission of the injected neutral beam (which is usually the neutral beam used for heating the plasma) with known energy as illustrated in . Here, the polarization of the emission is sensitive to the local electric field induced by the local magnetic field direction and velocity of the beam ions. The MSE system has been evolved technically to allow more reliable measurement and is now more routinely employed in contemporary tokamak plasmas. The poloidal field information is based on knowledge of the equilibrium magnetic geometry as shown in . Here, the measured poloidal field (Bz) is compared with the calculated value from equilibrium reconstruction and the agreement is excellent. The measured q profiles before (q0 = 0.97) and after (q0 = 1.05) the sawtooth crash are illustrated in this figure. Similar to the polarimetry, the MSE measurement faces the same sensitivity issue near the axis and edge, since the polarization angle of the π component emission is proportional to the field line pitch angle, tan (Bz/BT) and the Bz is again zero on axis, and the signal level becomes poor at the edge due to low emission level (i.e. low edge density). There are a number of sources of error and corrections in this measurement. The first one could be the Zeeman effect and the estimated ratio of the Stark splitting to the Zeeman splitting is ~4 for the signal that MSE measures from a hydrogen atom experiencing Balmer-alpha transition. Therefore, the Zeeman effect may not be a big issue but caution is needed for small signals. Also note that there is an additional intrinsic electric field due to ambipolar diffusion of the plasma particles [Citation19] which can impact the measured polarization and the detected emission signal has to go through a careful subtraction of an unwanted background emission including reflected signal from metal walls [Citation21]. At the same time, an accurate magnetic geometry from a reconstructed equilibrium, which needs the current profile information, is critical for confidence of the measured poloidal magnetic field. For instance, the pitch angle has a dependence on an elongation of the magnetic surface. Therefore, the measured q0 value can be subject to significant error due to this and other effects.
Figure 3. A schematic of MSE viewing geometry for edge and center of the plasmas on DIII-D tokamak (left side). Viewing angles with respect to the plasma are shown with typical positions of the axis and separatrix are ~1.55m and ~2.13m, respectively. The MSE measured poloidal field (Bz) and Bz from equilibrium reconstruction (solid line) are compared just before the sawtooth crash. The q profiles for before (q0 = 0.97) and after (q0 = 1.05) the sawtooth crash are ploted.
Source: B.W., Rice, Fusion Engineering and Design, 34–35, 1997
3.2. Soft X-ray emission measurement for monitoring MHD instabilities
In high-temperature plasmas in the tokamak, it is difficult to avoid high-Z impurities due influx of wall materials such as C, Fe, Ni, etc. which can diffuse into the core plasma. The emission from high Z elements at high temperature are from atomic transitions from the outer shell to hydrogen-like elements. The emission near the soft X-ray (SXR) region avoiding line radiation has been well understood and has a strong dependence on Te with relatively moderate dependence on ne and Zeff. The SXR detection system is capable of high time-resolution on the order of a μ-second, which is well-suited for the study of Te fluctuations in the core of tokamak plasmas. Note that the first observation of the sawtooth oscillation was by SXR emission [Citation23]. Therefore, the SXR spectroscopy system has been widely used in studying the critical MHD instabilities such as the sawtooth oscillation and NTMs in tokamak plasmas [Citation23–Citation28]. Since MHD instabilities in tokamak plasmas are located near their corresponding rational surfaces as described in the previous section, analysis of the amplitude and phase information along the chords can provide information regarding the q-profile. Furthermore, one or more poloidal arrays of the SXR emission detection can be used to construct a 2-D image of MHD dynamics [Citation23–Citation27] using a tomographic technique. Such a reconstruction from the line-integrated measurement demands a unique solution of the inverse problem. However, often times, the solution to the relevant inverse problem is not unique with the limited views; so multiple views are needed in order to find an unambiguous solution. The methodology has been perfected in the context of the Magnetic Resonance Imaging (MRI) where multiple views of an object (i.e. 360° view) and a long integration time (~minutes) are used to determine an accurate image of the object.
3.3. ECE measurement for the profile and fluctuations of Te and advancement toward the 2-D ECE imaging for visualization
The most widely used diagnostic system for the study of critical MHD and Alfvénic instabilities as well as the electron temperature profile in tokamak plasmas is the ECE measurement [Citation8,Citation29–Citation36], which provides a spatial and temporal evolution of the local electron temperature and its fluctuations. In a magnetized toroidal plasma, the electron gyro-motion results in an emission at the electron cyclotron frequency, and its harmonics [Citation8], where B is the magnetic field strength, e is the electron charge, and m is the electron mass. The principle of ECE for Te measurement is well established, and this technique has been routinely used to measure the local electron temperature in fusion plasmas for over four decades, since the first measurement on the CLEO tokamak [Citation29].
When the electron density and temperature are sufficiently high, the plasma is considered to be optically thick [Citation8,Citation37] with respect to the first (ordinary) and second harmonic (extraordinary) mode. Then, the emission intensity, I(ω), approaches to that of black body radiation which is given by Equation (2).
where ω is the radiation frequency, c is the speed of light and Te is the electron temperature. The optical thickness in ECE has been extensively studied and a guideline for a valid Te measurement for given plasma density and temperature is provided in Ref [Citation8,Citation37]. In the regime, where the optical thickness is reduced to the grey level, localized measurement is possible but the emission intensity is no longer proportional to the local Te alone (i.e. the emission depends on a combination of the electron density and temperature). When the optical thickness is lowered further and it becomes thin (i.e. at very edge of the plasma), the emission neither is localized nor represents the local Te and the measurement is contaminated by down-shifted emissions. Since the intensity of the emission is directly proportional to Te as long as the region is optically thick, the measurement of ECE at a fixed frequency enables a measurement of the local Te as well as its fluctuations. Here, the ECE frequency has a spatial dependence due to the radial dependence of the toroidal magnetic field, , where
and R are the toroidal field and major radius of the tokamak plasma, respectively. The advantage of ECE for Te measurement can be compromised somewhat by a number of factors: spatial variations introduced by the poloidal magnetic field, which can be a significant fraction of the toroidal magnetic field as the toroidal field is lowered and/or the plasma current is raised, by harmonic overlap when the same frequency is resonant at two different spatial locations in a low magnetic field device. A good example is an application of ECE measurement to a spherical tokamak where the toroidal field is comparable to the poloidal field. The other effect comes from a wave refraction effect which may introduce uncertainties in viewing directions when the plasma density gradient is high. Allowances need to be made for these potential sources of errors in interpretation of the observed emission.
The local Te can be obtained from the measurement of ECE in a number of ways. These include usage of the heterodyne ECE receiver [Citation30], grating polychromator [Citation31] and Fourier transform spectrometer [Citation32]. The Fourier transform spectrometer [Citation32] has the advantage of ease of calibration due to a large throughput but has poor time resolution. In the grating polychromator system [Citation31], the time resolution is significantly improved, but achieving an absolute calibration is difficult. In the heterodyne system [Citation30], a single or two-stage down-converter is required to process the high-frequency signals to a convenient intermediate frequency (IF) for a final detection. Among the three techniques, the heterodyne system yields the highest sensitivity with absolute calibration. The principal limitation of this system is the spatial coverage due to bandwidth limitation and harmonic overlaps. In order to cover the entire plasma, one may need more than one detection system. A schematic of a typical arrangement of instruments required for a 1-D heterodyne ECE radiometer is shown in . Here, emissions from the plasma on the mid-plane, where the refraction effect is minimum, are collected by a single detector through optics. The detected emissions are splitted with adequate radial spacings and then they are down converted with local oscillator (LO) sources to measure the local Te. A typical resolution of the 1-D ECE system is 5 cm x 5 cm. Since the ECE system is a local measurement with high time resolution, the measured Te across the plasma provides flux surface position and corresponding Te profile. Note that Te is constant on the same flux surface (i.e. flux surface quantity), since the electron has a high thermal velocity. In a toroidally rotating plasma, toroidally axisymmetric MHD structures can be reconstructed to form a 2-D image using the time-dependent 1-D data with an assumption that the MHD dynamics is invariant during one full rotation.
Figure 4. (a) Arrangement of the conventional 1-D ECE system for Te profile measurement is illustrated. The system utilizes a single detector and wideband sweeping local oscillator source for single row of sampling volumes with a typical resolution of ~5 cm x ~ 5 cm. (b) Arrangement of the 2-D ECEi system with a quasi-optical 1-D vertical detector array with large optics (triplet lens system). Each detection element consists of Schottky diode and dipole antenna is like a single mixer in the 1-D ECE system and 2-D array of sampling volumes is formed within the focal depth of the optical system. The down converted IF signal is splitted into 8 radial channels to form radial profile of Te at a given vertical position.
Source: Park, H,
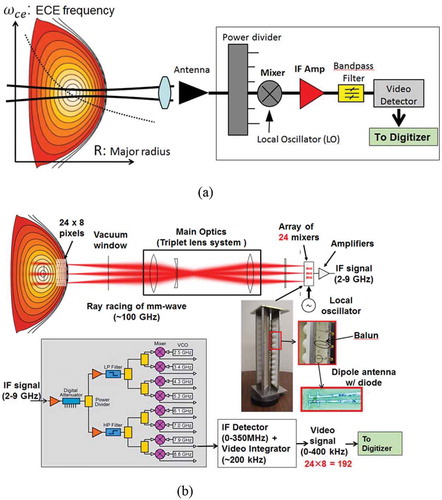
In order to investigate non-axisymmetric and fast transient dynamics of MHD mode activity and related turbulence (i.e. growth of the 1/1 kink, 2/1 TM and NTM, reconnection events during sawtooth dynamics and ELM-crash, disruption, etc.), it is desirable to develop a 2-D ECE imaging (ECEi) system which can simultaneously measure 2-D images of the MHD activity with high spatial and time resolution (e.g. instead of ~5 x 5 cm in 1-D ECE, it could be ~1.0 cm x 1.0 cm). This requires improved sensitivity of the detection system and integrated signal processing technology. As the sensitivity of the detection system has been improved and the size miniaturized with advances in sub-millimeter technology [Citation38], the single detection element is replaced with a 1-D array detector where each detection element is vertically stacked as shown in . As shown in this figure, the vertically extended large optical elements (e.g. triplet lens system with zooming capability in the KSTAR system) are employed to have a one-to-one mapping of the vertically resolved beamlines of the emissions from the plasma within the focal depth to each detection element in the vertical array through a mini-lens to collect the emissions effectively and simultaneously. The detection element consists of a Schottky diode and dipole antenna structure as shown in the figure. The measured emission at the ECE frequency (~100 GHz corresponds to second harmonics emission) is down-converted using a LO to the desired intermediate frequency (IF) range (2–9 GHz). The IF signals from each detection element are divided into eight channels with 700–900 MHz bandwidth and processed simultaneously with state-of-the-art electronics to form a 2-D image [Citation9,Citation36]. The first prototype 2-D ECEi system with a vertical array of 16 detection elements was developed for the TEXTOR device [Citation9]. Here, the ECEi system was combined with the microwave imaging reflectometer (MIR) for simultaneous measurement of the fluctuations of ne and Te. The sampling area at the focal plane was ~20 cm (vertical) x ~ 8 cm (radial), and the vertical resolution was determined by the antenna pattern of ~1.2 cm (Full Width at Half Maximum [FWHM]) for each pixel. The radial resolution was ~1 cm across the core of the tokamak plasma (total of 128 [16 x 8] channels). The time resolution was primarily limited by the digitizer, and the nominal time resolution was ~5 μsec. The time-dependent signals from 128 channels were simultaneously processed to assemble a 2-D image. In principle, each channel can be absolutely calibrated so that it can measure the Te profile as well as the fluctuation. In practice, there are difficulties in calibrating all channels due to the variation in the local oscillator power at various frequencies. So the processed image is based on a relatively calibrated value (δTe = Te/<Te>) for each channel, where <Te> is the time-averaged value for a certain time zone. In recent years, the microwave technology has been further improved and an integrated system with a highly sensitive detection element, and primary electronics has been developed at the lower frequency where the technology is available [Citation39]. This technology will be valuable for future application.
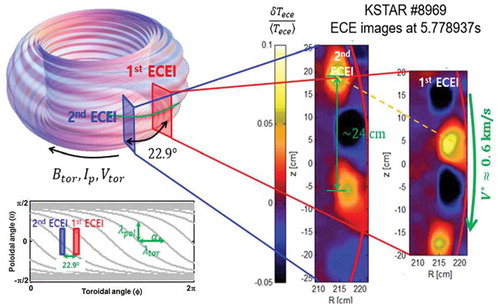
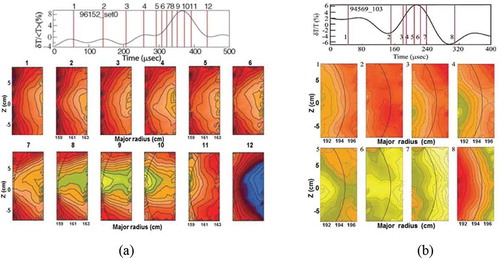
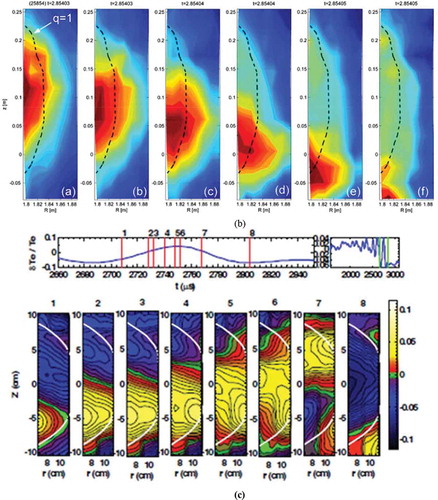
When the first ECEi system was installed on the TEXTOR tokamak plasma, validation of the system performance was tested against the sawtooth instability, since dynamics of the 1/1 kink mode in a sawtooth oscillation were well known and the size of the cold island and 1/1 kink mode were large enough to cross-check the spatial and temporal resolutions of the system as shown in . The poloidal cross-section of the TEXTOR plasma with the normalized change of Te (δTe/<Te>) before and after the crash of the sawtooth across q ~ 1 surface is shown in this figure. The monotonically peaked Te profile prior to the crash (yellow color) across the q ~ 1 surface (double white line) and increased Te in the mixing zone and decreased Te (blue color) inside the double white line right after the crash (yellow color) are well represented by 2-D ECEi data. The 2-D images are consistent with the classical dynamics of the 1/1 kink mode with a time resolution of ~5 μs. Following the first successful ECEi system on TEXTOR, the ECEi system has become a standard advanced diagnostic system on tokamaks as well as stellarators; ASDEX-U [Citation40], DIII-D [Citation41], EAST [Citation42], HL-2A [Citation43], LHD [Citation44], KSTAR [Citation45], and WEST [Citation46]. On KSTAR, the first ECEi system with two poloidal views and 24 vertical array detectors was commissioned in 2008. The second system with a single view, toroidally separated by 22.9°, was added to form a semi 3-D system along with the first system. The nominal view window is ~40 cm (vertical) x ~ 12 cm (radial) with the radial resolution of ~1.5 cm and the vertical zoom factor of ~3 (total of 192 channels). The time resolution can be adjusted by the digitizing speed, and the nominal time speed is ~2 μsec. Two simultaneously measured images of an ELM from two edge toroidal views are illustrated in . An important information such as the magnetic pitch angle, velocities, and self-consistent mode numbers can be comprehensively obtained as illustrated in this figure. In each tokamak device, the ECEi system has produced many new physics observations that were not available with conventional diagnostic systems.
Figure 5. Demonstration of the sawtooth crash event by the first 2-D ECEi system on TEXTOR tokamak plasma. A time trace of the central channel of the ECEi system shows sawtooth oscillation in different time scales (slow rise and fast crash). The captured 2-D images of δT/<Te> before (1), during (2) and after (3) the sawtooth crash, are illustrated with the q ~ 1 layer (white double line). Before the crash, symmetric and peaked Te profile is shown in the frame 1. During the crash phase, a hint of heat flow is shown in the mixing zone in the frame 2. Heat from the core is accumulated in the mixing zone and Te is flattened within q ~ 1 surface (double white line).
Source: H. Park
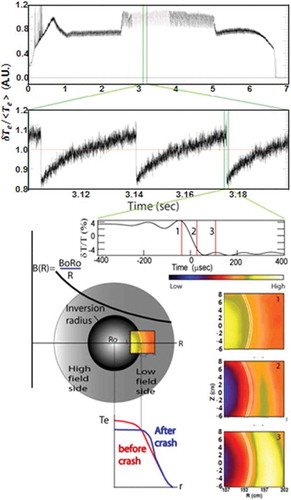
Figure 6. Arrangement of the KSTAR quasi 3-D ECEi system is illustrated. The 1st ECEi system equipped with two views for simultaneous measurement at two poloidal planes (e.g. core/edge or high field side/low field side) is shown in red color box. The 2nd ECEi system with blue color is added at the toroidal plane separated by 22.9° and simultaneously measured ELM images from two edge views are shown. Here, the pitch angle, velocity and mode numbers can easily be calculated.
Source: H. Park
4. New physics uncovered by the 2-D ecei imaging system in the study of critical MHD and Alfvénic instabilities
4.1. Sawtooth instability
4.1.1. Brief review of the sawtooth instability
The sawtooth instability (slow rise of the core plasma pressure followed by a sudden growth an m/n = 1/1 kink (or tearing) mode which leads to a fast ‘crash’ of the measured emission) is the most fundamental tokamak instability and occurs in the core (inside the q ~ 1 surface) of the plasma. This instability is benign as long as the amplitude of the crash is small. As the amplitude of the crash is increased, a sudden burst of the plasma pressure and perhaps current density at the q ~ 1 surface generates an outward ballistic perturbation that can be a ‘seed’ of harmful MHD like NTMs and ELMs. Despite of a long history of study, the stability criteria have been disputed until recently. This instability was first discovered in the ST tokamak at Princeton [Citation23] in which the soft X-ray detection system revealed an oscillation pattern similar to a ‘sawteeth-shaped’ pattern as shown in . Since the observed crash timescale was significantly faster than the transport timescale, other mechanisms such as magnetic field reconnection or an interchange mode instability was suspected.
Following the first observation of this instability, Kadomstev proposed the ‘full (or complete) reconnection model’ [Citation47]. In this model, an excess core current density and plasma pressure responsible for the 1/1 kink (or tearing type) instability are fully removed through a magnetic reconnection event and the removed excess current and pressure are piled up at the mixing zone in a characteristic timescale, , where τr is the resistive time and τA is the Alfvén time. The timescale estimation was based on the ‘Sweet-Parker’ reconnection model [Citation48]. After the crash, the central current density slowly builds up with the rising central temperature, a displacement of the 1/1 kink mode occurs as the q0 drops below ~1.0 along the helically symmetric surface within the q ~ 1 surface. Then, the reconnection event occurs at the region where the pressure gradient is steepest on the poloidal plane. Here, the reconnection zone is helically axisymmetric on the toroidal plane and the q0 returns above ~1.0 after the discharge of the excess current and pressure is completed. An example of 1-D Te profile during the sawooth oscillation and the detailed 2-D electron temperature (Te) transport event occurring over a ~ 100μs interval is shown in . Increased Te is represented in a yellow color in frame 1 (increase in Te) before crash event. The increased Te in the mixing zone is shown in the frame 3 as yellow color with bluish color in the core (decrease of Te) after the crash event is illustrated in this figure. There is a discrepancy in the time of the dynamics based on theory: the measured crash time of ~100μs does not agree with the expected
~ a few ms. This is one of the reason why the ‘full reconnection model’ was abandoned.
After the proposed full reconnection model, it took more than a decade to measure the current density (or q) profile in tokamak plasmas. The measurements of the q0 value during sawtooth oscillation by polarimeters (TEXTOR [Citation13], JET [Citation14] and MTX [Citation15]) and Spectroscopic measurements (MSE on TFTR tokamak [Citation17] and Zeeman effect on TEXT [Citation22]) reported that the measured q0 was which was well below ~1.0 even after the crash. An immediate dilemma was how the 1/1 kink mode can be stable while q0 is well below ~1.0 after the crash. Numerous new theoretical models called ‘incomplete (or partial) reconnection models’ were proposed [Citation49,Citation50]. Meantime, technical advances of MSE spectroscopy were made, and new measurements were conducted on DIII-D tokamak device [Citation18,Citation19]. Here, they reported the measured
and supported the full reconnection model. Note that there was an earlier MSE measurement of q0 ~ 1.0 on TEXT [Citation16]. The MHD community was puzzled about the two vastly different measurements. One suspicion was that the flux surface elongation might explain the difference in q0, since the first two measurements (~0.75) were from circular plasmas (TFTR) and the others (~1.0) were from the shaped plasmas (DIII-D), where < > represents average value. Note that there were measurements of mixtures of ~0.75 [Citation21] and ~1.0 [Citation16] on TEXT (circular plasma) and the group who measured ~0.75 in TFTR [Citation17] reported ~0.86 in PBX-M device where the core κ was ~1.36 [Citation51] and the dependence of q0 on the plasma shape factor may not be convincing. The experiment conducted on DIII-D [Citation52] to compare the sawtooth behavior in vastly different plasma shapes (bean and oval) could not find any further resolution. In recent experiments in plasmas with elongation of ~1.2 on KSTAR, MSE spectroscopy reconfirmed that
in the plasma with sawtooth oscillation as shown in [Citation53].
Figure 7. The measured electron temperature and q0 by MSE system on KSTAR are shown. The measured average value is ~1.0 and variation of the q0 (δq) before and after the crash is ~0.06 with error range of .
Source: Y. B. Nam, et al Nucl. Fusion 58, 066009, 2018,
Figure 8. Illustration of 2-D images of the fast crash process at the high (a) and low (b) field side of q ~ 1 surface (black line) of the TEXTOR plasma where the center of the plasma is ~177 cm. The time trace is from (z = 0) near the q ~ 1 surface from both sides. Ballooning type of bulge with a clear ‘finger’ is shown at both sides. Severe distortion (or harmonic generation) of the 1/1 kink mode prior the crash at both sides is shown.
Source: partial figure from H.K. Park, et al Phys. Rev. Lett. 96 195,003, 2006 (a)
In summary, the measurement of q0 in plasmas with sawtooth oscillations is divided into two groups. They are and
. Here, the difference in median value of two group is Δq~0.25 with error range of
. However, the relative change of q0 (i.e. δq~0.07) before and after the crash is common for both groups and this change is consistent with the expected small current diffusion after the crash. The difference, Δq~0.2, between two groups cannot be explained by the estimated experimental error. Even if the second group (~1.0) is correct, it is still difficult to validate the model, since the experimental error is too large or the required absolute error is too stringent to address that the q0 is above ~1.0 right after the crash. Therefore, it is imperative to introduce a comprehensive supplementary experiment which can identify, if q0 is above or below ~1.0, because a comprehensible validation of the model with a direct measurement is not possible with present-day instruments. This statement does not imply that the MSE and Faraday rotation measurements are inaccurate. In fact, they are extremely accurate in spite of the complexity of instrumentation except that the change in current density is relatively small in the sawtooth dynamic as discussed in the previous section.
The observed crash time of the sawtooth instability has been unanimously faster than the proposed τc by the full reconnection model even in a large tokamak [Citation54]. This was the primary reason why the full reconnection model was abandoned as soon as the experimental observation was determined even before the q0 issue became controversial. A decade later, a new model, the ‘quasi interchange mode model’ was proposed by Wesson [Citation55] with an assumption that the q profile is flat at 1.0 inside the q ~ 1 surface (no magnetic shear) to explain the observed fast crash timescale. Note that this model does not require field line reconnection and is based on the interchange mode instability developed at the vulnerable region of the q profile (i.e. dq/dr is maximum near the edge of the q = 1 surface). This model was supported by observation of the interchange mode with the SXR tomography system on the JET tokamak device [Citation25]. A later experiment on the TCV device demonstrated that a unique solution with the limited views of tomography might not be feasible [Citation26]. However, the probability might have been low, but there was a chance to have the q = 1 condition in the core so that the observed interchange mode could explain the observations. Certainly, this model can explain the fast reconnection time based on observed interchange mode, but the majority of cases are consistent with the full reconnection model where the field line reconnection appears to be due to the 1/1 kink (or tearing) mode rather than interchange mode. Recently, a plasmoid model that has been popular in explaining the fast reconnection process in astrophysical plasmas and solar flares has been used as an attempt to explain the fast reconnection process in sawtooth oscillations [Citation56].
Detailed analysis of the sawtooth crash performed on TFTR reported many interesting observations through reconstructed 2-D image with 1-D ECE data using the plasma rotation [Citation57]. While most of the observed sawtooth crash processes were consistent with the full reconnection model in which the reconnection happened at bad curvature side (i.e. low field side) except that the reconnection zone is localized along the magnetic pitch on the toroidal plane (i.e. 3-D nature) with a fast reconnection time compared to the τc. Here, the hot spot (1/1 kink or tearing mode) had a feature of the ballooning mode which was discovered for the first time on TFTR [Citation58]. In addition, examples of slow reconnection processes were observed in ohmic and ion cyclotron radio-frequency heated (ICRH) plasmas. Here, the reconstructed 2-D image revealed that the 1/1 kink mode was axisymmetric (i.e. 2-D nature) and reconstruction of 2-D image for these cases was difficult due to the slow reconnection time compared to the plasma rotation speed. The core plasma pressure was expelled and flattened but little change of the core current density was noted after the crash based on the measurement from Reference [Citation17].
While the sawtooth pattern has a slow rise of Te in an MHD quiescent period after the crash and a rapid growth of the 1/1 kink mode before the crash (i.e. precursor), there have been many reports on variations of the sawtooth pattern such as middle cursor, post-cursor, compound and humpback sawteeth [Citation59,Citation60]. For instance, the middle cursor and compound sawtooth [Citation57,Citation61] has the 1/1 kink oscillation in the middle of the rising phase of Te followed by small crashes before the main crash. Another example is the post-cursor oscillation which has a long decay time of the 1/1 kink mode after the first crash [Citation57,Citation60]. The physical interpretation of these variations may be self-explanatory, once the basic physical mechanisms, such as the sensitivity of the 1/1 kink mode on q0 and its shear are understood. This subject will be revisited in the following section.
4.1.2. What are the new findings in the study of the sawtooth instability with the 2-D ECEi system?
Prior to visualization of the sawtooth instability with 2-D ECEi imaging, the 2-D crash pattern reconstructed with the SXR and ECE tomography demonstrated that the crash was likely to be observed at the lower field side in an axisymmetric toroidal plane due to the ballooning nature of the 1/1 kink mode [Citation26,Citation58,Citation61]. When the 2-D ECEi system was introduced in the study of the sawooth crash process, it was found that the crash could occur localized at the high field side as well as the low field side. As demonstrated in , a ‘finger’ with bulge (i.e. ballooning mode) with a highly distorted 1/1 kink mode develops before the crash event and the ‘finger’ punches through the q ~ 1 surface at the high field side. The core temperature (Te) is removed through a narrow reconnection zone on the poloidal plane and then the Te profile is flattened inside the q ~ 1 surface after the crash [Citation62]. A similar crash pattern was also observed at the low field side as shown in . The other characteristic of the ballooning mode is a finite reconnection zone on the toroidal plane, and this was confirmed by the observed 2-D image during the crash time. These localized crashes, which occur randomly along the q ~ 1 surface, may have been difficult to be detect with the 1-D measurement on the horizontal mid-plane. An example of the ballooning mode observed with the conventional 1-D ECE system in TFTR is shown in [Citation57,Citation58,Citation61]. Here, two toroidally separated polychrometer systems measured Te on the midplane and a ‘finger’ structure of the ballooning mode is demonstrated on the low field side of the plasma. Since the motion of the narrow reconnection zone moves along the helical magnetic field line, the observation of it on the mid-plane can have a very short duration. With the time resolved 2-D images, the toroidal extent of the 1/1 kink mode with ballooning signature (bulge of Te at the reconnection zone) in a toroidally rotating plasma could be estimated to have a length of ~1/3 of the plasma circumference (2πR0) [Citation63]. In summary, the observed bulge or finger during the crash process of the sawtooth instability is ‘ballooning like’ event, and it is not necessarily the classical ballooning mode.
Figure 9. Comparison of the reconstructed images with 1-D ECE when the hot spot is on the good curvature side and on the bad curvature side. (a) The contour plot of the electron temperature profile; the contour step size is 250 eV, and the hatched region indicates Te ~56–6.25 keV. (b) The contour plot of the temperature difference; the contour step size is 100 eV and the hatched region indicates less than 300 eV. (c) The contour plot of the perturbation of the electron temperature; the contour step size is 60 eV. The dashed circles indicate, 1- the mixing radius, 2- the inversion radius. The regions indicate, 3-the hot spot, 4- the island, and, 5- the cool region between the hot spot and the island.
Source: Y. Nagayama, Physics of Plasmas 5, 1647 (1996)
The advent of a direct measurement of the 2-D image of the Te perturbation finds an opportunity to compare with the 2-D image from simulation. A direct comparison between the measured partial images of the 1/1 kink mode/cold island and simulated images from the ‘full reconnection model’ and ‘quasi-interchange mode model’ is demonstrated in [Citation64]. The ECEi results show a closer resemblance to the full reconnection model. Since the first measurement of 2-D images of the sawtooth dynamics in TEXTOR, the sawtooth crash process has been studied with the 2-D ECEi system on DIII-D [Citation65], EAST [Citation66], ASDEX-U [Citation67] and HL-2A [Citation68], HT-7 [Citation69] and each reporting that the observations are consistent with the findings from the TEXTOR plasma. The measured 2-D images from the sawtooth crash process in EAST, ASDEX-U and HT-7 are illustrated in -. The fact that the observed sawtooth crash processes appear closer to the full reconnection model rather than the quasi-interchange mode model does not exclude the possibility of the quasi-interchange mode model. As discussed in the previous section, if q = 1 is nearly constant inside the q ~ 1 surface, this instability can grow as the model suggests [Citation55] but the probability of a nearly flat q = 1 region is small. Also, the present form of the plasmoid model introduced to explain the fast reconnection time [Citation56] may produce a similar conclusion as the quasi-interchange mode model. Note that the crash process does not have to be unique and variations can be rare but are always feasible due to anomalies of the core current density and pressure in each crash event. It is important to focus on the physics of the dominant explanation of the event and modify the understanding by allowing deviations from the dominant event.
Figure 10. The measured 2-D images of the hot spot (1/1 kink mode) and cold region (island) are directly overlaid for comparison with the 2-D contour patterns from (a) the full reconnection model and (b) the quasi-interchange model.
Source: H.K. Park, et al Phys. Rev. Lett. 96, 195,004, 2006
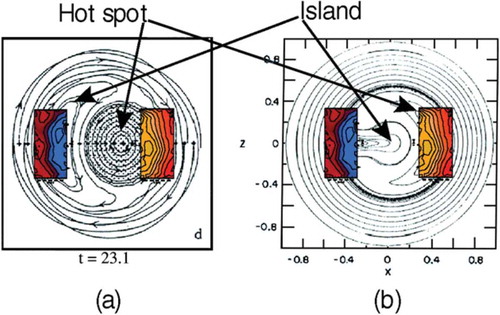
Figure 11. The 2-D images during the sawtooth crash event from (a) EAST, (b) ASDEX-U and (c) HT-7 are similar to those from the TEXTOR. The rotating 1/1 kink mode is observed prior the crash time and the core heat inside the 1/1 kink mode is transported through the localized reconnection zone and the transported heat is piling up in the mixing zone after the crash. Highly distorted 1/1 kink modes are commonly illustrated in the images of the sawtooth crash in all devices. The level of distortion of the 1/1 kink mode can be represented as a harmonic generation.
Sources:a.EAST: Gao, B.X., et al JINST 13, P02009, 2018b.ASDEX-U: Igochine, V., et al Phys. of Plasma, 17, 122,506, 2010c.HT-7: Wan, B., et al Nucl. Fusion, 49, 10, 2009
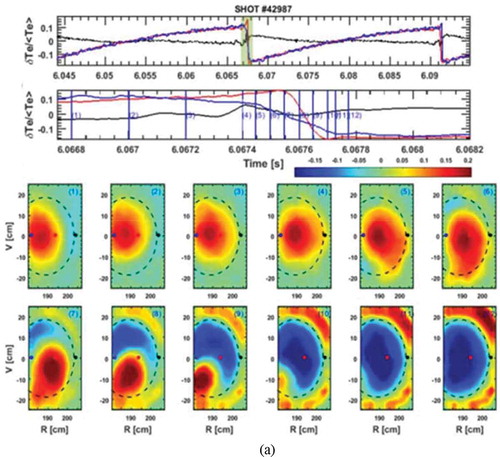
Figure 11. (Continued).
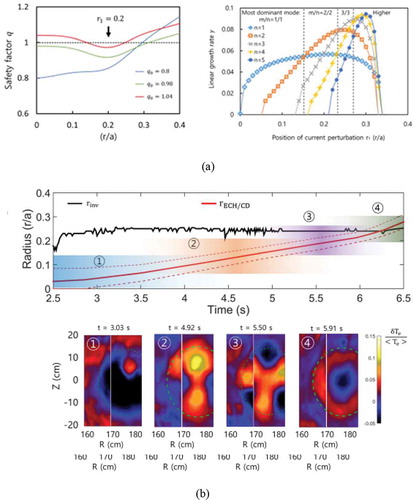
As discussed in the previous section, if the measured ~ 0.75~0.75 is valid, we definitely need new comprehensive theoretical models, but there have been no new convincing theoretical models brought forward so far. On the other hand, even if the measured~ 1.0 ~1.0 valid, direct measurement of the current density profile alone cannot definitively validate the q0 value before and after the crash event due to the required precision of the measurement of a small change of the core current density before and after the crash (~5%). A new comprehensive experiment, that can validate whether q0 is above or below ~1.0 right after the crash with no other MHD instabilities present, should be conducted with today’s measurement capabilities. A couple of ideas have been suggested: The first one is based on measurement of the Alfvén eigenmode dispersion that is sensitive to the central q value and its shear [Citation70]. The second one is excitation of the double tearing mode inside the q ~ 1 surface. The second idea is similar to the off-axis sawtooth crash of the double tearing mode near the q ~ 2 surface [Citation71]. Note that there was an independent theoretical study to explain double tearing modes inside the q ~ 1 surface [Citation72]. In order to design an experiment for excitation of the double tearing mode with the current blip by electron cyclotron current drive (ECCD) inside the q ~ 1 surface, a simulation study [Citation73] with the reduced MHD code M3D-C1 [Citation74] was performed to examine growth rates of resonant modes (m/n = 2/2, 3/3, 4/4, etc.) with the modeled q(r) modified by a current blip (i.e. dip in q profile at r/a = 0.2) within the q ~ 1 surface as shown in . For the background q0 < 1.0 (= 0.98, and 0.80), there is no double-crossing points, and the m/n = 1/1 mode is the only mode that has significant growth rate [Citation73]. When q0= 1.04, there are double-crossing points across the q = 1 layer and growth rates for different resonant modes at different positions of the current blip are clearly demonstrated in . In order to establish the double-crossing dip in the q profile with the current blip in the core region of the KSTAR plasma, the ECCD system at 170 GHz was slowly scanned along the resonance layer (vertical direction) as illustrated in . Here, the trajectory and driven current of the launched ECCD was modeled with the TORAY code [Citation75]. As illustrated in this figure, the observed tearing modes right after each crash event are well matched with the modes with the highest growth rate from the modeling for the q0 = 1.04 case. These experimental results confirm that the q0 after the crash is likely above 1.0 and this is consistent with the direct measurements from the second group (~1.0) as measured on KSTAR.
Figure 12. (a) The modelled q profiles inside the q ~ 1 surface with a dip in the q profile at r/a = 0.2 for three different q0 values (0.8, 0.98 and 1.04) are shown in the left side. Maximum growth rates of the resonant modes calculated using M3D-C1 code are shown in the right side as the dip in the q profile with q0 = 1.04 is scanned from the center to the edge of the q ~ 1 surface (zone 1, 2, 3, and 4). (b) Excited resonant mode is shown when the current blip (dip in the q profile) is scanned from the center of the plasma to the edge of the q ~ 1 using ECCD. In zone 1 (r/a < 0.15), a hot spot in the core is observed. In zone 2 (0.1< r/a < 0.22), the 2/2 mode is excited. In zone 3 (0.2< r/a < 0.27), the 3/3 mode is observed. Near the q = 1 region, higher order mode is excited.
Source: Nam, Y.B., et al Nucl. Fusion 58, 066009, 2018, ,
The time evolution of one sawtooth cycle without and with ECCD is shown in . In the cycle without ECCD, the only observable instability is the rapid growing 1/1 kink mode before the crash. In the cycle with ECCD, the m/n = 3/3 tearing mode is excited right after the crash and transforms into the 2/2 mode. Then, the 2/2 mode transforms into the 1/1 mode which is followed by the crash. Based on simulation results, transformation of the 3/3 mode can be interpreted as follows: As Te builds up on the flattened Te profile after the crash (i.e. peaking of Te), the increasing core current density induces the driven current blip to move toward the core (i.e. q0 drops faster with shear) so that the 2/2 mode can grow. As the q value goes below 1.0, the growth rate of the 1/1 kink mode dominates. Note that it is common to have a discharge without sawtooth oscillation when q0 is increased above ~1.0. Among them, there is a ‘hybrid mode’ of operation where the q0 is above slightly ~1.0 due to broadened current profile in the core. When the same experiment was performed in a hybrid mode plasma, the excited double tearing modes (m/n = 3/3 and 5/5) did not change for ~0.5 s as shown in of reference [Citation73]. These results suggest that the double tearing modes was excited and sustained as long as the q0 remains above 1.0 and further support the full reconnection model.
Figure 13. One sawtooth period without and with the current blip is compared. The sawtooth without current blip only has the 1/1 kink mode just before crash (upper left). One sawtooth cycle with the current blip in zone 3 in , has the 3/3 mode in early rising phase after the crash. The 3/3 mode transforms into the 2/2 and 1/1 mode before the crash. The 2-D images of the 3/3, 2/2 and 1/1 mode are shown in the right side. The transformation is likely due to the change of the background q value as the current builds up with the increasing Te in the core.
Source: Nam, Y.B., et al Nucl. Fusion 58, 066009, 2018,
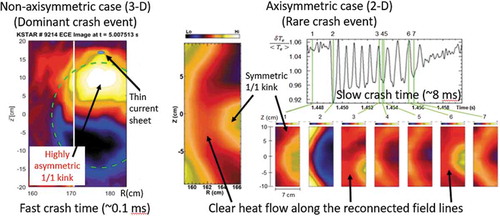
In the ‘full reconnection mode’ model, the reconnection timescale (τc) is based on the helically symmetric 1/1 kink mode, and the reconnection zone is poloidally localized and helically axisymmetric along the toroidal plane (i.e. 2-D nature). As shown in and , the observed 1/1 kink mode near the crash time is highly distorted (i.e. not symmetric in either the poloidal or toroidal planes) and the reconnection zone is highly localized on both the poloidal and toroidal planes (i.e. non-axisymmetric in toroidal plane as in the ballooning mode case [Citation57,Citation61–Citation63]). This is consistent with the observation of the fast reconnection time in ballooning mode case [i.e. 3-D nature] on TFTR [Citation57]. Distortion of the 1/1 kink mode and localization in toroidal plane can be interpreted as a higher harmonic Fourier components of the 1/1 kink mode and there are numerous experimental reports on observation of harmonic modes of the 1/1 kink mode [Citation65–Citation67] as shown in -c. In the experiment, sawtooth crashes are dominated by the reconnection event of the highly distorted 1/1 kink mode with non-axisymmetry in the poloidal and toroidal planes and the corresponding crash time is an order of magnitude faster than τc deduced from the model in a helically axisymmetric system. So, it is important to find a case of crash events that is close to the model where symmetry of the 1/1 kink mode is preserved so that the reconnection timescale in the helically axisymmetric case can be compared to that of the modeling.
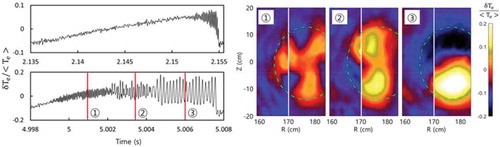
The 2-D nature of the crash cases with slow reconnection time in TFTR discussed in earlier section is consistent with the full reconnection model which is based on 2-D modeling. These cases are rare compared to the crash cease with fast reconnection time. The ‘post-cursor oscillation’ is also a rare event of sawtooth oscillations and has been observed in many devices [Citation57,Citation59,Citation60]. This oscillation is distinguished from the precursor oscillation. In precursor phase, the 1/1 kink mode is rapidly growing without reconnected field line and then crashes through the reconnection process. After the first reconnection event, the 1/1 kink mode in a reconnected state is slowly decaying in the post-cursor oscillation. In a toroidally rotating system, the slowly decaying 1/1 kink mode in a reconnected state (post-cursor) appears as an oscillatory motion and one period represents one full toroidal rotation of the plasma. The measured 2-D image of the post-cursor oscillation shows new information that is not available from conventional diagnostics as shown in . Here, the remnant of the clear and symmetric 1/1 kink mode remains in a reconnected state for a long time after the first crash as shown in . The 1/1 kink mode is relaxing slowly as the Te rises. The continuously rotating reconnection zone in the view window due to the toroidal rotation suggests that the reconnection zone is helically symmetric around the torus and the reconnection timescale (i.e. end of rotation) is significantly slower than that of the dominant fast reconnection cases that we have experienced. One clear 2-D image shows a flow of the heat from the remaining 1/1 kink mode to outside of the q ~ 1 layer along the field line through a wide reconnection zone (~7 cm) compared to narrow reconnection zone in the fast reconnection case is illustrated in . Note that the timescale of the change of Te (~μs order) is much slower than that of the electron thermal speed (~ns order) as we have discussed before. A reconstructed image of the reconnection process with the reconnected 1/1 kink mode at the high field side and cold island formation at the low field side is illustrated in . Through an extensive analysis of the post-cursor oscillation with 2-D images, the post-cursor case is consistent with the axisymmetric reconnection model used in the full reconnection model. The conclusion is that the crash time of the symmetric 1/1 kink mode in a helically axisymmetric reconnection zone along the toroidal direction (post-cursor case) is an order of magnitude slower than that of the more probable non-axisymmetric crash cases. The helically axisymmetric case is rare due to the dominance of the nonlinear growth of the 1/1 kink mode bounded by q ~ 1 resonance surface.
Figure 14. (a) The 2-D images of the ‘post-cursor’ case at high field side are shown with the time trace of Te to demonstrate that the reconnection time scale is an order of magnitude longer compared to the fast reconnection events (TEXTOR data). Prior to the crash, the 1/1 kink mode is nearly symmetric (frame 1) and partial heat is transported to the mixing zone after the first crash (frame 2). The reconnected field lines of the remnant 1/1 kink mode are clearly illustrated in the frames 3 and 4. (b) The contour plot of Te illustrates that the 1/1 kink mode is connected to the q ~ 1 surface with the reconnected field lines. (c) The measured reconnected field lines of the 1/1 kink mode at the high field side and cold island at the low field side are overlaid on the reconstructed crash model.
Source: Park, H.
Figure 14. (Continued).
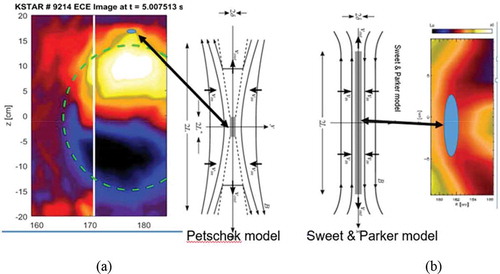
Two distinctively different reconnection patterns are compared in . In the axisymmetric reconnection process of the ‘post-cursor’ case in and , the reconnection zone is long (~7 cm) along the poloidal direction compared to that of the ‘ballooning like’ non-axisymmetric case (<2 cm) () where the reconnection is likely induced at the tip of the ‘finger’ as shown in this figure. This pattern is consistent with the previous data from other devices () including the TEXTOR case (). The slow crash timescale observed in the ‘post-cursor’ case (~8 ms) is consistent with τc of the full reconnection mode whereas the crash time of the dominant fast crash case is much shorter~100μs. The common feature of the cases with the slow crash time is 2-D nature (helically axisymmetric system) while that of the cases with the fast crash time is 3-D nature (helically non-axisymmetric system). The two distinctive cases can be compared with the two well-known reconnection models: Sweet Parker and Petscheck models [Citation48]. Physically the current sheet of the Sweet Parker model much longer than that of the Petscheck model as shown in the middle of these figures. Note that the Petscheck model was introduced to explain a fast reconnection time which cannot be explained with the Sweet Parker model.
Figure 15. (a) The crash event with a fast reconnection time is dominant in sawtooth crashes. They exhibit highly distorted 1/1 kink mode (higher harmonics in poloidal and toroidal planes) and initial reconnection is likely on the tip of the ‘finger’ as shown in the image from KSTAR (examples in ) (i.e., 3-D nature). (b) The crash time of the ”post-cursor” case shown in and , is an order of magnitude slower compared to that of the fast crash cases. The reconnection zone is much wider on poloidal plane and it is toroidally axisymmetic (i.e., 2-D nature). Slow reconnection time case resembles the Sweet Parker model and fast reconnection time case fits to the Petschek model.
Source: Park, H.
4.2. Neoclassical tearing mode (NTM) instability
4.2.1. Brief review of NTM instability
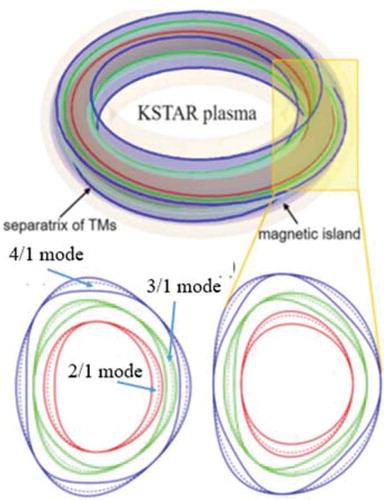
The neoclassical tearing mode (NTM) instability with low m/n mode numbers (m/n = 2/1, 3/1, 3/2, 4/1, 4/2, 4/3, … ., where m and n are poloidal and toroidal mode numbers, respectively) was first discovered on TFTR [Citation76]. These classical internal instabilities not only have a potential of limiting the energy confinement of the core plasma but also can lead to disruption as the plasma beta (β) is further increased, where the β is the ratio of the plasma energy to the magnetic energy [Citation77]. This instability is excited due to lack of helical bootstrap current inside the island (O-point) where the pressure profile is flattened near the resonant rational surfaces (i.e. q = 2,3,4, ...). A schematic illustration of the positions and shapes of these NTMs for KSTAR is depicted in . The physics-based model of NTMs [Citation78] indicates the importance of the trigger (or seed) to form resonant modes with islands. The ‘seed’ that starts the instability often comes from bursts of other MHD activity such as the sawtooth instability. While higher order NTMs are typically less problematic, the 3/1 NTM near the q ~ 3 surface arises at modest plasma β and can limit the increase of the core plasma energy [Citation78]. As the plasma β is further increased, the m/n = 2/1 mode can be excited at the q ~ 2 surface. Onset of this instability imposes a significant limit to the growth of the core plasma energy due to altered cross-field transport in the presence of the island. Often rapid growth of the island above the critical size leads to a slowing of mode rotation in the plasma, with the mode magnetic perturbation eventually locking to the conducting vessel, causing a disruption. Therefore, control mechanisms to maintain the island size below a critical size is essential for high β tokamak operation. NTMs can be linearly stable and nonlinearly unstable and can be controlled with the injection of the current inside the island to compensate for the loss of the helical current inside the flattened island. While control of the 2/1 mode has been empirically successful with the injection of the current in the island using an ECCD system [Citation79,Citation80], the stability physics of the 2/1 mode has complex dependence on various plasma parameters and the cross-field transport has not been comprehensively validated yet. Among them, a comprehensive validation of the stability criteria of the 2/1 instability as well as the modified turbulence critical for the cross-field transport across the q ~ 2 surface in the presence of the 2/1 island, has been attempted in the course of modeling studies. However, it has been a non-trivial problem to solve due to the lack of accurate diagnostics that can measure the dynamics of the 2/1 mode, the modified turbulence distribution and flow shear with adequate spatial and temporal resolutions.
Figure 16. Schematic of the position and shape of the example NTMs (2/1, 3/1 and 4/1) on KSTAR geometry. Two figures of NTMs represent O-point (left) and X-point (right) on the mid-plane, repectively.
Source: G, Kim
The temporal change of the island size is expressed in terms of the classical linear stability index (), which can be positive or negative and the destabilizing term from loss of the helical bootstrap current inside the island. The dynamics of the stability of the 2/1 mode has been described in the framework of the modified Rutherford equation (MRE) as given in Equation (3)
where ω is the island half width, a1 and a2 are flux geometry-related coefficients, rs is the minor radius, τr is the current diffusion time, τs is the resistive time, ε is the inverse aspect ratio, βθ is the plasma poloidal beta, and Lq and Lp are scale lengths of the safety factor and pressure profile, respectively. It is critical to determine the sign of Δ’ and ωc with high confidence in this equation, since the first term containing Δ’ is closely related to the equilibrium current profile, and the second term is the destabilizing contribution stemming from the lack of the bootstrap current inside the island due to the flattened island. The ω is the half width of the island and relatively easy to determine in experiment. When the second term is significant (high poloidal beta and large island), the mode is referred to as a neoclassical tearing mode (NTM) and control of the NTM is critical for high-performance plasmas. Since precise determination of the critical parameters like Δ’ and ωc is key, many experiments have been performed previously with conventional 1-D diagnostics such as ECE and Thomson scattering systems to aid in computing these quantities. However, the results were not conclusive due in part to the lack of spatiotemporal resolution of the data set. To overcome this deficiency of the data for accurate analysis, plasma jogging in a slow timescale was introduced assuming that the jogging does not influence the stability of the 2/1 mode [Citation81]. It is extremely important to determine these two critical parameters (Δ’ and ωc) with confidence so that any deficiencies in modeling can be challenged for various cases for more effective control of the NTM.
It is well known that the presence of the 2/1 mode (i.e. large magnetic islands) degrades (or limits) the plasma stored energy through increased cross-field energy transport [Citation82]. The cross-field transport physics is complex, since the presence of the large island modifies the internal helical magnetic structure and creates fluctuations in 3-D magnetic flux and plasma pressure profile. Recent studies [Citation83,Citation84] indicate that multi-scale interactions between the large scale 2/1 mode and micro-turbulence can be a seed of the island formation and can influence the growth rate of the island non-linearly as well as the enhanced cross-field transport. Here, modified gradients of Te and ne profiles in presence of the 2/1 mode will subsequently modify the distribution of micro-turbulence as well as its flow pattern in the regions surrounding the island such as in the vicinity of O and X points [Citation85,Citation86]. The reduction of the micro-turbulence was measured in the flattened 2/1 island [Citation86] and the importance of the modified flow shear across the 2/1 island was emphasized through measurement of micro-turbulence in the vicinity of the 2/1 island. Also, simulation studies suggest various multiscale interactions between the magnetic island and micro-turbulence via pressure and flow profiles [Citation85]. They are the localized micro-turbulence distribution, poloidal vortex flow around the magnetic island [Citation87], strong flow shear outside the 2/1 island [Citation87–Citation90] and insignificant micro-turbulence level across the O-point region due to small or flattened pressure gradient inside the magnetic island. The turbulence-induced transport is predicted to be significant in close proximity to the X-point [Citation86,Citation87,Citation91,Citation92]. Simultaneous measurements of the micro-turbulence and its flow in two-dimensional (2-D) space are ideal to fully validate the findings of numerical simulations.
4.2.2. What are the new findings in study of the 2/1 instability with the 2-D ECEi system?
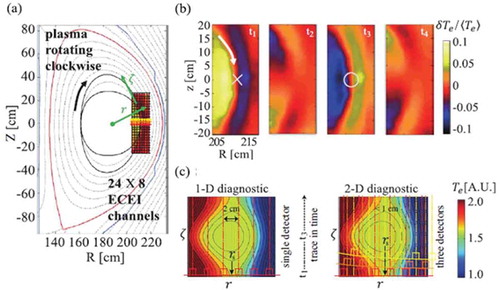
For the validation of theoretical models and smart control of the 2/1 mode, clear and speedy identification of key parameters such as the stability parameter (Δ’) and the critical island width (ωc) of the 2/1 mode. The difficulty in determination of these parameters with confidence may have been largely due to lack of spatial and time resolutions using conventional 1-D data. Therefore, it is important to test if the confidence level can be improved in determining these parameters with 2-D data and the first such attempt was made in a study of the 2/1 mode with 2-D ECEi data on KSTAR [Citation88]. In , the ECEi window is positioned to capture the 2/1 mode and the helical coordinate system (r, ζ) used in analysis is also indicated on the KSTAR plasma in this figure. The measured 2-D images of the electron temperature perturbation (δTe/<Te>) of the 2/1 island together with clear O and X-points with respect to the KSTAR geometry are illustrated in . The 2-D imaging data [~17 cm (radial) x ~ 40 cm (vertical)] consists of 192 channels of Te information that are used for analysis as shown in . In this figure, a clear advantage of 2-D data over 1-D data is demonstrated for analysis of Te distribution inside the island and this is mainly due to high spatial resolution in the vertical coordinate (ζ) not in the radial coordinate (r) owing to the helical geometry and plasma rotation.
Figure 17. (a) The 2-D image consist of 192 pixels (24 x 8) in the vicinity of the 2/1 mode is shown with the equilibrium constructed by EFIT on (R, Z) coordinate of KSTAR. (b) Four images of the 2/1 mode at different phase are plotted as it rotates (see the 2/1 mode in ) with the X-point and O-point as indicated. (c) The effective spatial resolution of Te in (r, ζ) space is significantly improved due to additional vertical data from 2-D data.
Source: Choi, M.J, et al Nucl. Fusion 54, 083010, 2014,
The detailed analysis can be found in Ref [Citation88]. and summary of the results is provided here. The analysis of Δ’ is relatively straightforward and is deduced from the calculated magnetic flux function based on magnetic field diffusion. Since Te inside the island has a strong dependence on the parallel and perpendicular heat transport coefficients as well as the geometric factors of the island with critical width, synthetic Te data are assembled from the modeled Te profile [Citation93] with dimensionless geometric factors and ratio of the parallel and perpendicular transport coefficients. And then statistical analysis between the measured and synthetic 2-D Te data is performed for optimum fits for each parameter sets. It is emphasized that higher spatial resolution is critical in resolving the synthetic Te data with different sets of parameters. As expected, the 2-D data cannot increase the resolving ability in the radial direction, but it can significantly improve the resolving ability in the helical axis utilizing data from other vertical channels and/or time-dependent data. In order to demonstrate a clear advantage of 2-D over 1-D data, seven channels of Te data along the mid-plane was assembled, and the same comparative study was repeated. As illustrated in , the fitted Te data set for geometric factors and transport coefficients with the minimum χ2 () are used to estimate Δ’ and ωc and statistical significance of the fits for sets of parameters in the 2-D modeled Te is significantly better compared to the fits with 1-D data in determination of the stability parameter (Δ’) and critical island width (ωc) as shown in .
Figure 18. Parametric dependence of χ2 from (a) 1-D data fit (black) and (b) 2-D data fit (red) is shown and small χ2 parameter sets are used to evaluate Δ’ and ωc for comparison. (c) Distribution of rsΔ’ and ωc from 1-D data (black) and 2-D data (red) shows that 2-D data set has better confidence intervals in both parameters.
Source: Choi, M.J, et al Nucl. Fusion 54, 083010, 2014.,
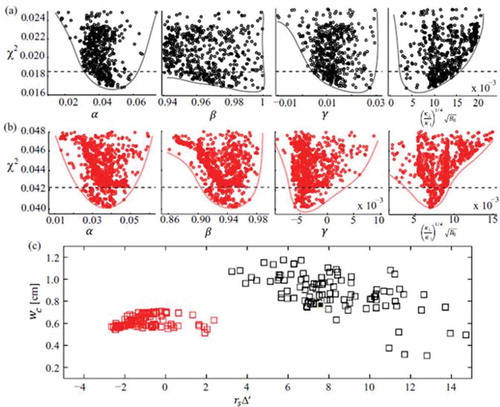
Empirical understanding of the role of macroscopic MHD islands on limiting the core energy confinement as well as leading to disruption has to be supported by the comprehensive physical process of the cross-field transport physics based on modified micro-turbulence in presence of the 2/1 island. In recent years, high-frequency turbulence spectral measurement of Te employing a correlation technique has been routinely performed using 2-D ECEi data on KSTAR. Together with the measured macroscopic MHD fluctuation (i.e. 2/1 island) induced by the resonant magnetic perturbation (RMP), measurement of small-scale turbulences and the 2/1 island has provided an opportunity to study multiscale interaction between the macro-fluctuation and micro-turbulence [Citation94]. The simultaneously measured macroscopic fluctuation of the 2/1 island and dynamics of micro-turbulences in the proximity of the island in a discharge with R0 = 180 cm, a0 = 50 cm, and q95 ~ 4.6 are illustrated in [Citation94]. The 2-D image of the modified Te profile in the presence of the 2/1 island shows a clear-flattened 2/1 island in which the flat profile is supported by the measured Te profile with 1-D ECE and steepened gradient near the O-point on the inner side of the island and no change in gradient near the X-point are shown in . The cross coherence of the Te fluctuation between two ECEI channels is calculated to estimate the coherent fraction of the Te fluctuation and examples are illustrated in . The sum of the cross coherence is plotted in 2-D in this figure. The measured micro-turbulence of Te is highly inhomogeneous around the 2/1 island (i.e. both the inner and outer sides) as shown in this figure. Inside the island, the level of turbulence is almost non-measurable. In the inner side of the island, the turbulence has a broad spectrum, and the level of micro-turbulence is stronger near the X-point and weaker near the O-point in spite of the steepened gradient at the O-point side as shown in this figure. This observation suggests that there are other mechanisms for this strong asymmetry in turbulence level, since the turbulence level should be higher at the steepened gradient region. On the outer side, the observed spectrum is narrow, and the level of turbulence is higher near the X-point. On the other hand, the measured flow speed of the micro-turbulence is striking as shown in . Here, the cross phase of two adjacent ECEI channels is calculated to measure 2-D flow velocity in the laboratory frame as shown in this figure. The observed poloidal flow of the higher frequency spectrum is in the electron diamagnetic direction on the inner side and that of the lower frequency spectrum is in the ion diamagnetic direction on outer side of the island as shown in cross-phase analysis. More importantly, the level of poloidal flow shear, which mostly results from the ExB flow shear, is increasing towards the O-point. This is the opposite trend to that of the fluctuation level (i.e. the fluctuation level is strongest near the X-point rather than the O-point). The strong flow shear near the O-point may be responsible for the insignificant fluctuation level at the O-point. Over the critical values of vortex flow and fluctuation level, the 2/1 island becomes a transport channel of the electrons and can lead to a disruption eventually.
Figure 19. (a) The measured 2-D image of the 2/1 island induced by RMP is shown with the flattened Te profile inside the island. Separatrix with X and O points is shown in purple dotted lines and flattened Te profile is supported by the measured Te profile with 1-D ECE. (b) Examples of cross coherence of the Te fluctuation obtained using pairs of vertically adjacent ECEI channels inside the island, inner side and outer side of the 2/1 island are shown together with the summed coherence 2-D image. The fluctuation level is higher at X-point than at O-point. (c) The cross phase between two vertically adjacent ECEi channels measured inner and outer regions of the 2/1 island is shown. The 2-D pattern velocity is measured using the coherent cross phase. The observed flow is stronger near the O-point than that of the X-point.
Source: Choi, M.J., et al Nucl. Fusion 57, 126,058, 2017, , , and
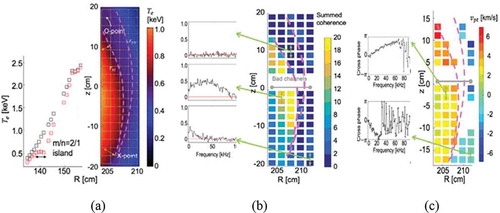
Global gyrokinetic simulations were carried out to understand the underlying physics of the measured anisotropy of the micro-turbulence and strong flow shear in presence of the stationary 2/1 island [Citation95]. The global equilibrium E x B flow perturbed by the 2/1 island was calculated using XGC1 code [Citation96] as shown in . Here, the E x B flow is significantly enhanced in the presence of the O- and X-points of the 2/1 island. It was found that the flow shear is maximum and minimum near the O- and X-point of the island, respectively. From global micro-instability analyses using the gKPSP code [Citation97], it was found that the collisionless-trapped electron mode (CTEM) and the ion temperature gradient (ITG) mode could be excited around the island as shown in . This is quite consistent with the measured high frequency (CTEM) and low-frequency spectrum (ITG) with opposite rotation direction. However, due to the strong shear of the E x B flow, a significant portion of the CTEM is suppressed in the region near the O-point as shown in . On the other hand, the flow shear around the X-point is not strong enough to stabilize ambient instabilities, which is consistent with the experimental measurements shown in .
Figure 20. a) The perturbed equilibrium potential calculated from XGC1 code in presence of the 2/1 island (b) the contours of micro-instabilities (TEM and ITG) around the magnetic island in the outer mid-plane are shown, and (c) comparison of the ExB shearing rates at the O- and X-point of the magnetic island and the growth rates of the micro-instabilities are illustrated. These results are consistent with the experimental results.
Source: Kwon, J-M. et al Phys. of Plasma, 25, 052506, 2018
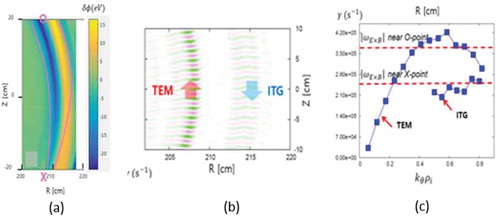
4.3. Alfvén eigenmode instability
4.3.1. Brief review of the Alfvén eigenmode instability
The Alfvén wave instability is a widely known phenomenon in laboratory, solar and space plasmas [Citation98,Citation99]. Alfvén waves in the plasma can be destabilized by the presence of resonating energetic particles. The energetic particles comes from various sources: accelerated ions and electrons from coronal mass ejection (CME) through magnetic reconnection processes in space and fast ions by heating systems [radio frequency (RF) and neutral beam injection (NBI)] in tokamaks. The Alfvén eigenmode instability [Citation99] driven by fast ions are routinely observed in present tokamaks. This instability is particularly important for ITER and future fusion reactors, since the substantially increased fusion products such as 3.5 MeV α-particles in the core of plasmas can drive these instabilities and the transport of the α-particles can be significantly enhanced, thereby leading to losses of the heating source. A variety of mode structures such as the reverse shear Alfvén eigenmode (RSAE) [Citation98] and toroidal Alfvén eigenmode (TAE) [Citation98] have been extensively studied, and theoretical modeling is well advanced for tokamak plasmas. Full understanding of the physics of Alfvénic instabilities is important for advanced modes of operation where the current profile is likely reversed and energetic ions are abundant. Therefore, a detailed validation process is essential to avoid the deleterious instabilities and/or develop preemptive control of them. In the validation process, measurement of the spatial extent and related dynamics of the eigenmode structure in the core of the tokamak plasma are extremely important. The 2-D ECEi system can be an ideal validation tool for these instabilities.
4.3.2. What are the new findings in the study of Alfvén mode instabilities with the 2-D ECEi system?
Studies of Alfvén eigenmode instabilities using 2-D ECEi systems were performed in both ASDEX-U, Germany [Citation100] and DIII-D, USA [Citation101] tokamak plasmas. Here, the plasma condition ideal for the RSAE and TAE is in the early stage of the discharge where the current profile is reversed, since penetration of the ohmically driven current is relatively slow. In order to destabilize the Alfvén eigenmode, early injection of the heating beam was introduced producing abundant fast ions in the core of the plasma. The fast-ion dynamics, which induce measurable modifications to the 2-D structure of RSAE and TAE instabilities were studied with the 2-D ECEi system. Since the electron temperature fluctuation amplitude of these eigenmodes is extremely small (~2.5 eV where the background plasma is ~500 eV), signal enhancing techniques such as singular value decomposition (SVD) and Fourier decomposition were employed to eliminate uncorrelated noise.
As illustrated in ,, the measured 2-D images of RSAE structures at two different times (α and β) show two different mode numbers with distinctive spatial extents on ASDEX-U. Similar measurement was obtained in DIII-D, and an initial validation was carried out with the NOVA code [Citation102] which is an ideal MHD code. The characteristics of the RSAE, such as the location, amplitude, frequency and mode number (n = 3) were in good agreement with the measured RSAE as shown in ,. Note that the maximum amplitude of this instability is located at the minimum q, -qmin-, position of the reversed-shear q profile. With improved signal level and data analysis, the measurement revealed spiraling (poloidal shearing) of the tail of the mode in the ion diamagnetic direction as shown in . The NOVA code failed to reproduce this spiraling tail which is the poloidal shearing effect due to fast ions. Since the effect of fast ions is not included in NOVA, an ideal MHD code utilizing a perturbation approach, the non-perturbative gyro fluid MHD code, TAE/FL [Citation103] was introduced. The simulation of the instabilities in TAE/FL at the corresponding toroidal mode number, n = 4 is compared with the experimentally obtained mode structures in ,. As shown in this figure, the radial localization and extent of the mode observed with the 2-D ECEi system is in excellent agreement with the simulation results including the spiraling tail. More simulation was carried out and each RSAE structure is dominated by a single poloidal mode number, m, which is positively identified in each case. The most distinguishing feature of the mode shown in this figure is a distinct poloidal shearing or ‘spiraling’ that was missed by the NOVA code. This mode shearing occurs as the regions at greater minor radius (observed on the outboard mid-plane) are shifted in the ion diamagnetic drift direction. Also, a discrepancy in mode frequency between the simulation and measurement arises due to the omission of compressibility in the simulation model. The difference is found to be consistent with the geodesic acoustic shift of the Alfvén continuum. This is an excellent example of how improved modeling improves the validation process along with the critical 2-D imaging data.
Figure 21. (a) Radial eigenmode structures for the RSAE are captured with the ECEi system on ASDEX-U. 2-D mode structure for two different times shows different toroidal mode numbers. (b) The measured RSAE on DIII-D is quite similar to those in ASDEX-U and is compared to simulated mode structures obtained with the ideal MHD code, NOVA. The improved 2-D image of the RSAE revealed shearing of the Alfvén eigenmode structure which cannot be described by NOVA. The fluctuation phase reveals an outward spiraling is well represented in the non-perturbative code, TAE/FL, where the effect of fast-ion dynamics is included in the 2-D eigenmode structure. Difference in frequency is due to omission of compressibility in modeling.
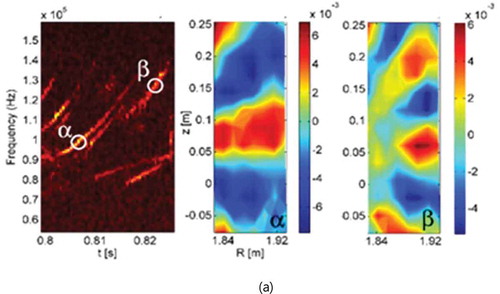
Figure 21. (a) Classen, I.G.J., et al Plasma Phys. Control. Fusion 53, 124,018, 2011. (b) Tobias, B., et al Phys. Rev. Lett. 106, 075003, 2011.
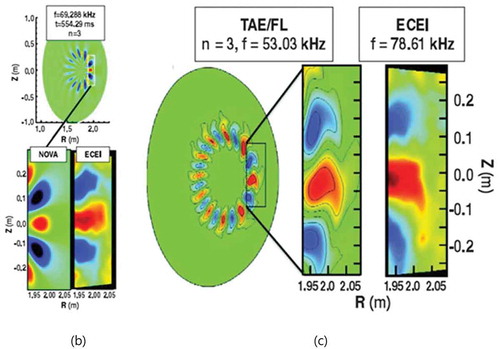
4.4. Edge localized mode (ELM) instability and suppression of the elm-crash by the resonant magnetic perturbation (RMP)
4.4.1. Brief review of the ELM and suppression of the ELM-crashes
The non-linear ‘edge-localized mode (ELM)’ instability is known as a periodic bursting event observed routinely in edge region of the H-mode plasmas (higher confinement mode) with the instability driven by high pedestal pressure gradient due to the formation of an edge transport barrier as schematically illustrated in . The transient heat and particles from partial collapse of the edge pedestal pressure are rapidly transported to open field regions. As the edge pressure gradient is reduced, the edge pedestal height is lowered and loss of the core plasma energy follows as shown in . The expelled transient high heat and particle flux can damage the divertor plates and first wall materials. Therefore, the ‘ELM’ in the H-mode plasma has drawn great attention and there are many research papers on both experimental and theoretical studies [Citation104,Citation105]. Especially, the impact of the transported transient heat and particles in large devices like ITER and comparable reactor devices could be detrimental to the first wall and divertor. Development of adequate control tools to mitigate, suppress and/or eliminate the ‘ELM’ instability has been actively pursued.
Figure 22. (a) The H-mode plasma with high edge pedestal formed by the transport barrier is shown with the cross-section of the plasma with divertor where the heat from ‘ELM’ follows the magnetic field lines. (b) Due to burst of ‘ELM’, the edge pressure/current gradients are reduced and loss of the core plasma energy is followed during ‘ELM’ event. After ‘ELM’ event, pressure/current profile recover.
Source: Conner, J.W. www.ccfe.ac.uk/assets/Documents/AIPCONFPROC103p174.pdf
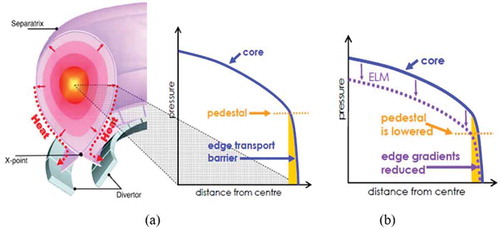
The ‘ELM’ event regulates the edge plasma pressure through repetitive non-linear bursting events and study of ‘ELMs’ has relied on Dα light measurements in the divertor region as a measure of the ‘ELM’ onset and certain mode characteristics. Note that the rapidly transported plasma particles interact with neutral particles near the divertor plates, and Dα lights are subsequently emitted. Various ‘types’ (i.e. type I-V, grassy, etc.) of ‘ELMs’ have been empirically categorized based on the frequency and amplitude of measured Dα lights. In general, the type of ‘ELM’ changes from grassy (i.e. tiny bursts) to type-I (i.e. large burst with a low frequency) as the plasma energy is increased with increased auxiliary heating power. Variations in ‘ELM’ types are observed as the edge condition and plasma shape (i.e. triangularity and elongation) are changed [Citation105]. For instance, the type-I ‘ELM’ is characterized as a ballooning mode type due to the fact that the observation has been made mainly near the ballooning limit with no clear precursor prior the crash. On the other hand, type-III ‘ELM’ is shown to have a precursor and is classified as a resistive mode, since it has been observed in highly collisional plasmas. This difference between type-I and III can be compared to the sawtooth crash with precursor (tearing type) and without precursor (kink type).
The underlying physics of the ‘ELM’ has been suspected as a crash event of a rapidly growing ideal MHD mode with intermediate to high toroidal mode number (with a coupled poloidal mode spectrum) at the pedestal region of the plasma. A strong collisionality dependence of the ‘ELM’ dynamics may suggest that the nature of the ‘ELM’ may be a resistive rather than an ideal MHD mode. These high m/n modes are suspected to be driven by the steep pressure gradient and/or strong bootstrap current at the pedestal region of the plasma. The physical understanding of this instability has been largely through empirical experiences, since the nature of the eigenmode structure (e.g. spatial and temporal extent of clear m/n mode numbers) and corresponding dynamics have not been sufficiently diagnosed until recent years. Meantime, the ‘peeling and ballooning’ mode model [Citation106,Citation107], based on two driving energy sources for this instability have been developed: the edge pressure gradient and current density due to ohmic and bootstrap current at the edge, respectively. This model qualitatively has explained the stability boundary of the ‘ELM’ in a space spanned by the parallel current density and pressure gradient near the plasma edge as shown in . As the edge plasma pressure builds up by the applied heating power, the point moves along α-axis (pressure) close to the critical value (αcritical) (path 1 in this figure). Slow increase of the current density brings the point along the ballooning limit to the peeling-ballooning limit (path 2 in this figure). When the point crosses to the unstable region, a crash occurs, with a partial loss of the pressure and current, and returns to the stable region where it started (path 3 in this figure). Validation of this model has been attempted with the ballooning and peeling boundary determined by the experimental data and modeled mode numbers with various assumptions. The extensive validation results of this model can be found in references [Citation106,Citation107]. Note that many critical parameters such as bootstrap current and pressure gradient are non-trivial to be measured and validated dynamics of the internal MHD modes are limited.
Figure 23. Schematic presentation of the peeling-ballooning mode model: as the plasma edge pressure is increased with the heating power, the point is moving along the blue arrow (α-axis) until it reaches the ballooning boundary. Then slowly increasing current moves the point along the ballooning boundary (red line). As it hits the peeling-ballooning limit, crash occurs and loses edge pressure and returns to the initial position (green line).
Source: Conner, J.W. www.ccfe.ac.uk/assets/Documents/AIPCONFPROC103p174.pdf
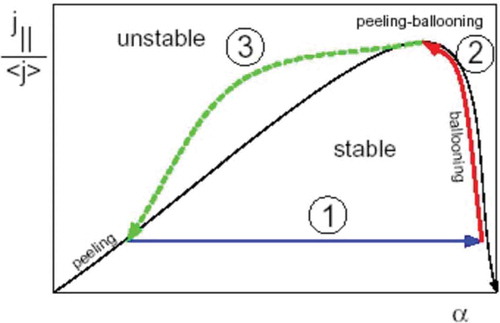
If the ‘ELM’ is based on ideal or resistive MHD modes, the modeling should be developed based on linear and non-linear dynamics of these modes through a step-by-step validation procedure. Then, building physics model of the transient crash and transport mechanism of the heat and particles to divertor is the next step. The advent of fast camera systems has provided an opportunity to study the fast phenomena like the ‘ELM’. Here, fast-moving global filamentary structures such as created by the non-linear time evolution of the high m/n modes with a hint of fast transport event such as magnetic reconnection process [Citation108–Citation110] are captured by the camera in MAST as shown in . Study of the ‘ELM’ based on filamentary mode structure was a significant step forward, since prior studies had been largely based on Dα light spikes observed in the divertor region as discussed in the previous section. These did not provide visualization of the filamentary structures formed in the non-linear evolution period. Note that the captured filamentary structure is generally aligned along the helical magnetic field line and is also based on Dα lights from the interaction between the radially moving filaments and neutrals at the scrape-off layer (SOL) region (outside of the separatrix). It is interesting to note that the filamentary structures are present in the inter-‘ELM’ period and L-mode and ‘ELM’ phase with the intensity increasing as the mode number is lowered from the inter-‘ELM’ period, L-mode to the ‘ELM’ phase as shown in [Citation108]. Note that there was early observation of the filament structure on COMPASS-D, UK [Citation111]. The COMPASS-D had low error field comparable to that of KSTAR. The dynamics of the filamentary structure with well-defined mode numbers are better physical quantity than Dα lights from divertor region to build the physics basis of this instability. Ultimately, it is important to identify the internal mode structure and its linear and nonlinear behavior to properly implement MHD physics models. Here, the 2-D ECEi system can be instrumental, if the internal edge mode structures can be identified through measurement.
Figure 24. The filamentary structures captured by the fast camera with high toroidal mode numbers in MAST. The fast camera image is the image of the Dα light from interaction between radially moving filament structure and neutrals in the outside of the separatrix. The filamentary structure exists in the (a) inter-ELM-crash period, (b) L-mode phase, and (c) ELM-crash phase. The intensity of the mode is plotted on the toroidal plane and mode number moves from high to low as the intensity of the filament is increased.
Source: Ayed, N. B. et al, Plasma Phys. control. Fusion, 51, 035016, 2009
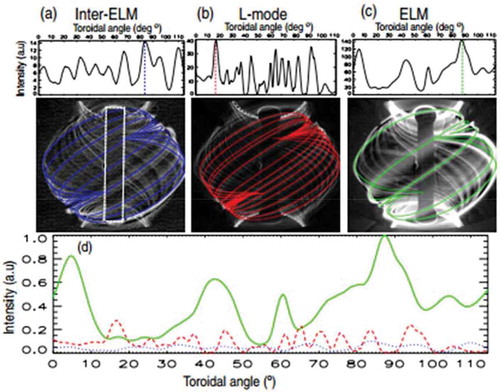
As noted before, large ‘ELM’ energy bursts in present research devices (reaching 6% of the total plasma stored energy) may not be detrimental but the transient heat and particles in an ITER-size device should not be underestimated. To reduce the risk to ITER operation, active mitigation, suppression or elimination of the ‘ELM’ without significant loss of confinement is essential. Many methods of mitigation or suppression have been pursued with external tools that can regulate the pedestal pressure such as the resonant magnetic perturbation (RMP) [Citation112–Citation114], pellets [Citation115,Citation116], magnetic control [Citation117] and supersonic gas injection [Citation118] together with control of the plasma separatrix strike points on the divertor plates, plasma shaping factors, etc. Essentially, all these external tools have been tested to regulate the edge pressure gradient/current so that the growth of unstable modes is maintained below the threshold level. Among external control tools, the RMP method was applied for control of the ‘ELM’ on the DIII-D tokamak for the first time and was demonstrated to be very effective in suppression and/or mitigation of the ‘ELM’ in a narrow plasma operation space [Citation119]. Here, the conjecture was that the stochastic magnetic islands, induced by RMP coils with n = 3 or n = 4 toroidal modes in the pedestal region of the plasma, might enhance radial transport of the plasma pressure effectively reducing the edge pedestal pressure gradient so that the unstable mode is maintained below the threshold level. However, details of the RMP configuration for optimum penetration and the nature of the stochastic magnetic islands in the presence of the plasma are not clearly understood yet.
As ITER operation is near and design of future fusion reactors is presently based on H-mode operation, active research on control of the ‘ELM’ has been carried out using RMPs in various devices and results have been quite promising. Most of the perturbation experiments have been carried out with high toroidal mode numbers (n > 2) due to fear that deeper penetration of the perturbed field at lower toroidal mode numbers (n = 1 or 2) could provide a seed for destabilizing internal MHD instabilities such as the sawtooth and NTMs in the core of the plasmas. The three rows of in-vessel control coils (IVCC) with n = 1 and/or n = 2 toroidal mode numbers are used for suppression of the ‘ELM’ on KSTAR [Citation120]. ‘ELM’-free H-mode operation of a plasma with a pulse length over ~30 s was produced [Citation121]. However, the operation window of the ‘ELM’ suppressed regime is quite limited and efforts to expand the operating window have been largely empirical. Recently a successful suppression experiment with a pre-designed polar diagram, calculated with IPEC code including the plasma response model, spanned by the amplitude and phase of RMP coils has been conducted [Citation122]. Here, one can select the amplitude and phase of RMP coils to operate in the region where suppression of the ‘ELM’ is expected for given RMP coil configurations for a specific helicity and set of physical parameters.
The first RMP experiment [Citation112] introduced stochastic islands that may be responsible for suppression of the ‘ELM’ and a magnetic perturbation model with only the vacuum response may not be sufficient. Inclusion of the plasma in the model is essential. Therefore, it is important to measure the response of applied RMPs. In a recent DIII-D experiment, a substantial increase of long wavelength density turbulence was observed by the beam emission spectroscopy (BES) diagnostic during the ‘ELM’-suppressed period under an applied RMP and the radial extent of the turbulence increased to r/a = 0.6 [Citation123]. In another experiment, a sudden bifurcation of the perpendicular electron flow to near zero was suggested as a physical mechanism for suppression of the ‘ELM’ from a mitigated state using the n = 2 RMP configuration [Citation124]. The role of RMPs in control of the ‘ELM’ can be divided in two stages: the first stage is preparing the optimum condition to couple in the magnetic perturbation induced by the IVCC configuration as demonstrated in construction of the polar diagram [Citation122]. The second stage is to explore the mechanism from the ‘ELMing’ state to the mitigated or suppressed state through interaction between the filamentary mode structure and magnetic perturbation induced by the RMP. Therefore, it is important to clarify the relationship between the growth/decay of the filamentary structure, turbulence induced by RMP and enhanced particle transport near the pedestal (i.e. density pump out).
Up to now, the term ‘ELM’ represents the bursting event rather than the mode itself, because the study of this instability started based on measurements of transient Dα lights near the divertor region assuming that the explosive growth of the edge-localized mode (ELM) is responsible without knowing the internal ELM dynamics. Then, the fast camera revealed the filamentary mode with clear mode structures. However, the images captured by the camera are based on Dα light from outside of the separatrix where the radially displaced mode interacts with neutrals at the SOL region. The 2-D ECEi system is capable to measure the dynamics of the ELM near the pedestal region, and the term ELM represents the mode itself and the ‘ELM-crash’ will be used in remainder of the paper to mean the ‘ELM’ in order to avoid the confusion.
4.4.2. What are the new findings in the study of the ELM and suppression of the ELM-crash by RMP with the 2-D ECEi system?
The KSTAR plasma is ideal for studying the ELM dynamics and role of RMPs in suppression/mitigation of the ELM-crash, since KSTAR is equipped with three unique features and capabilities [Citation121]; 1) a higher degree of symmetry of the tokamak plasma compared to other devices due to small intrinsic error field (approximately an order of magnitude lower error field compared to the tokamaks) and low magnetic ripple [Citation125], 2) three rows of IVCC coils with the n = 1 and n = 2 toroidal mode numbers to use for the application of magnetic perturbations [Citation122], 3) and an advanced 2-D ECEi system to study response of the magnetic perturbation [Citation45]. As H-mode operation has been achieved on KSTAR, the 2-D ECEi system has been devoted to study instabilities at the plasma edge. As we discussed in the previous diagnostic section, interpretation of the ECE signals from the edge plasma may need special attention, since the optical thickness at the edge rapidly changes due to the steep density gradient in that region. Prior to the KSTAR experiment, 2-D ECEi system was applied to the edge physics study on ASDEX-U [Citation126] and DIII-D [Citation127].
In KSTAR experiments, a coherent mode structure near the pedestal region was detected with self-consistently determined toroidal mode numbers during the inter-ELM-crash period. An example of the ELM with n = 8 toroidal mode number is shown in [Citation128]. Here, the 2-D image of the ELM and position of the ECEi window are marked on the KSTAR geometry () together with Dα light from the outer divertor region () and spectrogram of one of the ECEi channels (). The eigenmode structure of the n = 8 toroidal mode number is calculated with the resistive MHD code (BOUT++) using a reconstructed plasma equilibrium at the time when the mode was measured as shown in [Citation128]. It is striking that the shape of the observed ELM in is quite different from the simulated mode structure in . In order to understand the apparent discrepancy, a synthetic image of the calculated eigenmode is constructed accounting for the intrinsic spatial resolution of each pixel as shown in . Here, even the down-shifted images of the mode are shown in the far-right corner of this figure. Then, the background noise of the detection system is added as shown in . The final synthetic image in is directly compared with the measured one in . The discrepancy between the measured ELM radial width (~3 cm) and the simulated one (~1 cm) is understood based on the instrumental broadening of the present KSTAR ECEi system when the objects measured are smaller than the system resolution. Note that there is no loss of resolution in the poloidal direction, since the mode size is much larger than the vertical resolution (~2.5 cm).
Figure 25. (a) The position of the ECEi window (black box) and sight of the Dα light (green line) are depicted on the calculated equilibrium flux surface. The separatrix (or last closed flux line) is in red line. (b) The captured image of the ELM with n = 8 is shown with the separatrix (red line). (c, d) Dα spikes shown together with the spectrogram of one of the ECEi channels. The arrow sign in (d) indicates the time when the image was taken.
Source: Kim, M. et al Nucl. Fusion 54, 093004, 2014
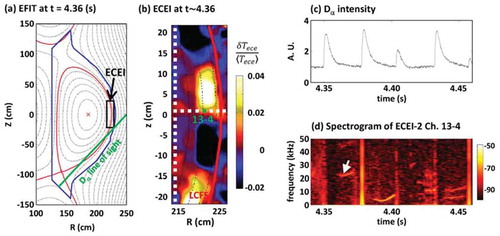
Figure 26. Identification of the measured ELM with synthetic image of the simulated edge localized eigenmode by (BOUT++). (a) Calculated eigenmode with n = 8 for the plasma equilibrium is shown, (b) Synthetic ECEi image is shown with the mirror image of down shifted spectra, (c) Background noise of the ECEi system is added, (d) The measured image of the ELM to be compared with (c).
Source: Kim, M. et al Nucl. Fusion 54, 093004, 2014
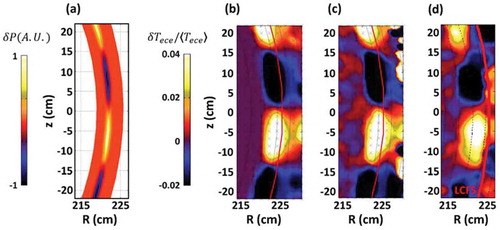
Based on the clear validation of the ELM structure at the edge of the KSTAR plasma, the time evolution of the ELM cycle from growth to the crash has been studied and an example is illustrated in [Citation129]. As shown in this figure, multiple modes are growing at the initial stage and the dominant mode is immediately saturated before the crash as it is rotating in the counterclockwise direction as depicted in . At the time of the crash, the images of multiple bursting processes of the filament are shown in ,c. The bursting behavior resembles a local magnetic reconnection event that we observed in the non-axisymmetric reconnection event of the sawtooth instability (earlier section of this paper). Two examples of a single filament structure with a size less than ~3 cm is evolving in time. As they rotate in the counter-clockwise direction, both filaments are slightly enlarged and elongated. The changes in size and elongation can be real, since the radial and vertical resolutions are ~1.2 cm and ~1.0 cm, respectively. The images are constructed based on the interpolation of each pixel due to the antenna pattern overlap between channels (~30%). Also, the optical thickness may not be changed as the background plasma pressure would be almost constant during ~25μs. However, it is difficult to resolve the local reconnection event as we have seen in the sawtooth crash case due to a limited size of the filament, but a clear bursting of the filament is illustrated in these figures. It is also common to observe the ELM-crash with a toroidal mode number in the range n = 4 ~ 20 in KSTAR. In general, the toroidal mode number of the ELM filament is changing from high to low (e.g. n = 11 to n = 4) as the amplitude of Dα spike is increased. Qualitatively, the observed mode structure is consistent with the filamentary structure from the fast camera illustrated in . Another important transient event is observation of the solitary perturbation [Citation130] before the ELM-crash event. This mode is a localized filament with a low mode structure (i.e. n = 1). The solitary perturbation appears together with a quasi-steady mode (QSM) in the inter ELM-crash (n ~ 7), and the rotation direction is opposite each other. This solitary perturbation has been rarely observed, and it is premature to connect this event to the crash physics of the ELM at this point.
Figure 27. (a) Simultaneous emergence and growth of multiple ELM filaments (shot no. 4431) in a rotating system in counterclockwise direction (white arrows). The arrows follow the same filament illustrating the counterclockwise rotation. Multiple bursts of the same filament in a large ELM crash event indicated in the time trace of ECEi. (b) First in the series of four bursts. Bottom left sketch depicts the flux surface with filamentary perturbations and the burst zone entering the ECEi view (yellow). The white box arrow indicates the flow velocity of the filaments. (c) Third burst of the same filament, 150 μs later. The sketch above is the corresponding model. In each example, the bursting filament develops a narrow fingerlike structure bulging outward.
Source: Yun, G., Phys. Rev. Lett., 107, 045004 (2011)
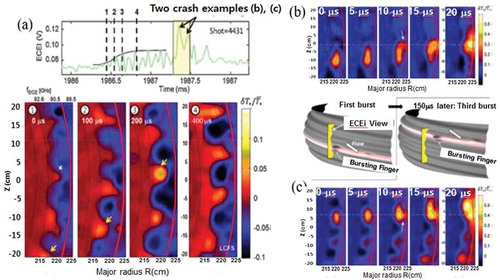
If the physics of the ELM and ELM-crash is based on the peeling-ballooning mode model, it would be expected to find that the mode strength as well as the localized bursting would occur on the low field side. While a majority of experiments focused on measuring the low field side of the plasma, two imaging stations were simultaneously deployed to both high and low field sides at the edge of the plasma to study the ELM dynamics on the same flux surface as illustrated in . The simultaneously observed 2-D images of the ELM on the high and low field side during inter ELM-crash period are depicted in this figure and the timing of this measurement is ~0.5 ms before the crash. There are three distinctive observations in this study: First, the observed mode intensity at both the high and low field side is comparable. This is inconsistent with the simulated results from MHD codes such as the BOUT++ code and M3D-C1 in which the simulated intensity of the mode at high field is an order of magnitude weaker than that at the low field side due to the ballooning nature of the ELMs. However, the recent numerical simulation from the kinetic code, XGC, produced a comparable ELM mode strength at both high and low field side [Citation131]. Further study is needed to clarify the different results between the MHD and kinetic simulation codes. On the other hand, this result is striking but it is not surprising, since the classical ballooning mode model for the sawtooth instability failed to explain the observation of the crash on the high field side as reported in sawtooth instability section. Note that difference of the magnetic pressure between high and low field side in the sawtooth case is much smaller than in the ELM-crash case due to the dependence of the magnetic field strength on major radius. Second, the observed poloidal wavenumber of the ELM at high field side is almost twice lower than the expected poloidal wavenumber on the same flux surface corresponding to that of the low field side as shown in white lines in this figure. This may suggest that the eigenmode at the low field side can be different from that of the high field side due to the different boundary conditions. Third, the observed rotation direction was opposite each other with different speed. The mode is rotating in clockwise direction on the low field side while it is rotating in counter-clockwise direction on the high field side. This non-intuitive observation may come from an asymmetry of Er at the high and low field sides, since the observed rotation is a combination of Er x B, drift velocity, drift velocity and phase velocity of the mode. So far, the physics basis of the ELM is still in an infant stage, and dynamics and global behaviors of the observed eigenmode in the ELM cycle will provide an opportunity to establish an improved basis of the ELM physics.
Figure 28. Observation of the ELM at both high and low field side of the plasma. The position of windows is depicted on the KSTAR geometry. The intensity of the ELM at both sides is similar and this is inconsistent with the ballooning mode model. The mode number is not consistent with the global ELM structure (white line is the same mode structure at high and low field side). Rotation direction is opposite each other with different speed.
Source: Park, H
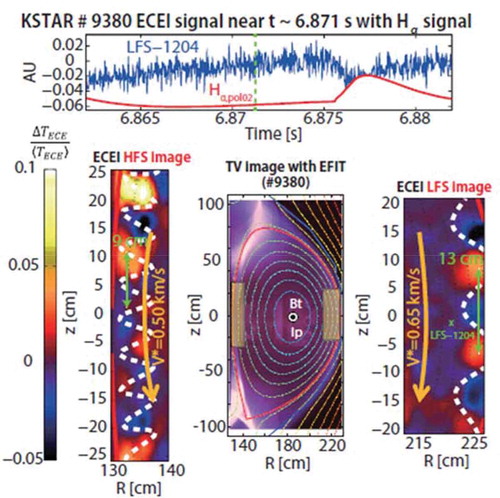
Without a fundamental physics basis of the non-linear ELM dynamics, understanding of RMP dynamics in suppression of the ELM-crash may be premature. Empirically the RMP has been very effective in suppression and/or mitigation of the ELM-crash as described in the previous section. For instance, predictive design of the operation window for the ELM-crash suppression based on the amplitude and phase of RMP coils [Citation120] is quite encouraging but the recipe is not universal yet. The essence of this design suggests that the modeling has to account for the presence of the plasma in modeling of the RMP-induced suppression. In general, when the ELM-crash is mitigated by the RMP, edge density pump-out is followed and the pump-out is less from the mitigation to the suppression phase. At this stage, it is important to clarify the role of turbulence in the growth/decay of the ELM amplitude and enhanced transport of the edge density so that an appropriate transport physics model can be applied to minimize the loss of edge pressure due to density pump out while the suppression period is sustained. If the observed turbulence is in response to the RMP in presence of plasmas, non-linear interaction between the ELM and turbulence can slow down growth of the ELM below the threshold level. At the same time, turbulence can enhance the radial transport of plasma density. Note that a wide spread of the density turbulence, while the RMP is active, has been reported [Citation123] as discussed in an earlier section. However, identification of the observed turbulence is challenging, since the characteristics of the measured turbulence of ne, and Te, and magnetic turbulence is quite similar to each other in the wavelength and frequency space.
In an early experiment on the ELM-crash suppression using RMPs on KSTAR [Citation132], as the RMP was applied, the ELM structure was not changed immediately but the change in toroidal mode number (from n ~ 15 to n ~ 20) is notable with marginally stable phase as shown in the last image in . The time history of the sum of the broadband turbulence (~30–70 kHz) and the coexisting eigenmode (ELM) (~5–30 kHz) is plotted as the RMP current is ramped up as shown in . It is interesting to note that the RMP is ramped up with a fast ramp-up timescale (~0.2 s) but the sum of the broadband turbulence in response to the RMP is slowly increasing while the ELM (not ELM-crash) amplitude decreases on a similar timescale as illustrated in this figure. This observation may suggest that penetration of the magnetic perturbation from the applied RMP is slower than the particle transport timescale. If the slowly increasing turbulence level drains the energy of the ELM eigenmode through cross interaction between the turbulence induced by RMP and the ELM, the timescale of the decreasing Da spike amplitude should occur in a similar timescale but the suppression occurs as the fast ramp-up is completed. The fact that the toroidal mode number of the inter-ELM period is changed from n ~ 15 to n ~ 20, implies that the ELM has been marginally unstable. The growth of the ELM may have been slightly above the threshold level and small increase of the turbulence could drain the energy of the ELM and suppress the ELM-crash.
Figure 29. (a) The time trace of the fast RMP current ramp up plotted with the Dα light. 2-D images of the ELM before, middle and after the RMP current ramp up during the ELM-crash suppression experiment are illustrated. After suppression, the toroidal mode number is shifted from n ~ 15 to n ~ 20 and the ELM become marginally stable. (b) The time traces of the slowly decreasing integrated spectral powers of the ELM (blue; 5–30 kHz) and slowly increasing turbulence level (red; 30–70 kHz) along with the RMP coil current (gold) are shown.
Source: Lee, J. et al Phys. Rev. Lett. 117, 075001 2016
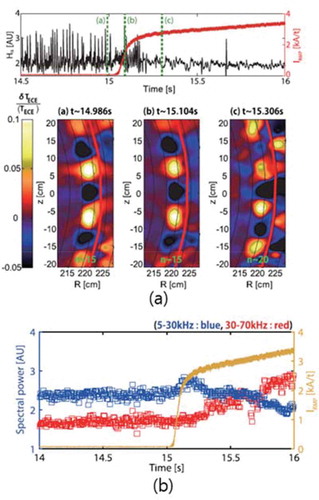
In a recent experiment for further study on the role of the turbulence as a suppression mechanism of the ELM-crash, the RMP current is ramped up and down slowly in a timescale comparable to the magnetic diffusion timescale (τmd ~ 2 s) for the edge plasma parameters as shown in . The amplitude of the sum of the turbulence spectra from the inter-ELM-crash period is increased almost linearly with the RMP current while the amplitude of Dα light spikes (i.e. ELM-crash) is decreasing linearly until the suppression time. The perpendicular electron flow speed is suddenly dropped when the ELM-crash is suppressed. The sudden bifurcation of the perpendicular electron flow is consistent with the previous observation in Reference [Citation124] where magnetic signals have been used to address the electron flow. Note that direct measurement of turbulence is used to address these issues in KSTAR for the first time. Since the poloidal flow speed is likely dominated by the Er x B term, it is logical to conclude that the sudden change of the perpendicular flow speed has to do with the change of Er. It is important to separate this effect from the Er x B physics of the H-mode near the pedestal region which is extremely narrow [Citation133]. As the RMP current is ramped down, amplitude of the turbulence has a long-time delay before it starts decreasing. At about the same amplitude of the turbulence when the ELM-crash was suppressed, the ELM-crash (i.e. Dα light) and perpendicular flow speed return at much higher intensity of Dα light. Does this implicate recovery of the Er x B? If the sudden bifurcation of the electron flow speed is associated with the Er change [Citation133], it is reasonable to conclude that the time history of the turbulence is not correlated with that of Er. As shown in , the time evolution of the observed turbulence on poloidal plane shows that the level is increasing with broad spectra as it approaches to the flat top of the RMP current ramp-up phase. On the other hand, the radial spread of the turbulence is only shown as the poloidal turbulence is saturated. This observation suggests that the turbulence induced by the RMP is radially very narrow (~5 cm) and the spread only occurs when the penetration of the magnetic perturbation is fully saturated. More experiment should be conducted to clarify these issues such as the coupling efficiency of the magnetic perturbation, role of the turbulence in enhanced transport of the electron density and nonlinear interaction with the ELMs.
Figure 30. The ELM-crash suppression experiment with a slow RMP current ramp up and down time scale (green) comparable to the magnetic diffusion time scale (~2s) for the KSTAR edge plasma parameters. (a) The intensity of Dα spikes is linearly reduced as the amplitude of the broadband turbulence is linearly increased with the RMP current ramp up while the perpendicular flow speed of the turbulence suddenly dropped to minimum at about the same time when the ELM-crash is suppressed. The decay of the turbulence level is significantly delayed as the RMP ramp down is started and Dα spikes returned when the amplitude of turbulence dropped to the level where the suppression was started and the perpendicular rotation is increased suddenly. (b) The coherence spectra for poloidal grows as the RMP is ramped up and radial spread of the turbulence occurs when the turbulence level is fully saturated poloidally.
Source: Park, H
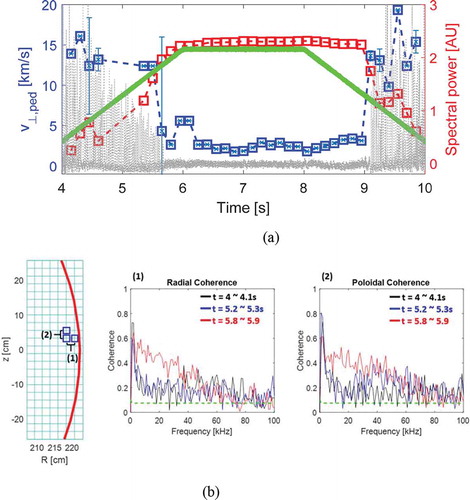
The introduction of the 2-D visualization of the ELM structure with a wide range of toroidal mode numbers (n = 4 ~ n = 20) and its dynamics at the pedestal region, has provided abundant new information such as mode validation through synthetic imaging of the calculated eigenmode, observation of the fast reconnection crash process, and the role of turbulence in suppression of the ELM-crashes using RMPs. The most striking observation is from the RMP-induced suppression experiment with short and long timescale up to the magnetic diffusion timescale. While the suppression state can be clearly defined when there is no ELM-crash, the gradual decrease of the ELM-crash amplitude before the suppression raises an issue on defining the mitigation state. The fact that the timescale of the observed turbulence is quite different from the perpendicular flow speed suggests that the relationship between the broadband turbulence, Er physics and enhanced transport may need more experiments to be resolved. Any phenomenology based on ‘a posteriori’ measurement such as Dα spikes and filamentary structure by the fast camera is subject to individual device conditions and the experimental set-up. It is desirable to build physics model of the ELMs, ELM-crashes and control dynamics based on universal physics parameters such as the internal mode dynamics. Eventually, the internal dynamics of the ELMs will be connected to the global filament structures by the fast camera and Dα spikes in the divertor.
5. Relevancy of the new knowledge of MHD events to non-fusion plasmas
In general, significant progress has been made in understanding linear to non-linear evolution of MHD physics in the laboratory [Citation4,Citation5] and solar plasmas [Citation2,Citation3] in which boundary conditions and constraints are vastly different. The naturally occurring non-linear MHD events that we have observed in tokamak plasmas are more complex than present symmetrical physical model based. Similar events in solar and space plasmas may have more variations due to freer boundary conditions. Therefore, it is not surprising that the validation process using measurements from conventional diagnostic systems may have experienced difficulties and/or limitations, since the limited aspects of the measurement may overlook asymmetries and anisotropies while the theoretical models are developed based on symmetric and isotropic systems.
The first example can be the reconnection physics of the sawtooth instability, and driven reconnection experiments in laboratory [Citation4,Citation5] may have more relevance to the theoretical models than the naturally occurring reconnection events in tokamaks and solar plasmas. The dynamics of the magnetic flux rope of a solar flare and associated corona mass ejection (CME) [Citation134] through reconnection events have a strong resemblance to the reconnection event of the 1/1 kink instability in a sawtooth oscillation. A major difference could be that the 1/1 kink instability in a sawtooth oscillation is bounded by the q = 1 surface whereas the flux rope in solar flare (i.e. half loop as shown in Figure 32) has no boundary and kinking of the current-carrying flux rope can be freely twisted. Therefore, the reconnection process can have more freedom than that of the 1/1 kink mode in tokamak plasmas [Citation135,Citation136]. The common factor is that kink modes in a solar flare and a sawtooth oscillation in a tokamak carry current and its shear will be important factor for growth of the instability as shown in simulation of the flux rope in solar flare [Citation137]. An example of modeling using an ideal MHD code with zero beta plasmas is given in Figure 32. Here, it is assumed that the initial magnetic rope (i.e. half of toroidal plasma) is created by strong current under the chromosphere and the rope carries a current which is the source of the kink instability similar to the case of sawtooth kink instability.
Figure 31. Simulation set up and kinking of the magnetic flux rope in solar flare. Modeling of the flux rope and development of the kink instability using ideal MHD code with the β = 0 plasma is given. The flux rope (half torus) is induced by the current under the chromosphere and the rope has driven current for the kink. This is quite similar to the case of kink instability demonstrated in sawtooth instability without boundary.
Source: Titov, V. S., Démoulin, P., Astron. Astrophys. 351, 707, 1999
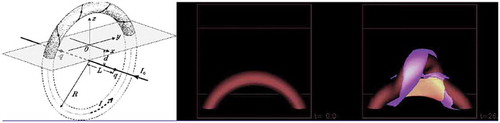
The second example can be the reconnection timescale which appears to be different whether the reconnection event is in a symmetric system or asymmetric system. The dominant fast reconnection time in sawtooth crash event has been observed mainly in a localized reconnection zone (non-axisymmetric system), and the initiation was proceeded at the pointy region in a ballooning type bulge (i.e. highly distorted 1/1 kink mode) as demonstrated in 2-D images prior to the crash. It is not surprising to find that the characteristic reconnection time (τc) estimated based on the Sweet-Parker model in a helically symmetric system does not agree with the measured timescale. On the other hand, this characteristic time (τc) is consistent with that of the axisymmetric reconnection zone (‘post-cursor oscillation’ case). Therefore, the Petschek model may be more suitable for the fast reconnection with a narrow reconnection zone and thin current sheet. The reconnection events in the magnetic rope of solar plasma can have various twists of the kink due to various possible current flow patterns in open boundary, and the timescale can be vastly different. The lessons from reconnection physics in the study of the sawtooth instability with a 2-D visualization tool suggests that application of the theoretical model should be done with caution, since little is known about the currents in the flux rope and boundary conditions such as the axisymmetry.
6. Summary
Among various concepts of fusion plasma devices, the tokamak concept has been at the front of the line and the progress on the stellarator concept is rapidly catching up. The future success of the ITER project warrants challenging a design of advanced fusion reactor and modeling with predictive capability is essential. New insights and multi-dimensional boundary constraints are critical in validating the theoretical models for improved control system for the critical MHD and Alfvén instabilities. New findings of these instabilities by 2-D ECEi system have not only provided an opportunity to improve the relevant theoretical modelings but also a broadened understanding of the underlying physical mechanisms. Validation of the long-standing q0 problem (i.e. MHD aspect of the 1/1 kink stability condition) and new insights of the reconnection timescale (i.e. the importance of axisymmetry of the 1/1 kink mode in determining the reconnection time) in the sawtooth instability vindicated the discarded ‘full reconnection model’. Furthermore, the newly uncovered physics may find applications to similar instabilities and reconnection events in solar and geomagnetic plasmas. The modeling capability of the Alfvén eigenmode instability is improved owing to detailed 2-D images of the spatially distributed RSAE. In study of the NTM instability, it is demonstrated that 2-D imaging data can be effective in determining the critical stability parameters of the 2/1 mode (i.e. Δ’ and ωc). Simultaneous measurement of macroscopic MHD (i.e. 2/1 island) and the non-intuitive anisotropic micro-turbulence and its flow shear in the presence of a 2/1 island is justified by theoretical models. Here, the anisotropy of micro-turbulence and strong flow shear are from a competition between growth rates of the TEM and ITG and E x B shearing rates near the X and O-points of the 2/1 island. The 2-D imaging data of the ELMs and ELM-crash has provided unprecedented new physics information. Here, validation of the mode structure with the reduced MHD code (M3D-C1) provided a confidence of the measured ELM structures. The 2-D dynamics of the ELMs such as temporal evolution to the crash and asymmetry of mode behaviors are new information of the ELMs. In the ELM-crash suppression experiment, the simultaneously measured ELMs and turbulence induced by the RMP provided an opportunity to understand fundamentals of the ELM-crash suppression physics. The slow growth of the turbulence on the magnetic diffusion timescale with the slow RMP current ramp-up suggests the nature of the turbulence may be magnetic rather than electrostatic. Also, bifurcation of the perpendicular electron flow was observed through direct measurement of the turbulence. No correlation between the growth of the turbulence and flow speed raises an important issue on the Er x B contribution to the perpendicular flow speed and enhanced transport at the pedestal region. The inter-coupling of the growth and decay of the turbulence, the timescales of the ELM-crash amplitude (Dα spikes) into and from the suppression period and perpendicular rotation are extremely important for the suppression mechanism of the ELM-crashes.
Acknowledgments
I would like to express my sincere appreciation to Prof. G.S. Yun, Drs. W. Lee, M. Choi, M. Kim, J. Lee, and Y. Nam who devoted their early carrier developing the KSTAR ECEi system. Also, my deep appreciation goes to longtime friends, Dr. C. Domier, Profs. A.J. Donne and N.C. Luhmann, Jr., with whom I have worked together for a long time. Without their initial support, development of the KSTAR ECEi system was not feasible. A special thank goes to Dr. S. Sabbagh for sincere discussion on general issues of MHD physics. Also, valuable discussions on sawtooth physics with Prof. A. Bhattarcharjee and Drs. M. Yamada and S. Jardin are appreciated. This work is supported by NRF of Korea (grant No. NRF-2014 M1A 7A1A03029865)
Disclosure statement
No potential conflict of interest was reported by the author.
References
- Bateman G. MHD instabilities. Cambridge, Mass.: MIT Press; 1978.
- Parks GK. Physics of space plasmas. Redwood City, CA: Addison-Wesley Publishing Co.; 1991.
- Tsurutani, B.T., Gonzalez W.D., Gonzalez, A.L.C., et al. Corotating solar wind streams and recurrent geomagnetic activity: A review. J Geophys Res. 2006;111(1-25): A07S01.
- Yamada M. Review of the recent controlled experiments for study of local reconnection physics. Earth Planets Space. 2001;53:653–717.
- Ono Y, Tanabe H, Yamada T, et al. High power heating of magnetic reconnection in merging tokamak experimentsa). Phys Plasma. 2015;22:055708.
- Burch JI, Moore TE, Torbert RB, et al. Magnetospheric Multiscale Overview and Science Objectives. Space Sci Rev. 2016;199:5–21.
- Wesson JA. Tokamaks. Oxford: Oxford University press; 2011 Oct.
- Hutchinson IH. Principles of Plasma Diagnostics. 2nd ed. New York: Cambridge University Press; 2002.
- Park H, Mazzucato E, Munsat T, et al. Simultaneous microwave imaging system for density and temperature fluctuation measurements on TEXTOR (invited). Rev Sci Instrum. 2004;75:3787.
- Helander P, Beidler CD, Bird TM, et al. Stellarator and tokamak plasmas: a comparison. Plasma Phys Control Fusion. 2012;54:124009.
- Wagner F. A quarter-century of H-mode studies. Plasma Phys. Control. Fusion. 2007;49:B1–B33.
- Ida K, Fujita T. Internal transport barrier in tokamak and helical plasmas. Phys Control Fusion. 2018;60:033001.
- Soltwisch H. Measurement of current-density changes during sawtooth activity in a tokamak by far-infrared polarimetry (invited). Rev Sci Instrum. 1988;59.
- O’Rourke, J., The change in the safety factor profile at a sawtooth collapse Plasma Phys. Control Fusion. 1991;33, 289.
- Rice BW. Fifteen chord FIR polarimetry system on MTX. Rev Sci Instrum. 1992;63:5002.
- Wroblewski D, Huang LK, Moos HW, et al. Determination of the poloidal magnetic field profiles in a tokamak by polarization spectroscopy of an impurity ion line. Phys Rev Lett. 1988;61:1724.
- Levinton F.M. The multichannel motional Stark effect diagnostic on TFTR. Rev Sci Instrum. 1992;63:5157.
- Wroblewski D, Snider RT. Evidence of the complete magnetic reconnection during a sawtooth collapse in a tokamak. Phys Rev Lett. 1993;71:859.
- Rice BW, Nilson DG, Burrell KH, et al. Simultaneous measurement of q and Er profiles using the motional Stark effect in high-performance DIII-D plasmas (invited). Rev Sci Instrum. 1999;70:815.
- Chung J, Ko J, De Bock MFM, et al. Instrumentation for a multichord motional Stark effect diagnostic in KSTAR. Rev Sci Instrum. 2014;85:11D827.
- Wolf RC, Bock A, Ford OP, et al. Motional Stark Effect measurements of the local magnetic field in high temperature fusion plasmas. JINST. 2015;10:10008.
- West WP. Measurement of the Rotational Transform at the Axis of a Tokamak. Phys Rev Lett. 1987;58:2758.
- Von Goeler S., Stodiek W. and Sauthoff, N, et al. Studies of internal disruptions and m = 1 oscillations in tokamak discharges with soft-X-ray techniques. Phys Rev Lett. 1973;33:1201.
- Dubois MA, Pecquet AL, Reverdin C. Internal disruptions in the TFR tokamak: A phenomenological analysis. Nucl Fusion. 1984;23:147.
- Granetz RS, Smeulders P. X-ray tomography on JET. Nucl Fusion. 1988;28: 459.
- Janicki C, Simm C, Décoste R, et al. Tomographic analysis of compound sawteeth on the Tokamak de Varennes. Nucl Fusion. 1990;30: 950.
- Yamaguchi S, Igami H, Tanaka H, et al. Three-dimensional observation of an helical hot structure during a sawtooth crash in the WT-3 Tokamak. Phys Rev Lett. 2004;93:045005.
- Sabbagh SA, Berkery JW, Bell RE, et al. Advances in global MHD mode stabilization research on NSTX. Nucl Fusion. 2010;50:025020.
- Costley AE, Hastie RJ, Paul JWM, et al. Electron cyclotron emission from a tokamak plasma: experiment and theory. Phys Rev Lett. 1974;33:758.
- Efthimion PC, Arunasalam V, Bitzer R, et al. A fast-scanning heterodyne receiver for measurement of the electron cyclotron emission from high-temperature plasmas. Rev Sci Instrum. 1979;50:949.
- Cavallo A, Cutler R. Absolute calibration of a ten-channel grating polychromator for electron temperature measurements on Princeton large torus. Rev Sci Instrum. 1985;56:931.
- Buratti P, Zerbini M. A Fourier transform spectrometer with fast scanning capability for tokamak plasma diagnostic. Rev Sci Instrum. 1995;66:4208.
- Chang Z, Park W, Frederickson E, et al. Off-axis sawteeth and double-tearing reconnection in reversed magnetic shear plasmas in TFTR. Phys Rev Lett. 1996;77:3553.
- Fredrickson ED, Austin ME, Groebner R, et al. Heat pulse propagation studies on DIII-D and the Tokamak Fusion Test Reactor. Phys Plasmas. 2000;7:5051.
- West, W.P. Thomas, D.M. deGrassie J.S. et al, Measurement of the Rotational Transform at the Axis of a Tokamak. Phys Rev Lett. 2003;90:205001.
- Udintsev VS, Ottaviani M, Maget P, et al. Experimental observation of m/n = 1/1 mode behaviour during sawtooth activity and its manifestations in tokamak plasmas. Plasma Phys Control Fusion. 2005;47:1111.
- Bornatici R, Cano R, De Barbieri O, et al. Electron cyclotron emission and absorption in fusion plasmas. Nucl Fusion. 1983;23:1153.
- Park HK, Chang CC, Deng BH, et al. Recent advancements in microwave imaging plasma diagnostics. Rev Sci Instrum. 2003;74:4239.
- Wang, Y., Tobias, B., Chang Y-T. Millimeter-wave imaging of magnetic fusion plasmas: technology innovations advancing physics understanding. et al. Nucl Fusion. 2017;57:072007.
- Classen IGJ, Boom JE, Suttrop W, et al. 2D electron cyclotron emission imaging at ASDEX Upgrade (invited). Rev Sci Instrum. 2010;81:10D929.
- Tobias B, Domier CW, Liang T, et al. Commissioning of electron cyclotron emission imaging instrument on the DIII-D tokamak and first data. Rev Sci Instrum. 2010;81:10D928.
- Zhu YL, Xie JL, Yu, CX Millimeter-wave imaging diagnostics systems on the EAST tokamak (invited). 2016;87:11D901.
- Jiang M., Shi ZB, Che S.,et al. Development of electron cyclotron emission imaging system on the HL-2A tokamak. Rev Sci Instrum. 2013;84:113501.
- Kuwahara D, Tsuji-Iio S, Nagayama Y, et al. Development of electron cyclotron emission imaging system on Large Helical Device. Rev Sci Instrum. 2010;81:10D919.
- Yun GS, Lee W, Choi MJ, et al. Quasi 3D ECE imaging system for study of MHD instabilities in KSTAR. Rev Sci Instrum. 2014;85:11D820.
- Nam YB, Park HK, Lee W, et al. Systematic effects from an ambient-temperature, continuously rotating half-wave plate. Rev Sci Instrum. 2016;87:11E135.
- Kadomtsev BB. Disruptive instability in tokamaks. Sov J Plasma Phys. 1975;1:389.
- Kulsrud RM. Magnetic reconnection: sweet-Parker versus Petschek. Earth Planets Space. 2001;53:417–422.
- Zakharov L, Rogers B. Two-fluid magnetohydrodynamic description of the internal kink mode in tokamaks. Phys Fluids B. 1992;4:3285.
- Levinton FM, Zakharov L, Batha SH, et al. Stabilization and onset of sawteeth in TFTR. Phys Rev Lett. 1994;72:2895.
- Levinton FM, Fonck RJ, Gammel GM, et al. Magnetic field pitch-angle measurments in the PBX-M tokamak using the motional Stark effect. Phys Rev Lett. 1987;63:2060–2063.
- Lazarus E, Waelbroeck FL, Luce TC, et al. A comparison of sawtooth oscillations in bean and oval shaped plasmas. Plasma Phys Cont Fusion. 2006;48:L65.
- Ko J, Kusaka A, Appel JW, et al. Systematic effects from an ambient-temperature, continuously rotating half-wave plate. Rev Sci Instrum. 2016;87:11E541.
- Campbell DJ, Gill RD, Gowers CW, et al. Sawtooth activity in ohmically heated JET plasmas. Nucl Fusion. 1986;26:1085.
- Wesson JA. Sawtooth oscillations. Plasma Phys Control Fusion. 1986;28:243.
- Gunter S, Yu Q, Lackner K, et al. Fast sawtooth reconnection at realistic Lundquist numbers. Plasma Phys Cont Fusion. 2015;57.
- Nagayama Y. Yamada M, Park W. et al. Tomography of full sawtooth crashes on the Tokamak Fusion Test Reactor. Phys Plasmas. 1996;5:1647.
- Nagayama Y, Sabbagh SA, Page Y LE. Novel high pressure phase of silica. Phys Rev Lett. 1992;69:2376.
- Aydemir AY, Wiley JC, Ross DW.Toroidal studies of sawtooth oscillations in tokamaks. Phys. of Fluid 1989;B1:774.
- Westerhof E, Smeulders P, Lopes Cardozo N. Observations of sawtooth postcursor oscillations in JET and their bearing on the nature of the sawtooth collapse. Nucl Fusion. 1989;29:1056.
- Fredrickson ED, McGuire KM, Chang ZY, et al. Ballooning instability precursors to high β disruptions on the Tokamak Fusion Test Reactor. Phys Plasmas. 1996;3:2620.
- Park HK, Luhmann NC, Donné AJH, et al. Observation of high-field-side crash and heat transfer during sawtooth oscillation in magnetically confined plasmas. Phys Rev Lett. 2006;96:195003.
- Munsat T, Park HK, Classen IGJ, et al. Localization of the magnetic reconnection zone during sawtooth crashes in tokamak plasmas. Nucl Fusion. 2007;47:L31–L35.
- Park HK, Donné AJH, Luhmann NC, et al. Comparison Study of 2D Images of Temperature Fluctuations during Sawtooth Oscillation with Theoretical Models. Phys Rev Lett. 2006;96:195004.
- Tobias B, Domier CW, Liang T, et al. Commissioning of electron cyclotron emission imaging instrument on the DIII-D tokamak and first data. Rev Sci Instrum. 2010;81.
- Gao, B.X., Gao BX, Xie JL, Mao Z et al. The electron cyclotron emission imaging system on EAST with continuous large observation area. JINST. 2018;13:P02009.
- Igochine V, Boom J, Classen I, et al. Structure and dynamics of sawteeth crashes in ASDEX Upgrade. Phys Plasma. 2010;17:12506.
- Jiang M, Shi ZB, Domier CW, et al. Note: upgrade of electron cyclotron emission imaging system and preliminary results on HL-2A tokamak. Rev Sci Instrum. 2015;86:076107.
- Wan, B. Recent experiments in the EAST and HT-7 superconducting tokamaks. Nucl Fusion. 2009;49:10.
- Kramer GJ, Cheng CZ, Kusama Y, et al. Magnetic safety factor profile before and after sawtooth crashes investigated with toroidicity and ellipticity induced Alfvén eigenmodes. Nucl Fusion. 2001;41:1135.
- Chang, Z, Park W, Fredrickson ED, et al. Off-axis sawteeth and double-tearing reconnection in reversed magnetic shear plasmas in TFTR. Phys Rev Lett. 1996;77:3553.
- Bierwage A, Benkadda S, Hamaguchi S, et al. Fast growing double tearing modes in a tokamak plasma. Phys Plasmas. 2005;12:082504.
- Nam YB, Ko JS, Choe GH, et al. Validation of the ‘full reconnection model’ of the sawtooth instability in KSTAR. Nucl Fusion. 2018;58:066009.
- Jardin SC, Ferraro N, Breslau J, et al. Multiple timescale calculations of sawteeth and other global macroscopic dynamics of tokamak plasmas. Comput Sci Disc. 2012;5:014002.
- Matsuda, K. Ray tracing study of the electron cyclotron current drive in DIII-D using 60 GHz. IEEE Trans Plasma Sci. 1989;17:6.
- Chang G. Linearly positive histories: probabilities for a robust family of sequences of quantum events. Phys Rev Lett. 1995;74:3715–3719.
- Buttery RJ, Günter S, Giruzzi G, et al. Neoclassical tearing modes. Plasma Phys Control Fusion. 2000;42:B61–B73.
- Maget P, Lütjens H, Coelho R, et al. Modelling of (2,1) NTM threshold in JET advanced scenarios. Nucl Fusion. 2010;50:045004.
- Kasparek W, Doelman N, Stober J, et al. NTM stabilization by alternating O-point EC current drive using a high-power diplexer. Nucl Fusion. 2016;56:126001.
- Classen IGJ, Westerhof E, Domier CW, et al. Effect of Heating on the Suppression of Tearing Modes in Tokamaks. Phys Rev Lett. 2007;98:035001.
- Ren C, Callen JD, Gianakon TA, et al. Measuring Δ′ from electron temperature fluctuations in the Tokamak Fusion Test Reactor. Phys Plasmas. 1998;5:450.
- Fitzpatrick R. Helical temperature perturbations associated with tearing modes in tokamak plasmas. Phys Plasmas. 1995;2:825.
- Wang ZX, Li JQ, Kishimoto Y, et al. Magnetic-island-induced ion temperature gradient mode. Phys Plasmas. 2009;16:060703.
- Waelbroeck FL, Militello F, Fitzpatrick R, et al. Effect of electrostatic turbulence on magnetic islands. Plasmas Phys Control Fusion. 2009;51:015015.
- Wilson HR, Connor JW. The influence of magnetic islands on drift mode stability in magnetized plasma. Plasmas Phys Control Fusion. 2009;51:115007.
- Banon NA, Bardóczi L, Carter TA, et al. Effect of magnetic islands on profiles, flows, turbulence and transport in nonlinear gyrokinetic simulations. Plasma Phys Control Fusion. 2017;59:034004–034012.
- Poli E, Bottino A, Hornsby WA, et al. Gyrokinetic and gyrofluid investigation of magnetic islands in tokamaks. Plasma Phys Control Fusion. 2010;52:124021.
- Choi MJ, Yun GS, Lee W, et al. Improved accuracy in the estimation of the tearing mode stability parameters (Δ′ and wc) using 2D ECEI data in KSTAR. Nucl Fusion. 2014;54:083010.
- Ida K, Ohyabu N, Morisaki T, et al. Observation of plasma flow at the Magnetic Island in the large helical device. Phys Rev Lett. 2001;88:015002.
- Ida K, Kamiya K, Isayama A, et al. Reduction of ion thermal diffusivity inside a Magnetic Island in JT-60U Tokamak Plasma. Phys Rev Lett. 2012;109:065001.
- Bardóczi L, Rhodes TL, Bañón Navarro A, et al. Multi-field/-scale interactions of turbulence with neoclassical tearing mode magnetic islands in the DIII-D tokamak. Phys Plasma. 2017;24:056106.
- Ida K, Kobayashi T, Ono M, et al. Hysteresis relation between turbulence and temperature modulation during the heat pulse propagation into a Magnetic Island in DIII-D. Phys Rev Lett. 2018;120:245001.
- Meskat JP, Zohm H, Gantenbein G, et al. Analysis of the structure of neoclassical tearing modes in ASDEX Upgrade. Plasma Phys Control Fusion. 2001;43:1325–1332.
- Choi MJ, Kim J, Kwon J-M, et al. Multiscale interaction between a large scale magnetic island and small scale turbulence. Nucl Fusion. 2017;57:126058.
- Kwon J-M, Ku S, Choi MJ, et al. Gyrokinetic simulation study of magnetic island effects on neoclassical physics and micro-instabilities in a realistic KSTAR plasma. Phys Plasma. 2018;25: 052506.
- Ku S, Chang CS, Hager R, et al. A fast low-to-high confinement mode bifurcation dynamics in the boundary-plasma gyrokinetic code XGC1. Phys Plasmas. 2018;25:056107.
- Kwon J-M, Qi L, Yi S, et al. ITG–TEM turbulence simulation with bounce-averaged kinetic electrons in tokamak geometry. Comput Phys Commun. 2017;215:81.
- Taroyan Y, Ruderman MS. MHD waves and instabilities in space plasma flows. Space Sci Rev. 2011;158:505–523.
- Heidbrink WW. Basic physics of Alfvén instabilities driven by energetic particles in toroidally confined plasmas. Phys Plamsas. 2008;15:055501.
- Classen IGJ, Lauber P, Curran D, et al. Investigation of fast particle driven instabilities by 2D electron cyclotron emission imaging on ASDEX Upgrade. Plasma Phys Control Fusion. 2011;53:124018.
- Tobias BJ, Classen IGJ, Domier CW, et al. Fast Ion induced shearing of 2D Alfvén eigenmodes measured by electron cyclotron emission imaging. Phys Rev Lett. 2011;106:075003.
- Cheng CZ, Chance MS. NOVA: A nonvariational code for solving the MHD stability of axisymmetric toroidal plasmas. J Comput Phys. 1987;71:124.
- Spong DA, Carreras BA, Hedrick CL, et al. Alpha destabilization of the TAE mode using a reduced gyrofluid model with Landau closure. Phys Scr. 1992;45:159.
- Zohm H. The physics of edge localized modes (ELMs) and their role in power and particle exhaust. Plasma Phys Control Fusion. 1996;38:1213–1223.
- Maggi CF. Progress in understanding the physics of the H-mode pedestal and ELM dynamics. Nucl Fusion. 2010;50:066001.
- Hegna C, Connor JW, Hastie RJ, et al. Toroidal coupling of ideal magnetohydrodynamic instabilities in tokamak plasmas. Phys Plasmas. 1996;3:584.
- Snyder PB, Wilson HR, Ferron JR, et al. ELMs and constraints on the H-mode pedestal: peeling–ballooning stability calculation and comparison with experiment. Nucl Fusion. 2004;44:320.
- Kirk A, Wilson HR, Counsell GF, et al. Spatial and temporal structure of edge-localized modes. Phys Rev Lett. 2004;92:245002.
- Akers R, Ahn JW, Antar GY, et al. Transport and confinement in the Mega Ampère Spherical Tokamak (MAST) plasma. Plasma Phys Control Fusion. 2003;45:A175.
- Ayed NB, Kirk A, Dudson B, et al. Inter-ELM filaments and turbulent transport in the Mega-Amp Spherical Tokamak. Plasma Phys Control Fusion. 2009;51:035016.
- Connor JW., Edge-localized modes—physics and theory. Plasma Phys. Control. Fusion 1998;40:531-542.
- Evans TE, Fenstermacher ME, Moyer RA, et al. RMP ELM suppression in DIII-D plasmas with ITER similar shapes and collisionalities. Nucl Fusion. 2008;48:024002.
- Lang PT, Loarte A, Saibene G, et al. ELM control strategies and tools: status and potential for ITER. Nucl Fusion. 2013;53:043004.
- Evans TE. ELM mitigation techniques. J Nucl Matter. 2013;438:551.
- Langa PT, Conway GD, Eich T, et al. ELM pace making and mitigation by pellet injection in ASDEX Upgrade. Nucl Fusion. 2004;44:665–677.
- Kirk A, Chapman IT, Evans TE, et al. Understanding the effect resonant magnetic perturbations have on ELMs. Plasma Phys Control Fusion. 2013;55:124003.
- Strait EJ. Magnetic control of magnetohydrodynamic instabilities in tokamaks. Phys Plasmas. 2015;22:021803.
- Xiao WW, Diamond PH, Zou XL, et al. ELM mitigation by supersonic molecular beam injection into the H-mode pedestal in the HL-2A tokamak. Nucl Fusion. 2012;52:114027.
- Evans T, Moyer RA, Thomas PR, et al. Suppression of large edge-localized modes in high-confinement DIII-D plasmas with a stochastic magnetic boundary. Phys Rev Lett. 2004;92:235003.
- Yang HL, Park YM, Bae YS, et al. Development of KSTAR in-vessel components and heating systems. Fusion Eng Des. 2011;86:588–592.
- Park HK, Choi MJ, Hong SH et al. Overview of the KSTAR research progress and future plan toward ITER and K-DEMO 2019: https://doi.org/10.1088/1741-4326/ab20e2 Nucl Fusion. 2019.
- Park JK, Jeon YM, In, Y et al. 3D field phase-space control in tokamak plasmasNature Physics. 2018;14:1223.
- McKee GR, Yan Z, Holland C, et al. Increase of turbulence and transport with resonant magnetic perturbations in ELM-suppressed plasmas on DIII-D. Nucl Fusion. 2013;53:113011.
- Nazikian R, Paz-Soldan C, Callen J, et al. Pedestal bifurcation and resonant field penetration at the threshold of edge-localized mode suppression in the DIII-D Tokamak. Phys Rev Lett. 2015;114:105002.
- In Y, Park JK, Jeon JM, et al. Extremely low intrinsic non-axisymmetric field in KSTAR and its implications. Nucl Fusion. 2015;55.
- Boom JE, Classen IGJ, de Vries PC, et al. 2D ECE measurements of type-I edge localized modes at ASDEX Upgrade. Nucl Fusion. 2011;51:103039.
- Tobias B, Austin ME, Boom JE, et al. ECE-imaging of the H-mode pedestal (invited). Rev Sci Instrum. 2012;83: 10E329.
- Kim M, Choi MJ, Lee J, et al. Comparison of measured 2D ELMs with synthetic images from BOUT++ simulation in KSTAR. Nucl Fusion. 2014;54:093004.
- Yun GS, Lee W, Choi MJ, et al. Two-Dimensional Visualization of Growth and Burst of the Edge-Localized Filaments in KSTAR H-Mode Plasmas. Phys Rev Lett. 2011;107:045004.
- Lee JE, Yun GS, Lee W et al Solitary perturbations in the steep boundary of magnetized toroidal plasma Scientific Reports, 2017;7: 45075.
- Chang CS. Private Communication.
- Lee J, Yun GS, Choi MJ, et al. Nonlinear interaction of edge-localized modes and turbulent eddies in Toroidal Plasma under n = 1 magnetic perturbation. Phys Rev Lett. 2016;117:075001.
- Lee J, Jeon YM, In Y, et al. Direct evidence of E×B flow changes at the onset of resonant magnetic perturbation-driven edge-localized mode crash suppression. Nucl Fusion. 2019;59:066033.
- Kusano K, Bamba Y, Yamamoto TT, et al. MAGNETIC FIELD STRUCTURES TRIGGERING SOLAR FLARES AND CORONAL MASS EJECTIONS. Astrophys J. 2012;760: 31.
- Chen J, Howard RA, Brueckner GE, et al. Evidence of an Erupting Magnetic Flux Rope: LASCO Coronal Mass Ejection of 1997 April 13. Astrophys J Lett. 1997;490:L191.
- Schmieder B, Emoulin PD, Aulanier G, arXiv:1212.4014 [astro-ph.SR], 2012 Solar filament eruptions and their physical role in triggering Coronal Mass Ejections.
- Titov VS, Démoulin P. Basic topology of twisted magnetic configurations in solar flares. Astron Astrophys. 1999;351:707.