
ABSTRACT
Direct observation of behaviour offers an unobtrusive method of assessing physical activity in urban spaces, which reduces biases associated with self-report. However, there are no existing observation tools that: (1) assess other behaviours that are important for people’s wellbeing beyond physical activity; (2) are suitable for urban spaces that typically have lower numbers of users (e.g. amenity green spaces) or that people pass through (e.g. green corridors); and (3) have been validated in Europe. MOHAWk (Method for Observing pHysical Activity and Wellbeing) is a new observation tool for assessing three levels of physical activity (Sedentary, Walking, Vigorous) and two other evidence-based wellbeing behaviours (Connect: social interactions; Take Notice: taking notice of the environment) in urban spaces. Across three studies, we provide evidence that MOHAWk is reliable and valid from 156 hours of observation by six observers in five urban spaces in the UK. MOHAWk can be used in policy or practice (e.g. by local authorities or developers), or in more formal institutional based research projects. This new tool is an inexpensive and easy-to-use method of generating wellbeing impact evidence in relation to the urban physical or social environment. A manual providing detailed instruction on how to use MOHAWk is provided.
Background
Physical activity provides many health benefits for all age groups (UK Department of Health Citation2011). Despite this, most of the world’s population is not sufficiently active to gain significant health benefits (Lee et al. Citation2012). Characteristics of the urban environment (e.g. green space, street design) can influence population levels of physical activity (Bauman et al. Citation2012). Two thirds of the world’s population predicted to be living in urban areas by 2050 (United Nations Citation2015). This growing urbanisation highlights the importance of understanding how the urban environment can facilitate (or inhibit) physical activity.
Systematic observation (i.e. direct observations of behaviour using predetermined criteria) is one method for assessing physical activity that offers many advantages. Systematic observation is an unobtrusive method; that is, participants are generally unaware that their behaviour is being assessed. This reduces possible reactivity of measurement associated with self-report and device-based measures of physical activity (French and Sutton Citation2010), reducing the risk of social desirability and recall bias. Systematic observation is not susceptible to poor response rates associated with self-reported measures (Benton et al. Citation2016a), reducing the risk of selection bias. Systematic observation provides contextually rich data by assessing behaviour directly in the environment of interest. Assuming ethical approval, observations can be carried out in almost any publicly accessible urban environment.
There are several existing observation tools designed to assess physical activity in urban environments (e.g. (Mckenzie et al. Citation1991, McKenzie et al. Citation1992, Citation2000, Citation2006, Gehl and Svarre Citation2013, Gehl Institute Citation2017, Suminski et al. Citation2019)). The most widely-used validated observation tool for assessing physical activity in outdoor urban environments is System for Observing Play and Active Recreation in Communities (SOPARC) (McKenzie et al. Citation2006). SOPARC uses momentary observational scans to assess the characteristics and physical activity behaviours of people in the area being observed. It has provided valuable data on a range of parks in various settings and populations (Evenson et al. Citation2016).
However, there are three key reasons why a new observation tool is needed. First, SOPARC only assesses physical activity behaviour; it therefore does not capture other behaviours undertaken by people in urban environments, such as social interactions (Helliwell and Putnam Citation2005). Second, SOPARC has only been validated in neighbourhood and state parks (McKenzie et al. Citation2006, Cohen et al. Citation2011, Whiting et al. Citation2012). SOPARC uses single observational scans that only last several seconds, which are less likely to capture valid samples in urban spaces that typically have lower numbers of users (e.g. amenity green spaces) or that people pass through (e.g. residential streets). Third, SOPARC was initially developed in California, United States (US), and has since only been validated in the US. Although SOPARC has been used around the world, it has predominantly been used in the US; across two recent review of studies using SOPARC, only two studies were conducted in Europe (Turkey and Belgium), compared to 23 unique studies in US (Evenson et al. Citation2016, Joseph and Maddock Citation2016). This is an important issue because the US is different to many European cities in terms of contextual variables that affect physical activity (e.g. population density, city design, climate, population characteristics) (Tucker and Gilliland Citation2007, Sallis et al. Citation2016); therefore, features of the tool may be unsuitable for settings dissimilar to the US. One study has used SOPARC in the United Kingdom (UK) (Gidlow et al. Citation2010); however, the researchers had to modify the tool in several ways (e.g. used continuous scanning throughout the observation period, modified demographic categories) and therefore of uncertain psychometric properties.
Existing observation tools have been used to assess physical activity. However, observation tools could be used to assess a wider range of behaviours that are known to influence wellbeing, beyond physical activity. Such behaviours have been identified in the ‘Five Ways to Wellbeing’ (New Economics Foundation Citation2008). On behalf of the UK Government’s Foresight programme, New Economics Foundation (NEF) conducted a review of the wellbeing literature. They identified five behaviours for which there is evidence that engaging in these behaviours improves an individual’s wellbeing, known as the ‘Five Ways to Wellbeing’ (or ‘Five Ways’): Be Active (engage in physical activity); Connect (socially interact with others); Take Notice (be aware of the environment); Keep Learning (acquire knowledge or skill in something new); and Give (contribute to the community). Since there is evidence that each of the Five Ways behaviours are associated with improved wellbeing, including both hedonic and eudaimonic wellbeing (Helliwell and Putnam Citation2005, New Economics Foundation Citation2008, Citation2012, Dolan et al. Citation2008, McEwan et al. Citation2019), each of these behaviours can be used as indicators of wellbeing (hereafter referred to as ‘wellbeing behaviours’). Three of the Five Ways behaviours (Be Active, Connect, Take Notice) can be observed and are relevant to urban environments.
We report here on the development and formal testing of a newly developed observation tool: Method for Observing pHysical Activity and Wellbeing (MOHAWk). An early version of this tool was used in a recent study that evaluated the impact of small-scale pocket park improvements in Manchester, UK (Anderson et al. Citation2017). The researchers observed significant increases in wellbeing behaviours assessed using MOHAWk at 1-year follow-up compared to a matched comparison site; thus demonstrating the feasibility of using this tool and evidence of sensitivity to change.
Purpose of MOHAWk
MOHAWk is an observation tool for assessing three levels of physical activity (Sedentary, Walking and Vigorous) and two other wellbeing behaviours (Connect: social interactions; Take Notice: taking notice of the environment) in urban spaces. It also measures the total number of people, their characteristics (gender, age group, ethnicity), and the presence of incivilities in the environment where observations are carried out (e.g. graffiti, broken glass). MOHAWk has been designed to be used in a wide variety of urban spaces, particularly spaces that typically have lower numbers of users or that people pass through; examples of which may include residential streets, amenity green spaces, green corridors, pocket parks, and urban squares.
MOHAWk is different from existing validated observation tools in three key ways: (1) MOHAWk assesses two other wellbeing behaviours that are relevant to the use of urban spaces (social interactions and taking notice of the environment), not just physical activity; (2) MOHAWk observations occur continuously throughout the observation period, rather than using a series of single observational scans; and (3) MOHAWk observations are carried out regardless of weather conditions, rather than cancelling observations during inclement weather (a sensitivity analysis, or including weather as a covariate, can control for the confounding influence of weather).
MOHAWk is freely available for use. The tool consists of an instruction manual, a standardised observation form, and a data summary form – all of which are provided in Supplementary files 1, 2 and 3. An overview of MOHAWk and procedures for using the tool are summarised in .
Figure 1. An overview of MOHAWk and procedures for using the tool (Saelens et al. Citation2016, Broomhall et al. Citation2004, Millstein et al. Citation2013).
Aims of present research
The present paper reports on three studies that aimed to develop MOHAWk and test for evidence of reliability and validity. The specific aims of these studies were to: (1) assess inter-rater reliability for observing people’s characteristics, physical activity levels, and additional wellbeing behaviours (Connect; Take Notice); (2) explore the reliability of shortened observation schedules; and (3) test for evidence of criterion-related validity of observing Take Notice behaviours.
Methods
Description of studies
Study 1
MOHAWk was used in two sites in central Manchester, UK: All Saints Park (Site 1A) and St Peter’s Chaplaincy (Site 1B) – see . Site 1A is a small park (~0.9 hectares) that is surrounded on three sides by Manchester Metropolitan University. Site 1B is a non-green urban square located near The University of Manchester.
Figure 2. Photographs of Sites 1A (top), Site 1B (middle) and the temporary ‘Hello Hollow’ statue (bottom). Photographs of Site 1A and 1B taken by Margaret Pulis. Photograph of ‘Hello Hollow’ was taken by Manchester Metropolitan University (permission approved by the Corporate Marketing and Communications department at Manchester Metropolitan University). All faces have been obscured.
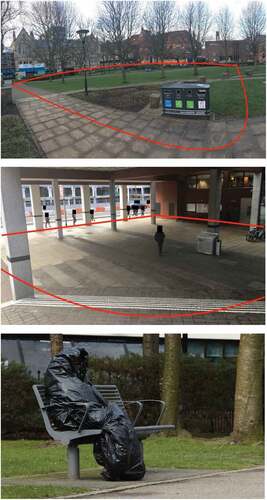
One observer (MP) used MOHAWk at these two sites across eight weekdays (Thursdays and Fridays) over four weeks during March 2017. Observation periods lasted two hours (8–10am and 2–4pm), but data were corded into 15-minute blocks within each observation period to allow investigations of patterns of data within each observation period. Observations were fully counterbalanced between the two sites to control for week, day of week and time of day. To assess inter-rater reliability, on four days of observation, a second observer (DF or JA) independently conducted observations alongside MP at the same site. Data were collected over a total of 32 hours, including 16 hours using two observers simultaneously.
The differences between the two sites (e.g. benches, vegetation) permitted testing of criterion-related validity of observing Take Notice behaviours i.e. whether there are significantly higher observed counts of Take Notice behaviours in Site 1A, where there are more opportunities for Take Notice behaviours, compared to Site 1B.
The unanticipated presence of a temporary statue within Site 1A () on two days of observations also permitted further criterion-related validity testing: by assessing whether there are more Take Notice behaviours on the two days with the statue, compared to the other six days without the statue in the same site.
Study 2
Study 2 was a feasibility study for a natural experimental study of changes to urban green spaces on older adults’ physical activity and wellbeing (Benton et al. Citation2018b). In terms of the development of MOHAWk, this study had five aims: (1) assess inter-rater reliability; (2) test several modifications to the MOHAWk tool following Study 1, including refined coding procedures (e.g. recording precipitation), refined age group categories, and other new codes (e.g. mobility assistance); (3) determine how many days of observation per week and hours per day are needed to provide a reliable estimate of activity in a UK urban environment; (4) determine what times of the day observations should be carried out to capture variation in activity across the course of a day; and (5) explore differences in activity patterns on weekdays compared to weekends.
Two observers (JB, SK) used MOHAWk at the same time at two separate residential streets (adjacent to small amenity green spaces) in South Manchester during July 2017 (). One site was a residential street where changes in the aesthetic quality of green space were planned but had not yet been implemented at the time of observations (Site 2A). The other site was a residential street in the same neighbourhood, but no such changes were planned (Site 2B).
Figure 3. Photographs of Site 2A (top) and Site 2B (bottom). Photographs taken by Jack Benton.
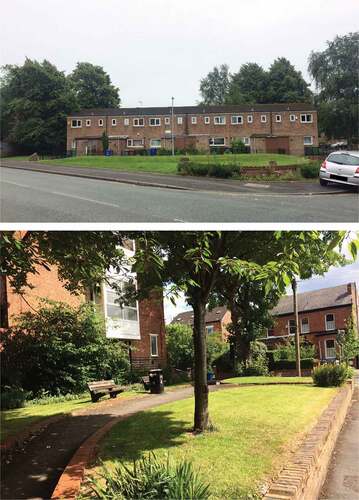
Observations were conducted 8am-6pm in 50-minute observation periods (e.g. 8–8.50 am, 9–9.50 am etc.). Observation periods lasted 50 minutes, rather than one hour, to provide a 10-minute break for each observer every hour. Data were recorded into three 15-minute blocks and one 5-minute block within each observation period to allow investigations of patterns of data within each observation period. On the first two days (Thursday and Friday), both observers independently conducted observations at Site 2A at the same time to assess inter-rater reliability. Then, one observer (JB) conducted observations for seven consecutive days from Saturday to Friday in Site 2A. At the same time, the second observer (SK) conducted observations at Site 2B for five consecutive days from Monday to Friday.
Both sites were similar apart from the following key differences at Site 2B: two benches, a litter bin, and more diverse vegetation. Site 2B was also rated by two observers (JB, SK) as being more aesthetically pleasing and better maintained than Site 2A using a validated tool for measuring the quality of neighbourhood green space (Gidlow et al. Citation2012). These differences between Site 2A and 2B permitted testing of criterion-related validity: whether there are significantly higher observed counts of Take Notice behaviours in Site 2B, where there are more opportunities for Take Notice behaviours, compared to Site 2A.
Study 3
The aims of Study 3 were to: (1) assess inter-rater reliability; (2) test new coding procedures for recording Take Notice behaviours to improve the reliability of observing these behaviours; (3) test whether MOHAWk can accurately capture Take Notice and Connect behaviours whilst simultaneously collecting other data; and (4) use MOHAWk outside of Manchester i.e. Belfast, Northern Ireland.
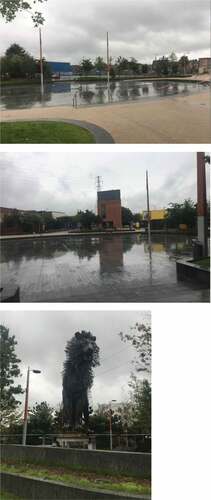
Two observers (JB, CC) independently used MOHAWk at the same time for two consecutive days (Monday, which was a national bank holiday, and Tuesday) during August 2018. Observations were carried out at C.S Lewis Civic Square (): a civic square in east Belfast, located at the intersection of the Connswater and Comber Greenways. This site contains public art (seven bronze art sculptures), a coffee bar, several seating areas, and green space. Observations were conducted using hour-long observation periods between 8am-4pm. Data were recorded in 5-minute blocks within each observation period to allow investigations of patterns of data within each observation period. Data were collected over 8 hours, all of which were conducted using two observers simultaneously.
Figure 4. Photographs of Site 3. Photographs taken by Jack Benton.
On the Monday, both observers used MOHAWk between 10am and 12pm to assess inter-rater reliability. Take Notice behaviours (e.g. an intentional pause in activity to look at or photograph something in the vicinity) are momentary behaviours and thus more difficult to observe, particularly whilst recording other data. Therefore, in the afternoon (1–3pm), both observers used MOHAWk as normal. However, one observer coded Take Notice behaviours only when people were stationary, whilst the second observer coded all Take Notice behaviours regardless of whether people were stationary or not. This was to test whether coding Take Notice behaviours only when people are stationary improves inter-rater reliability for observing Take Notice behaviours.
On the Tuesday morning (8–9am and 10–11am), one observer used MOHAWk as normal, whilst the second observer only recorded Connect behaviours, gender and age group for each person. Similarly, in the afternoon (12–1pm and 2–3pm), one observer used MOHAWk as normal, whilst the second observer only recorded Take Notice behaviours, gender and age group for each person.
Observer training
There were six unique observers across the three studies (JB, MP, JA, DF, SK, CC). The majority of observers were aged between 18–34 years old (n = 4), and two observers were aged between 35–50 years old. There were four male observers and two females. All observers were physically active according to World Health Organisation criteria (World Health Organization Citation2010).
Study 1 focused on developing the observation procedures used in a recent study (Anderson et al. Citation2017), which meant there was limited formal training. An instruction manual was developed as a result of Study 1 – this instruction manual can be found in Supplementary file 1, which provides detailed descriptions of MOHAWk procedures and coding conventions (e.g. how to distinguish between Walking and Vigorous behaviours, how to distinguish between age groups based on gait, clothing, and other physical attributes etc).
Observers in Studies 2 and 3 were formally trained by JB using the MOHAWk instruction manual and by practising observations in the study sites. Training focused on becoming familiar with the operational definitions, key coding conventions, how to use the observation form, and how to code site incivilities. All observers in Study 2 and 3 received at least three hours of training and practising observations with feedback and inter-rater reliability assessments. The aim of training was to achieve inter-rater reliability of at least 0.75 (intraclass correlation coefficient (ICC)) for assessing the total number of people, each behaviour (Sedentary, Walking, Vigorous, Take Notice, Connect) and each participant characteristic (gender, age group, ethnicity). Any discrepancies between observers were resolved by discussion. Before each study, observers agreed on the boundaries of the target area in which all observed individuals were recorded.
Analyses
contains a summary of the methods and analyses used to address each aim across the three studies. The unit of analysis for all analyses is at the level of the observation period i.e. counts per observation period.
Table 1. Summary of the methods and analyses used to assess each aim across the three studies.
Inter-rater reliability
Inter-rater reliabilities were analysed using two-way mixed, single measure, consistency ICCs. ICCs are suitable for discrete data (i.e. count data). Unlike Cohen’s (Cohen Citation1960) kappa, ICCs incorporate the magnitude of disagreement rather than an all-or-nothing agreement (Hallgren Citation2012). ICCs can be interpreted as < 0.5 = poor; 0.5–0.75 = moderate; 0.75–0.9 = good; and > 0.9 = excellent (Koo and Li Citation2016).
Reliability of shortened observation schedules
Two-way mixed, single measure, consistency ICCs were used to calculate the average reliability of overall daily counts of observed people at Site 2A and 2B for different abbreviated schedules. Specifically, ICCs were calculated for all possible abbreviated observation schedules across a week: combinations of 1, 2 or 3 days per week compared to the full 5 days per week (weekdays only). In the same way, ICCs were calculated for all possible abbreviated observation schedules across a day: combinations of 2, 3, or 4 hours per day compared to the full 10 hours per day. Two hours a day collection was defined as 1 hour in the first half of the day (between 8 am-1 pm) and 1 hour in the second half of the day (between 1–6 pm); three times a day was defined as morning (8 am-12 pm), early afternoon (12–3 pm) and late afternoon/early evening (3–6 pm); and four times a day was defined as early morning (8–10 am), late morning (10 am-12 pm), early afternoon (12–3 pm) and late afternoon/early evening (3–6 pm). These analyses were conducted separately for each age group: children, teens, adults and older adults.
Criterion-related validity
A Mann-Whitney U test was used to compare the number of Take Notice behaviours per observation period between: (i) Site 1A and Site 1B; (ii) two days when there was a temporary statue at Site 1A compared to the other six days without the statue; and (iii) Site 2A and Site 2B. All statistical tests were performed at the p ≤ 0.05 level.
Patterns of activity
Two-way mixed, single measure, consistency ICCs were used to calculate the consistency in overall counts of people on weekdays compared to the weekend.
Results
displays descriptive statistics for all three studies. Supplementary file 4 reports on baseline data from three separate natural experimental studies that recently used MOHAWk (Benton et al. Citation2018a, Citation2018b). Supplementary file 5 contains details of several key refinements that were made during each study to improve the reliability, validity, and usability of MOHAWk.
Table 2. Urban space characteristics and mean behavioural counts per hour for all three studies (five sites).
Inter-rater reliability
Across the three studies, inter-rater reliability between pairs of observers was mostly ‘good’ or ‘excellent’, with a small number of ‘moderate’ values (range of ICCs in brackets): total number of people (0.98–0.99), gender (0.91–0.99), age group (0.65–1), ethnicity (0.83–1), Sedentary (0.73–0.90), Walking (0.90–0.998), Vigorous (0.92–0.99), Take Notice (0.77–0.87), Connect (0.81–0.99), and mobility assistance required (0.88–1). Supplementary file 6 contains a more detailed breakdown of the ICCs and confidence intervals for inter-rater reliability across the three studies.
In Study 3, inter-rater reliability was ‘good’ for recording Take Notice behaviours when one observer only recorded Take Notice behaviours, gender and age group for each person, whilst the second observer used MOHAWk as normal (ICC = 0.80). Inter-rater reliability was ‘excellent’ for recording Connect behaviours when one observer only recorded Connect behaviours, gender and age group for each person, whilst the second observer used MOHAWk as normal (ICC = 0.97).
Reliability of shortened observation schedules
displays ICCs for all shortened schedules for each age group. On average, observing on one day a week can produce good consistency approaching that obtained by observing five days a week for adults. For teens and older adults, observing on two days a week can produce good consistency approaching that obtained by observing five days a week. For children, observing on three days a week can produce good consistency approaching that obtained by observing five days a week.
Table 3. Reliability estimates using the average ICC for shortened observation schedules. Numbers in bold represent ‘good’ (ICC > 0.75) or ‘excellent’ (ICC > 0.9) reliability scores.
On average, observing on two hours a day can produce good consistency approaching that obtained by observing 10 hours a day for adults. For teens and older adults, observing on three hours a day can produce good consistency approaching that obtained by observing 10 hours a day. For children, more than fours a day is required to produce good consistency approaching that obtained by observing 10 hours a day.
Criterion-related validity
In Study 1, there were more Take Notice behaviours observed per 15-minute block in Site 1A (median = 7, interquartile range (IQR) = 9) compared to Site 1B (median = 1, IQR = 1) (p < 0.001). In Site 1A, there were more Take Notice behaviours observed per 15-minute block on two days when there was a temporary statue (median = 11, IQR = 8.75), compared to the other six days without the statue (median = 1, IQR = 3.75) (p < 0.001).
In Study 2, there were more Take Notice behaviours observed per 15-minute block in Site 2B (median = 2, IQR = 3) compared to Site 2A (median = 0, IQR = 1) (p < 0.001).
Activity on different days of the week
displays patterns of the total number of people across each hour of the day for each age group at Site 2A in Study 2, comparing the average weekday, Saturday and Sunday. There was poor consistency between the average weekday and Saturday (children: ICC = 0.28, teens: ICC = 0.46, adults: ICC = 0.46, older adults: ICC = 0.43) or Sunday (children: ICC = 0.21, teens: ICC = 0.33, adults: ICC = 0.31, older adults: ICC = 0.45) for each age group.
Figure 5. Frequencies of children (top left), teens (top right), adults (bottom left) and older adults (bottom right). Observations were carried out at Site 2A, observed between 8–6 pm on weekdays (average of Monday to Friday), Saturday and Sunday during one week in July 2017.
Discussion
These three studies indicated that MOHAWk is a reliable and valid observation tool. There was high agreement between pairs of observers for recording people’s characteristics and their behaviours when using MOHAWk. There was evidence that shortened observation schedules can provide reliable estimates of people using urban spaces. In addition, there was evidence of criterion-related validity of observing Take Notice behaviours. We have provided extensive normative data (means, standard deviations, total counts) on all wellbeing behaviours in a variety of urban spaces to inform sample size calculations when using MOHAWk in natural experimental studies of urban environments (see and Supplementary file 4).
Inter-rater reliability
There was good or excellent agreement between pairs of observers (ICC > 0.75) for 93% of observed behaviours and characteristics using six unique observers across three studies. This high agreement suggests that different observers can use MOHAWk and still produce very similar data, thus allowing reliable evaluation of multiple urban spaces at the same time. Inter-rater reliability remained high even when observing in busy urban spaces (e.g. there was an average of 118 observed people per hour in Study 2), suggesting that MOHAWk is robust enough to withstand busy urban spaces. We recommend a minimum of one full day (i.e. eight hours) of training and practice. However, the exact amount of training and practice required will depend on numerous factors, such as previous experience of the observer(s) in using MOHAWk and how busy the target areas are likely to be.
Maintaining high inter-rater reliability was an important consideration when developing the tool; for example, we reduced ethnicity codes into two categories to make it easier for observers to accurately record multiple wellbeing behaviours. Study 3 demonstrated that observers can still achieve high inter-rater reliability when recording the additional Connect (ICC = 0.97) and Take Notice (ICC = 0.80) behaviours. However, agreement on recording Take Notice behaviours tended to be lower than agreement on recording Connect and physical activity behaviours (Sedentary, Walking, Vigorous). This is likely because Take Notice behaviours are more momentary than Connect and physical activity behaviours, which makes Take Notice behaviours harder to observe; for example, someone pausing to look at something in the vicinity (Take Notice) is typically more momentary than someone holding hands (Connect) or cycling (Vigorous). Therefore, training should focus more on improving inter-rater reliability for recording Take Notice behaviours.
Reliability of shortened observation schedules
Study 2 showed that shortened observation schedules can provide reliable estimates of people using an urban space across a week and across a day, albeit not for children. These results are in line with a previous study that found shortened observation schedules using SOPARC can provide reliable estimates of park usage in the US (Cohen et al. Citation2011). This provides increased confidence that shortened observation schedules can provide reliable data, therefore reducing the time and cost required for observations. As a general guide, observing at least four hours a day, two days a week is recommended, although other schedules are also reliable (see ).
Criterion-related validity
An important difference between MOHAWk and existing observation tools is the addition of two other wellbeing behaviours in MOHAWk: socially interacting with others (Connect) and taking notice of the environment (Take Notice). There is evidence that these additional wellbeing behaviours being assessed are valid and meaningful. Studies 1 and 2 demonstrated that there were significantly higher observed counts of Take Notice behaviours in sites that were hypothesised as offering more opportunities for Take Notice behaviours e.g. ‘greener’ and more aesthetically pleasing sites. This suggests that MOHAWk is accurately capturing Take Notice behaviours, since observed behaviours were in line with what we would expect to observe. Further, the frequencies of Take Notice and Connect behaviours varied between different sites and in different age groups (see ), as well as between weekdays and weekends, which suggests that MOHAWk is sensitive to change and can therefore be used to measure the effect of interventions. These data build on those from an early version of MOHAWk (Anderson et al. Citation2017), where the researchers observed significant increases in wellbeing behaviours assessed by MOHAWk after one year following an urban pocket park intervention i.e. demonstrating sensitivity to change.
The codes for observing physical activity in MOHAWk (Sedentary, Walking, Vigorous) are based on previous observation tools (Mckenzie et al. Citation1991, McKenzie et al. Citation1992, Citation2000, Citation2006), which have been validated using heart rate monitors (Mckenzie et al. Citation1991), pedometers (Rowe et al. Citation2004) and accelerometers (McKenzie et al. Citation1994); this suggests the physical activity codes used in MOHAWk are valid.
How MOHAWk compares to existing observation tools
To the best of our knowledge, there are no existing observation tools validated for use in urban spaces that typically have lower numbers of users (e.g. amenity green spaces) or that people pass through (e.g. residential streets). MOHAWk uses continuous scanning to count all people and their activities during one-hour observation periods, thus capturing activity in urban spaces which have lower levels of use that could not be captured by single observational scans used in existing observation tools. This is important because MOHAWk is more likely to produce larger sample sizes and thus better powered studies that require fewer observations due to increased sensitivity.
We have found evidence that MOHAWk is valid in two UK cities. There are no existing observation tools validated for use in Europe, and the vast majority of studies using existing observation tools have been conducted in the US (Evenson et al. Citation2016, Joseph and Maddock Citation2016). This is an issue because the US is different to many European cities in terms of key variables that influence people’s use of urban environments; for example, urban sprawl is much more prominent in the US compared to Europe (Patacchini et al. Citation2009). Therefore, it is unclear whether existing observation tools are valid outside the US.
Existing tools, such as SOPARC, recommend that observations are not carried out during inclement weather. SOPARC was developed in California (US), which has a climate characterised mainly by mild-to-hot and dry weather. However, it is impractical and costly to use SOPARC procedures and rearrange observation periods during inclement weather in cities that have much higher levels of rainfall, such as Manchester and Belfast (The World Bank Citation2019). The many issues of rearranging observation periods due to weather have been discussed elsewhere (e.g. ambiguous weather forecasts) (Veitch et al. Citation2017). To address this issue in MOHAWk, observations are carried out regardless of weather conditions, but a sensitivity analysis controls for the confounding influence of precipitation (or alternatively including precipitation as a covariate). Whilst precipitation did not affect any of the observation periods in the three studies reported here, a recent natural experimental study that used MOHAWk in the UK had 50 hours of observations (out of 264 hours) that were removed for the sensitivity analysis due to precipitation (Benton et al. Citation2018b). Rearranging 50 hours of observation would have been costly and would have affected the design of the study, thus potentially introducing bias.
Strengths of MOHAWk
Many reviews have shown there is a scarcity of robust natural experimental studies of the causal effects of the urban environment on physical activity and wellbeing, particularly in Europe (Hunter et al. Citation2015, Benton et al. Citation2016b, Roberts et al. Citation2018, MacMillan et al. Citation2018, Kärmeniemi et al. Citation2018, Houlden et al. Citation2018, Moore et al. Citation2018). MOHAWk is an unobtrusive measure that will allow more robust natural experimental studies in this area by providing a measure that has evidence of reliability and validity, and is validated for use in Europe. MOHAWk is currently being used in three separate natural experimental studies of interventions in different types of urban spaces in Greater Manchester (UK), including residential streets (Benton et al. Citation2018b), green corridor (Benton et al. Citation2018a), and a small park.
We have demonstrated that MOHAWk is a reliable tool, with evidence of validity of observing Take Notice behaviours. This is important given that previous studies in this field have often relied on outcome measures that have not been validated: a recent review on natural experimental studies of changing the built environment on physical activity found that seven out of fifteen outcomes were reported using unvalidated outcome measures (Benton et al. Citation2016a). Results from the present studies suggest that MOHAWk is a reliable and valid outcome measure that can be used in a range of urban environments, thus promoting comparability between studies.
The three studies reported here have provided 156 hours of normative data, and to date there are also a further 172 hours of baseline data from three other natural experimental studies (Benton et al. Citation2018a, Citation2018b), with data provided in Supplementary file 4. These normative data will help researchers conduct sample size calculations for future natural experimental studies; a lack of sample size calculations is a key weakness of previous natural experimental studies of urban spaces on physical activity (Hunter et al. Citation2015). These normative data will also help researchers determine the frequency and timing of observations to obtain accurate estimations of activity. More MOHAWk data are now needed in different urban spaces, settings (especially outside the UK) and populations (especially children and teens).
MOHAWk is a tool that can be used by most people. Existing observation tools have previously been used by non-researchers, such as volunteers from the local community (Tully et al. Citation2013). Therefore, MOHAWk can feasibly be used in policy or practice by stakeholders involved in the planning, design, implementation and maintenance of urban spaces; such as local authorities, public health practitioners or developers. This new tool is an inexpensive and easy-to-use method of generating wellbeing impact evidence in relation to changes in the urban physical or social environment. A manual providing detailed instruction on how to use MOHAWk (Supplementary file 1) and observation forms (Supplementary files 2 and 3) are freely provided to facilitate its widespread use – please contact the corresponding author for further assistance on how to use MOHAWk.
Future research
Further psychometric testing of MOHAWk is required to increase evidence of validity and reliability, particularly for observing Connect behaviours as there was no validity testing for this in the present studies. For example, researchers could evaluate whether there are significantly more Connect behaviours during events where one would expect more social interactions (e.g. a summer fair) compared to days where there is no such event. Sensitivity to change is currently being tested in three separate natural experimental studies in Greater Manchester (Benton et al. Citation2018a, Citation2018b), but more natural experimental studies are needed to assess how responsive MOHAWk is to change. We encourage other researchers to use MOHAWk to evaluate environmental interventions – see methods described elsewhere (Benton et al. Citation2018a, Citation2018b) for examples of how to use MOHAWk in natural experimental studies. Future research should also look into using MOHAWk in the evening, although this may only be feasible using image/video-capture devices due to ethical issues associated with deploying observers outside daylight hours.
Conclusions
The results of 156 hours of MOHAWk data, collected by six unique observers across five different sites, suggest that MOHAWk is a reliable and valid observation tool for assessing physical activity and other wellbeing behaviours in urban spaces. We provide extensive normative data on all wellbeing behaviours to inform sample size calculations when using MOHAWk in natural experimental studies of urban spaces. This new observation tool will allow more robust natural experimental studies, particularly in Europe where there is a dearth of robust evidence in this area. MOHAWk can also be used in policy or practice to generate wellbeing impact evidence in relation to changes in the urban physical or social environment.
Declarations
Ethics approval for Study 1 was granted by the University Research Ethics Committee (UREC) at The University of Manchester, REC reference number 2017–1119–1920. Ethics approval for Study 2 was granted by the University Research Ethics Committee (UREC) at The University of Manchester, REC reference number 2017–0064–3337. Ethics approval for Study 3 was granted by the University Research Ethics Committee (UREC) at The University of Manchester, REC reference number 2018–4346–6733.
Availability of data and materials
Data from all three studies are only available on reasonable request from the corresponding author. All materials required to use MOHAWk are included in Supplementary files 1, 2 and 3. Any other study materials are available by directly contacting the corresponding author on reasonable request.
Supplemental Material
Download Zip (1.6 MB)Acknowledgements
Study 2 formed part of the wider Green Infrastructure and the Health and Wellbeing influences on an Ageing Population (GHIA) project (2016–2019) www.ghia.org.uk; which was set up to investigate how urban green space influences the health and wellbeing of older adults. It enables researchers from a diverse range of academic specialisms to work with a variety of partners and organisations in Greater Manchester, including Manchester City Council (MCC), Red Rose Forest (City of Trees), The Canal and River Trust, Manchester Climate Change, Greater Manchester Centre for Voluntary Organisation (GMCVO) and Public Health Manchester.
The authors would like to acknowledge the following (in no particular order): Dave Barlow, Manchester City Council Senior Policy Officer for assisting in obtaining ethical approval; Michele Bryans, Connswater Community Greenway Manager for her help in facilitating Study 3; and, Sophie King and Cormac Coulter for assisting with observations.
Disclosure statement
No potential conflict of interest was reported by the authors.
Supplementary material
Supplemental data for this article can be accessed here
Additional information
Funding
Notes on contributors
Jack S. Benton
Jack S. Benton is a PhD student at the University of Manchester.
Jamie Anderson
Jamie Anderson is a Research Associate at the University of Manchester and Senior Sustainability Consultant at Buro Happold.
Margaret Pulis
Margaret Pulis was an undergraduate student at the University of Manchester at the time of Study 1.
Sarah Cotterill
Sarah Cotterill is a Senior Lecturer at the University of Manchester.
Ruth F. Hunter
Ruth F. Hunter is a Lecturer at Queen’s University Belfast.
David P. French
David P.. French is a Professor of Health Psychology at the University of Manchester.
References
- Anderson, J., et al., 2017. Lively social space, well-being activity, and urban design: findings from a low-cost community-led public space intervention. Environment and behavior, 49 (6), 685–716. doi:10.1177/0013916516659108
- Bauman, A.E., et al., 2012. Correlates of physical activity: why are some people physically active and others not? Lancet, 380 (9838), 258–271. doi:10.1016/S0140-6736(12)60735-1
- Benton, J., et al., 2018a. The impact of new walking infrastructure and changes to green space along an urban canal on physical activity and wellbeing: protocol for a natural experimental study. Open Science Framework. https://osf.io/zcm7v/
- Benton, J.S., et al., 2018b. Evaluating the impact of improvements in urban green space on older adults’ physical activity and wellbeing: protocol for a natural experimental study. BMC public health, 18 (1), 923. doi:10.1186/s12889-018-5812-z
- Benton, J.S., et al., 2016a. The effect of changing the built environment on physical activity: a quantitative review of the risk of bias in natural experiments. The international journal of behavioral nutrition and physical activity, 13 (1), 107. doi:10.1186/s12966-016-0433-3
- Benton, J.S., et al., 2016b. The effect of changing the built environment on physical activity: A quantitative review of the risk of bias in natural experiments. The international journal of behavioral nutrition and physical activity, 13 (1).
- Broomhall, M., Giles-Corti, B., and Lange, A., 2004. Quality of public open space tool (POST). Perth: School of Population Health, The University of Western Australia.
- Cohen, D.A., et al., 2011. How much observation is enough? Refining the administration of SOPARC. Journal of physical activity & health, 8 (8), 1117–1123. doi:10.1123/jpah.8.8.1117
- Cohen, J., 1960. A coefficient of agreement for nominal scales. Educational and psychological measurement, 20 (1), 37–46. doi:10.1177/001316446002000104
- Dolan, P., Peasgood, T., and White, M., 2008. Do we really know what makes us happy? A review of the economic literature on the factors associated with subjective well-being. Journal of economic psychology, 29 (1), 94–122. doi:10.1016/j.joep.2007.09.001
- Evenson, K.R., et al., 2016. Park characteristics, use, and physical activity: A review of studies using SOPARC (System for observing play and recreation in communities). Preventive medicine, 86, 153–166. doi:10.1016/j.ypmed.2016.02.029
- French, D.P. and Sutton, S., 2010. Reactivity of measurement in health psychology: how much of a problem is it? What can be done about it? British journal of health psychology, 15 (3), 453–468. doi:10.1348/135910710X492341
- Gehl Institute, 2017. The public life data protocol, version 1.0.
- Gehl, J. and Svarre, B., 2013. How to study public life. Island press. Washington, DC: How to Study Public Life, 1–179 p.
- Gidlow, C., et al., 2010. Promoting green space in stoke-on-trent (ProGreSS) final report for natural england august 2010. http://www.staffs.ac.uk/health_progress
- Gidlow, C.J., Ellis, N.J., and Bostock, S., 2012. Development of the neighbourhood green space tool (NGST). Landscape and urban planning, 106 (4), 347–358. doi:10.1016/j.landurbplan.2012.04.007
- Hallgren, K.A., 2012. Computing inter-rater reliability for observational data: an overview and tutorial. Tutorials in quantitative methods for psychology, 8 (1), 23–34. doi:10.20982/tqmp.08.1.p023
- Helliwell, J.F. and Putnam, R.D., 2005. The social context of well-being. In: F.A. Huppert, N. Baylis, and B. Keverne, eds. The science of well-being. Oxford: Oxford University Press, 435–459.
- Houlden, V., et al., 2018. The relationship between greenspace and the mental wellbeing of adults: A systematic review. PloS one, 13 (9), e0203000. doi:10.1371/journal.pone.0203000
- Hunter, R.F., et al., 2015. The impact of interventions to promote physical activity in urban green space: A systematic review and recommendations for future research. Social science & medicine (1982), 124, 246–256. doi:10.1016/j.socscimed.2014.11.051
- Joseph, R.P. and Maddock, J.E., 2016. Observational park-based physical activity studies: A systematic reviewof the literature. Preventive medicine, 89, 257–277. doi:10.1016/j.ypmed.2016.06.016
- Kärmeniemi, M., et al., 2018. The built environment as a determinant of physical activity: a systematic review of longitudinal studies and natural experiments. Annals of behavioral medicine: a publication of the society of behavioral medicine, 52 (3), 239–251. doi:10.1093/abm/kax043
- Koo, T.K. and Li, M.Y.A., 2016. Guideline of selecting and reporting intraclass correlation coefficients for reliability research. Journal of chiropractic medicine, 15 (2), 155–163. doi:10.1016/j.jcm.2016.02.012
- Lee, I.-M., et al., 2012. Effect of physical inactivity on major non-communicable diseases worldwide: an analysis of burden of disease and life expectancy. Lancet, 380 (9838), 219–229. doi:10.1016/S0140-6736(12)61031-9
- MacMillan, F., et al., 2018. Do natural experiments of changes in neighborhood built environment impact physical activity and diet? A systematic review. International journal of environmental research and public health, 15 (2), 217. doi:10.3390/ijerph15020217
- McEwan, K., et al., 2019. App for improving mental health through connecting with urban nature. International journal of environmental research and public health, 16 (18), 3373. doi:10.3390/ijerph16183373
- McKenzie, T., Sallis, J., and Armstrong, C., 1994. Association between direct observation and accelerometer measures of children’s physical activity during physical education and recess. Medicine and science in sports and exercise, 26 (Supplement), 143. doi:10.1249/00005768-199405001-00805
- McKenzie, T.L., et al., 2006. System for observing play and recreation in communities (soparc): reliability and feasibility measures. Journal of physical activity & health, 3 (s1), S208–22. doi:10.1123/jpah.3.s1.s208
- McKenzie, T.L., et al., 2000. Leisure-time physical activity in school environments: an observational study using SOPLAY. Preventive medicine, 30 (1), 70–77. doi:10.1006/pmed.1999.0591
- McKenzie, T.L., Sallis, J.F., and Nader, P.R.S.O.F.I.T., 1992. System for observing fitness instruction time. Journal of teaching in physical education : JTPE, 11 (2), 195–205. doi:10.1123/jtpe.11.2.195
- Mckenzie, T.L., et al., 1991. BEACHES: an observational system for assessing children’s eating and physical activity behaviors and associated events. Journal of applied behavior analysis, 1 (24), 141–151.
- Millstein, R.A., et al., 2013. Development, scoring, and reliability of the microscale audit of pedestrian streetscapes (MAPS). BMC public health, 13 (1), 403. doi:10.1186/1471-2458-13-403
- Moore, T.H.M., et al., 2018. The effects of changes to the built environment on the mental health and well-being of adults: systematic review. Health & place, 53, 237–257. doi:10.1016/j.healthplace.2018.07.012
- New Economics Foundation. Five ways to wellbeing: the evidence. London; 2008. http://b.3cdn.net/nefoundation/8984c5089d5c2285ee_t4m6bhqq5.pdf
- New Economics Foundation, 2012. Well-being evidence for policy: A review. London. https://b.3cdn.net/nefoundation/10b8aabd90c5771ff9_a0m6bvv5a.pdf
- Patacchini, E., et al., 2009. Urban sprawl in Europe. Brookings-whart pap urban aff. Washington, DC, 125–149. Available from: https://www.jstor.org/stable/25609561
- Roberts, H., et al., 2018. Identifying effective behavior change techniques in built environment interventions to increase use of green space: a systematic review. Environment and behavior, 50 (1), 28–55. doi:10.1177/0013916516681391
- Rowe, P., et al., 2004. Measuring students’ physical activity levels: validating SOFIT for use with high-school students. Journal of Teaching in Physical Education, 23 (3), 235–251. doi:10.1123/jtpe.23.3.235
- Saelens, B.E., et al., 2016. Measuring physical environments of parks and playgrounds: EAPRS instrument development and inter-rater reliability. Journal of physical activity & health, 3 (s1), S190–207. doi:10.1123/jpah.3.s1.s190
- Sallis, J.F., et al., 2016. Physical activity in relation to urban environments in 14 cities worldwide: a cross-sectional study. Lancet, 387 (10034), 2207–2217. doi:10.1016/S0140-6736(15)01284-2
- Suminski, R.R., Dominick, G.M., and Plautz, E., 2019. Validation of the block walk method for assessing physical activity occurring on sidewalks/streets. International journal of environmental research and public health, 16 (11), 1927. doi:10.3390/ijerph16111927
- Tucker, P. and Gilliland, J., 2007. The effect of season and weather on physical activity: a systematic review. Public health, 121 (12), 909–922. doi:10.1016/j.puhe.2007.04.009
- Tully, M.A., et al., 2013. Physical activity and the rejuvenation of connswater (PARC study): protocol for a natural experiment investigating the impact of urban regeneration on public health. BMC public health, 13 (774).
- UK Department of Health. Start active, stay active, 2011. A report on physical activity for health from our four home countries’ chief medical officer. London. https://www.gov.uk/government/uploads/system/uploads/attachment_data/file/216370/dh_128210.pdf
- United Nations, 2015. World urbanization prospects: the 2014 revision, highlights. New York. https://esa.un.org/unpd/wup/publications/files/wup2014-report.pdf
- Veitch, J., et al., 2017. Challenges in conducting natural experiments in parks—lessons from the REVAMP study. The international journal of behavioral nutrition and physical activity, 14 (1), 5. doi:10.1186/s12966-016-0460-0
- Whiting, J.W., Larson, L.R., and Green, G.T., 2012. Monitoring visitation in georgia state parks using the system for observing play and recreation in communities (SOPARC). Journal of outdoor recreation, education, and leadership, 30 (4), 21–37. https://lrl.people.clemson.edu/WebFiles/Whiting.etal.2012_JPRA-SOPARC.pdf
- The World Bank, 2019. Average precipitation in depth (mm per year) [Data file]. https://data.worldbank.org/indicator/AG.LND.PRCP.MM?end=2014&start=2013&view=map
- World Health Organization, 2010. Global recommendations on physical activity for health. http://apps.who.int/iris/bitstream/10665/44399/1/9789241599979_eng.pdf