
ABSTRACT
Urban planning that recognizes and integrates the needs of older adults in urban design provides an environment that allows these people to stay in their homes longer. The aim of the current study was to describe the preferences of a variety of urban design features among older adults living in less densely populated areas and to explore differences by groups of people that are often underrepresented in participatory processes. We conducted a survey of 1,836 older adults (age 65+) in cities and municipalities with <100,000 inhabitants in northwest Germany. Urban design features were analysed separately by individual and contextual factors. The urban design features rated as most important were safety concerns and urban design quality features. Crime safety was most often rated as important. The greatest difference in design preferences was observed for women, the oldest old, people with low education and actively mobile people. Increasing preference for lighting, crossings and separated cycle and footpath was observed by community size. The different emphasis put on urban design features by some groups highlight the importance of a diversity of representation in age-friendly development. Cooperation of different sectors is recommended to assess concerns and fears of the residents to help increase perceived safety.
Background
Being mobile into old age offers the possibility for a self-determined life (Musselwhite et al. Citation2015). Problems that arise with mobility in old age are becoming increasingly important due to demographic developments around the ageing population globally. The number of people aged 65 and over who are likely to be ‘dependent’ on the support of others for their daily living relative to the younger population will rise from 35% in 2019 in the developed regions of the United Nations to over 60% by 2060 (UN Citation2019). Studies have shown that most people prefer to grow old in their familiar home and surroundings (Golant Citation2011, Löfqvist et al. Citation2013). Cities and municipalities are therefore faced with the challenge of taking greater account of the needs of older adults living in their community for ageing in place (Burton et al. Citation2011).
Ageing is a diverse process and ‘older adults’ a group of people with different life patterns and abilities. However, the process of ageing comes overall with changes in mobility needs and mobility problems. Depending on their physical and cognitive abilities, many older people move around on foot, sometimes with aids such as a walking stick, a rollator or even a wheelchair (Musselwhite Citation2015, Nobis and Kuhnimhof Citation2018). However, public space is largely not designed for active mobility in old age, whether on foot or by bicycle, especially in more rural areas (Shergold et al. Citation2012). From a public health perspective, active mobility modes such as walking and cycling as a means of physical activity have several co-benefits for health (Lee et al. Citation2012, Kelly et al. Citation2014). Getting out and about is also important for social reasons (Kemperman et al. Citation2019, Gardener and Lemes de Oliveira Citation2020). Urban planning that recognizes and integrates the needs of older adults in urban design provides an environment that allows these people to stay in their homes longer (Mathers et al. Citation2008).
Qualitative studies have shown, that older adults and people with disabilities have higher demands on accessibility (width and surfaces when using walking aids, ramps and railings), orientation, visual relationship, speed (crossings, reaction time) and resting possibilities (Moran et al. Citation2014). Improvements in public spaces, such as the installation of street lighting and traffic calming measures, including road humps and speed limits, have been shown to be effective in reducing accidents and injuries as well as improving the perception of safety (Beyer and Ker Citation2009, Cairns et al. Citation2014). Although research on the importance of the built environment for healthy ageing has increased in recent decades, gaps remain (Kerr et al. Citation2012, Rachele et al. Citation2019). The concept of walkability as a determinant of active mobility, originally consisting of density, diversity of destinations, street connectivity, and distance to services and transit, mainly applies to urban areas (Ewing and Cervero Citation2001, Citation2010). Furthermore, these variables are often difficult to change. Especially in smaller towns or rural communities, where resources are limited, small scale changes are easier and faster to implement. This might also improve acceptance among decision-makers and the public (Brüchert et al. Citation2021a). Other indicators of the built environment in observational studies of the impact of health and mobility are often collected as aggregate variable, e.g. infrastructure or aesthetics, incoporating a variation of features in one variable. It is difficult to translate these aggregate variables into planning features and regulations with regard to usability and design.
Another gap emerges as there is a lack of stratified analysis for the most vulnerable. It is important to know the diverse needs and preferences that exist in different groups with regard to health-promoting and age-friendly urban development. Although there are opportunities for the public to participate in urban planning processes only a limited number of groups take advantage of them (Innes and Booher Citation2004). Observations from Germany show that attendees in municipal land use planning participation processes are predominantly well-educated men with higher incomes from wealthy neighbourhoods (Meunier Citation2006, Köckler Citation2014, Farias and Widmer Citation2017). A further problem in this process for meaningful engagement and representation is that the participants who are most persistent are generally the most listened to, which leads to decisions based on the opinion of individuals rather than on what is best for the community (Innes and Booher Citation2004). This problem has also been reported by planning and health authorities from small- and medium sized towns in Germany, which stated that the opinion and interests of ‘car-advocates’ is a considerable problem that municipalities face when it comes to setting priorities in urban planning (Brüchert et al. Citation2021a). As a result, the infrastructure is constantly being developed in favour of motorised transport and, on the other hand, puts all other types of mobility at a disadvantage.
In fact, however, the share of walking for transport increases with age (Nobis Citation2019). Especially people with lower education or low income rely on walking and cycling infrastructure, as they less often own a car (MiD Citation2017a). Another group of non-participants in participatory processes are women, whose needs and opinions are in fact of particular importance as they make up a large part of the older population with a higher life expectancy (OECD Citation2019). Lastly, isolated and frail older adults are hard to reach and stay away from public events (Zamora et al. Citation2020). As a result, environmental factors such as noise or green space are often unequally socially distributed and thus can lead to environmental health inequalities (Bolte et al. Citation2018). This relationship is particularly evident in cities (Fecht et al. Citation2015, Flacke et al. Citation2016). The situation and requirements of smaller cities or more rural areas with regard to their age-friendly environments is less studied (Cerin et al. Citation2017).
From a public health perspective, the goal is to design measures in urban development in such a way that no disadvantages arise among certain population groups, neither in the decision-making process nor in the effects. In spatial planning procedures in Germany, the public health department has the opportunity to bring in the public health professionals’ expertise e.g. by emphasizing the need of vulnerable or disadvantaged people to prevent health inequalities. However, this opportunity is often not taken up, perhaps because public health expertise on cross-cutting topics such as age-friendly environments is lacking (Brüchert et al. Citation2021a).
This study aims to broaden the knowledge about the requirements for the design of the living environment of different groups among older adults living in less dense areas. The results can support public health authorities to bring in a health perspective into urban planning processes to foster age-friendly environments and prevent environmental inequalities. There are two primary research questions. Firstly, what are important urban design features for older adults living in less dense areas? And secondly, are there differences in preference and importance of urban design features by gender, age, mobility impairments, education, household income, mobility type and area of residence among older adults living in less dense areas? This study may therefore also inform local urban planning departments and decision-makers about demands on age-friendly urban design features of groups that are often underrepresented in participation processes.
Methods
Study design, sample and study area
To study the mobility behaviour and environmental circumstances of older adults living in less dense areas, a cross-sectional postal survey was conducted. The survey is part of the inter- and transdisciplinary project AFOOT: Securing urban mobility of an aging population (Brüchert et al. Citation2017).
The sample included people aged 65 years and older who live in the Metropolitan Region of Bremen-Oldenburg in northwest Germany. The study area comprises of eleven rural districts and two urban municipalities (each with fewer than 100,000 inhabitants) in the state of Lower Saxony. The topography is mainly flat. In terms of land use, around 64% is for agriculture on average and only 6% each of the area is infrastructure and residential development (DWD Citation2018). The proximity to the sea ensures relatively mild winters and moderately warm summers with an average rainfall per month of 66 mm (DWD Citation2018).
In total, around 1.9 million people live in this area, of which more than 400,000 are aged 65 or older. Sampling was carried out by the 117 residents’ registration offices of the included districts and municipalities. The number of persons to be drawn per registration office depended on the population structure of the respective spatial unit. The data collection took place between May and September in 2019. A total of 11,000 questionnaires were mailed together with a letter explaining the purpose of the study, the protocol for data processing, and a declaration of consent. A prepaid envelope was provided to return the questionnaire and consent form. No incentive was offered for participation and no reminder was sent. The total response rate was 20.56%. Further details on the survey can be found in Citation2021b. The ethics committee of the University of Bremen approved the survey (ethics vote 20181205).
Measures
The questionnaire comprised 49 questions in total. Wherever possible, validated and nationally or internationally established question modules were used. The questionnaire was tested and discussed twice in focus groups with the target population to adapt the questions to the German context. The first group consisted of five persons aged 68–74 years. Changes that are relevant for the measures presented here mainly included: Change of the word ‘Gehweg’ (roughly ‘walking path’ in English) to ‘Bürgersteig’ (roughly ‘sidewalk’ in English) and reducing the income categories, as this was perceived as a sensible information. Regarding the design of the questionnaire, the grey levels in the marked lines were darkened and two filter questions were removed for easier handling. No further adjustments were necessary after the second pretest (four persons, 65–85 years).
Socio-demographics
Participants reported their gender in a binary response field (‘Male’, ‘Female’). Age was calculated using year of birth and is presented in four age categories. Educational level was measured through a three-category version of the International Standard Classification of Education (ISCED) (UNESCO-UIS Citation2006): ‘Low’ (ISCED 0–2); ‘Middle’ (ISCED 3–4); and ‘High’ (ISCED 5–6). Income was measured as equivalized disposable household income according to the OECD-modified scale (OECD Citation2013). Considering the average equivalized disposable income and the poverty line of Lower Saxony (poverty line 1016 € (Statistische Ämter des Bundes und der Länder Citation2018)) participants were grouped into the categories ‘Low’ (equivalized disposable income < 60% median = risk of poverty), ‘Middle’ (≥ 60% median and ≤ median) and ‘High’ (> median).
Mobility impairments
Participants reported if they had any mobility impairments: ‘Yes, I have a walking disability’ – ‘Yes, I have a visual impairment’ – ‘Yes, I have (an) other mobility impairment(s)’ – ‘No, I don’t have mobility impairments’. Answers were dichotomized into ‘None’ versus ‘At least one’.
Mobility types
Mobility was assessed by asking about the frequency of different transport modes (Eggs et al. Citation2018). Participants indicated separately how often they usually walk, cycle (with a conventional bicycle), use an e-bicycle, or drive a car as a means of transport: ‘Daily or almost daily’; ‘3–4 days/week, ‘1–2 days/week, ‘1–3 days/month’, ‘on a less than monthly basis’, or ‘never’. To define different mobility types, the authors agreed to divide respondents into four mobility types: actively mobile (walking, cycling or e-biking for transport at least 3 days/week, driving a car less often), mixed mobile (walking, cycling or e-biking for transport at least 3 days/week and driving a car at least 3 days/week), car-oriented (driving a car at least 3 days/week, walking, cycling or e-biking for transport less often), not very mobile (all forms of transport activity less often than 3 days/week).
Area of residence
Area of residence is presented in four categories according to the classification of the Federal Institute for Research on Building, Urban Affairs and Spatial Development (BBSR Citation2017) based on the participant’s reported municipality: ‘Medium-sized town’ (20,000 – <100,000 inhabitants), ‘Larger small town’ (10,000 – <20,000 inhabitants), ‘Small town’ (5,000 – <10,000 inhabitants or at least basic central function), ‘Rural community’ (<5,000 inhabitants).
Features of urban design
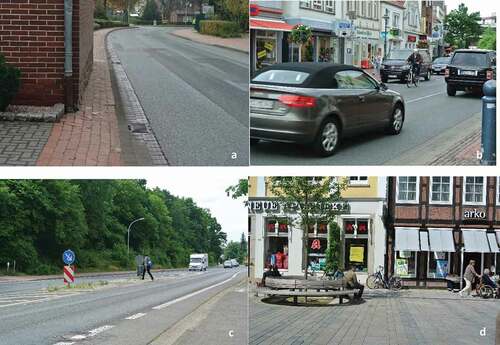
Participants were asked to rate the importance of 21 features of the design of street space (see ) on a 4-point scale: ´Important’, ‘Fairly important’, ‘Fairly unimportant’ and ‘Unimportant’. The list of urban design features is based on research about built environment determinants on walking among older adults (Moran et al. Citation2014) and results from workshops with practitioners on indicator development (Brüchert et al. Citation2016). Answers were dichotomized into ‘Important’ versus all other options. With over 90% of features being ticked ‘Important’ or ‘Fairly important’ (data not shown), we intended that this strict separation of ‘Important’ against all other options emphasizes those factors that are really important to the people. The urban design features were grouped for this analysis in three categories relevant for urban planning (see ). Examples of typical design features of the study region can be seen in photos a-d.
Table 1. Exact wording of the urban design features by categories relevant for urban planning.
Photographs a-d. Typical urban design features faced by older adults in the study area. a) Space is distributed in favor of a continuous width of the street, instead of a wide footpath. People walking side by side, with a rollator or a pushchair have to swerve onto the road to avoid the obstacle. b) With parked cars on one side and heavy traffic on the street, cycling is quite challenging. c) Crossing wide streets with heavy traffic and high speeds can become an insurmountable barrier in old age, even with the support of a pedestrian island. d) A car-free walking area with a flat surface for walking, access to stores and shaded benches for resting represents a high quality of stay.
Statistical analysis
For this analysis, respondents were excluded if they were living in an institution (e.g. an aged care facility) (n = 48) and if they had missing data on any of the 21 urban design features (n = 367). The final sample consisted of 1,836 older adults.
A matrix of all seven subgroup variables was compiled to describe the participants in terms of socioeconomic position (gender, age groups, education, household income), state of health (mobility impairments), mobility type, and place of residence. Descriptive statistics (relative frequencies) of 21 features of the design of street space rated as ‘important’ were calculated for the whole sample and stratified for the seven subgroups already described in the matrix. The results are presented as radar chart. The radar chart (also called web chart or spider chart) is a graphical method to easily visualize equal or unequal points of two or more variables. It is a mixture of table, bar and pie charts (Stapelkamp Citation2012).
Furthermore, the urban design features were also assigned a rank according to the feature most frequently assessed as ‘important’. The reference categories used for the calculation and presentation of the ranks are; women, people aged 80+ years, people with mobility impairments, people with low education, people with low household income, actively mobile people, and people living in a rural community. Chi2-tests were performed to explore differences in urban design preferences by social characteristics, health status, mobility type and area of residence. To account for multiple testing, the Bonferroni adjusted p-value below 0.0034 is to be interpreted as statistically significant (Abdi Citation2007).
All analyses were carried out using SAS statistical software package version 9.4 (SAS Institute, Cary, NC, USA).
Results
Characteristics of the study population are presented in .
Table 2. Characteristics of the study population.
The mean age of the study population was 74 years (data not shown). In the highest age group (80+ years), the proportion of people with low education (16%), at least one mobility impairment (64%) and little mobility (22%) were more than two to nearly four times higher than in the youngest age group (6%, 25% and 6%, respectively). Overall, more men took part in the study, with this difference larger in small towns and rural communities. Compared to men, women were more likely to have a low (13.2% vs. 2.6%) or medium (63.6% vs. 49.8%) education. Although no great difference in mobility impairments could be observed between genders, 69% of men could be characterized as mixed mobile or car-oriented compared to 48.8% of women, who were mainly active mobile. The mobility types of mixed mobility and car-orientation were further characterized by high education and high household income. Compared to people with high household income, people with low to medium household income were mainly in the active mobility or little mobility groups, lived in rural communities and had more often at least one mobility impairment. Active mobility was most prevalent in medium-sized towns and least prevalent in small towns. In small towns, most people were mixed mobile or car-oriented.
Urban design features
Ratings of the urban design features are presented as radar charts sorted by three categorisations of the urban design features. Those radar charts demonstrating a significant difference in rating of the urban design features by subgroups are presented in the main paper. The others can be found in the supplemental material. Rankings of the urban design features, details on percentages and results of the Chi2-test are presented as tables of which most can be found in the supplemental material.
All participants
With regard to the urban design features that were most frequently classified as ‘important’, these could be assigned to the safety features (see and also Figure A1 in the supplemental material): crime safety (81%, m), road safety (80%, n), surface quality (71%, i), good lighting (71%, j), and crossings (68%, o). Furthermore, barrier-free paths (q) and space to walk (r) as urban design quality features were rated as important by around 60% of all older adults in this study. Wayfinding features (f) were the amenities most frequently classified as ‘important’ by nearly half of the participants. Overall, the least important features were drinking water dispensers (g), ground floor zones with shop windows (s) and attractive buildings (t) (see ).
Table 3. Ranking of urban design features rated as ‘important’ for all participants (n = 1836).
Gender
There are no major differences in the ranking of urban design features by gender (see Table A1), with the exception that for women, good lighting was rated as ‘important’ more often than surface quality, and car parking spaces more often than separate cycle and footpaths compared to men. What is striking, however, is the emphasis placed on the individual features: women rated all features as ‘important’ more often than men (see ), of which 13 differences are statistically significant. For example, 69% of women consider ‘space to walk’ to be important, whereas only 56% of men rate it that way. The greatest differences (>10%) emerged for safety aspects (f – good lighting, o – crossings, p – separate cycle and footpaths), quality features (q – barrier-free paths, r – space to walk), and amenities (b – waste bins, h – places for all generations).
Figure 1. Differences in rating of the urban design features as ‘important’ by gender.
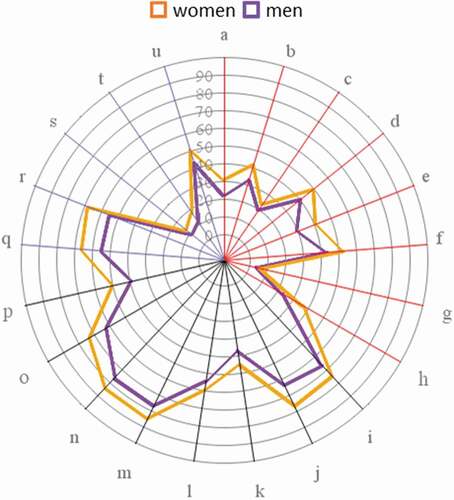
Figure 2. Differences in rating of the urban design features as ‘important’ by age groups.
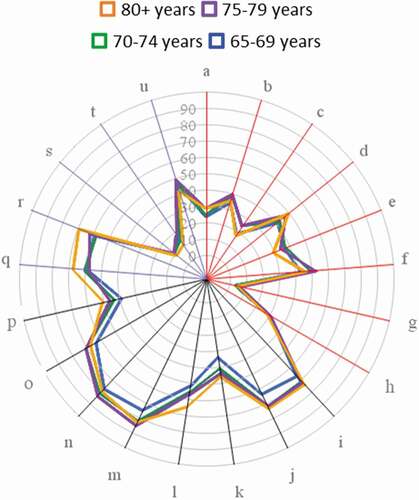
Figure 3. Differences in rating of the urban design features as ‘important’ by educational level.
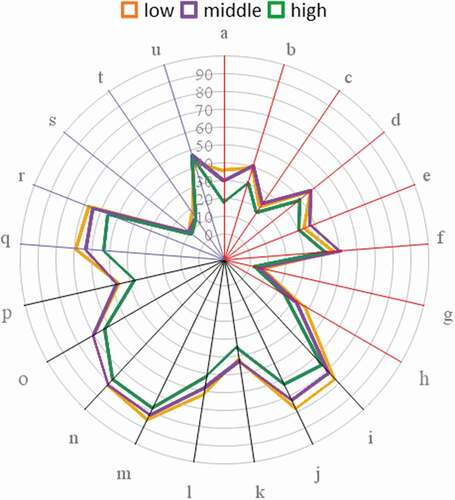
Figure 4. Differences in rating of the urban design features as ‘important’ by mobility type.
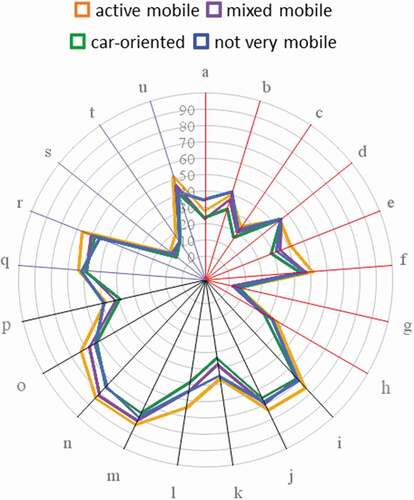
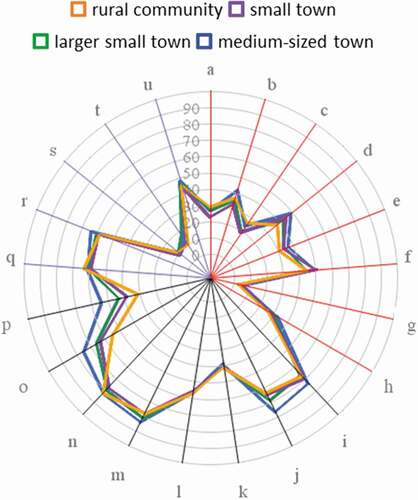
Figure 5. Differences in rating of the urban design features as ‘important’ by area of residence.
Legend of for urban design features in three categories relevant for urban planning
Age
We observed a slight trend in importance by age group especially for the safety features speed reduction (l) and little car traffic (k) (see ). Good lighting (j) and crime safety (m) were both rated less important by the age group 65–69 years compared to all other age groups (70+ years). The feature space to walk (r) was most important for the 80+ years (>10% compared to 65–74 years). The most pronounced difference in ranking was observed for separate cycle- and footpath (p). These were ranked higher by the age group 80+ years (9th place) compared to the other age groups (11–13th place) which had trees and planting (u) on 9th/10th place (see Table A2). Also, for the youngest age group, parking space for bicycles (e) were ranked 13th and little car traffic (k) 15th, whereas the other age groups ranked these features the other way round.
Mobility impairments
The assessment of the urban design features between those respondents with or without mobility impairments was largely consistent. Exceptions were found in particular with regard to seating possibilities (a, difference 11%) and barrier-free paths (q, difference 9%). These were rated as ‘important’ more often by people with mobility impairments (see Figure A2 and Table A3).
Education
People with middle and low educational level rate the urban design features quite similar to each other, whereas people with a high educational level on average rate most of the urban design features as less important (see ). The greatest difference was observed for the presence of seating possibilities and benches (a): people with low education rated benches as ‘ important’ twice as often compared to people with high education. However, it only ranked 16th in the sequence of urban design features (see Table A4). Other great differences (>10% difference between low and high education) emerge for good lighting (j) and speed reduction (l) as safety features, barrier-free paths (q) and space to walk (r) as urban design quality features and places for all generations (h) as amenity (see and Table A4).
Household income
The difference in the assessment of the importance of individual urban design features is not as pronounced in different household income categories as in other subgroups (see Figure A3). Middle- and high-income groups rate nearly the same features as important in sequence and intensity (see Table A5). The greatest difference (>10%) can be observed for seating/benches (a): decreasing importance with increasing household income.
Mobility type
Actively mobile people showed considerably higher demands on the design of their surroundings and rated almost all urban design features as ‘important’ more often than all other types of mobility (see ). Car-oriented mobility types were least demanding with regards to safety features. The greatest difference between mobility types was observed for speed reduction. 65% of active mobile people believed speed reduction to be important, compared to 55% of mixed mobile and not very mobile and for only 50% of car-oriented people. However, there was no great difference in the ranking of all urban design features: speed reduction ranked 7th and 8th place among all mobility types (see ). Other great differences (>10%) can be observed especially between actively mobile and car-oriented people in terms of little car traffic (k), crossings (o), parking space for bicycles (e) as amenities, and trees and planting in urban design quality. Road safety (n) and space to walk (r) was also more pronounced by actively mobile people compared to not very mobile people. For not very mobile people, the greatest difference in the emphasize put on a design feature was seating/benches (a) compared to mixed mobile people (see ).
Table 4. Ranking of urban design features rated as ‘important’ by mobility type (n=1816)
Table 5. Ranking of urban design features rated as ‘important’ by area of residence (n = 1817).
Area of residence
For area of residence we observed a slight trend in importance of some urban design features (see ). In the case of most safety features, as well as some amenities in public space, people living in medium sized towns rated these features as important more often compared to the other areas of residence. The difference here is so great (>20%) that it also has a major impact on the ranks (see ). For example, for medium-sized to small towns, crossing possibilities (o) ranked 4th or 5th, whereas this design feature only ranked 8th place in rural communities. Furthermore, in medium-sized towns, separate cycle and footpaths (p) occupied 9th place, whereas the smaller the area of residence, the lower the rank (from 12th place in larger small towns to 14th place in rural communities). Overall, the emphasize put on urban design quality features is largely consistent between all areas of residence (see ).
Discussion
The aim of the current study was to describe the preferences of a variety of urban design features among older adults living in less densely populated areas and to explore differences by groups of people that are often underrepresented in participatory processes.
Overall, we observed that the urban design features rated as most important in nearly all subgroups are safety concerns (crime safety, road safety, surface quality, good lighting and crossings) and urban design quality features (barrier-free paths and space to walk). Remarkably, crime safety was rated as important by over 80% of the studied population. A feature often dismissed in most other public health studies is wayfinding, which ranked under the top ten of urban design features in nearly all subgroups. The greatest difference in the strength of assessment was observed for women, people with low education, the oldest old (80+) and actively mobile people. We also observed trends for the importance of urban design features by community size such as an increasing preference for lighting, crossings, and separated cycle- footpath with increasing population size.
Comparison with the literature
Safety regarding crime was rated as important the most often (or second most) in all subgroups of older adults. This is not surprising, as statistics from Germany show that the fear of crime is highest among older people over the age 65, although this age group is in fact the least affected by crime with a crime rate of 5% (Bundeskriminalamt Citation2019). Previous studies have shown a relationship between crime safety and overall physical activity and walking in older adults, but only when assessed as perceived crime safety (Barnett et al. Citation2017). Therefore, objective statistics of crime rates may be less helpful to uncover the potential influence on older adults’ behaviour such as avoiding to walk along certain areas. Measures in urban planning and architecture can improve natural surveillance, e.g. by cutting back bushes or brighten up underpasses (York and MacAlister Citation2015), or ‘de-escalate’ urban space through light, smell and sound (Schuilenburg and Peeters Citation2018). This accords with our finding on the importance of good lighting, which ranked 3rd or 4th in all subgroups.
Independent of differences in subgroups, surface quality was rated as important by around 71% of the study population. These results reflect those of Van Cauwenberg et al. (Citation2016) who found that sidewalk evenness was rated as the most important factor of a street’s appeal for walking in a qualitative study from Belgium with older participants. Quantitative studies, which only ask about the presence of sidewalks, could not always show a connection with active mobility, especially in older age (Shigematsu et al. Citation2009, Van Cauwenberg et al. Citation2012, Ding et al. Citation2014). These results reflect that the existence of sidewalks alone might be not sufficient, but that their quality also plays a role, especially for older adults. This might be due to fear of falling or accidents from which one does not recover as quickly in old age as in young age (WHO Citation2007b). Fear of falling or accidents might also explain the emphasis put on the other safety features, which were rated as important by over 50% of the participants: traffic safety, good lighting, crossing, barrier-free paths and speed reduction.
One unanticipated finding in our study was that wayfinding was amongst the top ten of important urban design features for all older adults. This attribute has not yet been considered in the concept of age-friendly environments of the WHO (Citation2007a) or in one of the most frequently used questionnaire to assess the perceived built environment for active living (Cerin et al. Citation2013). However, there is a body of literature dealing with wayfinding in communities, mainly from neuroscience, gerontology or architecture (Marquardt Citation2011, Marquez et al. Citation2015, Mishler and Neider Citation2017). They emphasize the importance of the design of signs and its placement, such as distinctiveness, consistency, simplicity, isolation and reassurance (Mishler and Neider Citation2017).
Studies have emphasized the need for rest options in old age for physical activity and active travel (Moran et al. Citation2014, Cerin et al. Citation2017, Wang and Rodiek Citation2019). Surprisingly, however, seating and benches were not among the most commonly regarded features in our study, although it was the second most important amongst street furniture and amenities. A possible explanation for this could be that the actual absence of this feature reduces attention to it, i.e. it is considered less important than other features to which everyone is exposed, such as lighting and traffic safety. It only comes into focus when it is needed earlier, e.g. when health is declining. This could be observed in our study. Although not among the most important features, the rating of seating/benches was one of the design features which often differed in its rating between groups: it was rated as important by 35% of not very mobile people, 32% of women, 30% of the oldest old (80+), 36% of people with low education and low household income, and 33% among those with at least one mobility impairment, while the difference to the counterparts was between 6–18%.
The large difference in nearly all urban design features between genders in our study might be due to the fact that women are more actively mobile (see ). This is in line with mobility studies from Germany (MiD Citation2017b). Consequently, if women walk more, they might have also a higher perception of safety problems and, therefore, rate them as being more important. Our results highlight the need for more stratified analyses in future studies around ageing and urban planning to address these gender differences in demands. According to the review by Cerin et al. (Citation2017), gender has been examined as a moderator in only three studies investigating the relationship between the built environment and active mobility in older adults.
Even less studied is education as moderator (Cerin et al. Citation2017), which should not be neglected with regard to the prevention or reduction of environmental health inequalities (Bolte et al. Citation2018). Our results show a great difference in the importance put on certain urban design features between people with low education and people with high education, especially good lighting, barrier-free paths, seating/benches and places for all generations. At least the first three might be explained, again, by the higher proportion of actively mobile people. People with low socio-economic status are less likely to own a car and so are already more likely to be dependent on environmental factors at a younger age (MiD Citation2017a). Social inequalities may further increase with age, as the group of people with low education is more likely to be affected by mobility impairments (see ). This might also explain the higher demand on barrier-free paths and seating possibilities. The emphasis put on places for all generations by people with low education may be explained by the study area. Many people in our study area probably have their own garden or other types of open spaces and green areas (e.g. fields and forests) within easy reach and places for all generations may not be needed or are not common in more rural areas. In contrast, people with low education may have less access to private green space so that 39% of people with low education rated places for all generations as ‘important’, whereas only 26% of people with high education did so. Places for all generations are important for social contacts and a sense of community. This feature is still understudied in health research, which may be due to definition or conceptualization. Former studies have focused on the relationship between parks and recreational areas with overall physical activity in older adults (Barnett et al. Citation2017).
Surprisingly, there were only slight differences in the emphasis put on certain design features when comparing people with and without mobility impairments. This might be explained by the fact that a great proportion of people with mobility impairments in this study are already not very mobile (see ) and therefore do not pay much more attention on obstacles or favouring design features than their peers. Clarke et al. (Citation2008) have shown that environmental barriers only limit the mobility of people with severe impairments, but not with mild conditions. As disabilities and impairments are very diverse, a quantitative study like this one might not capture these variations in all its dimensions.
Concerning age differences, other studies have demonstrated that parks/open space (Shigematsu et al. Citation2009) and benches/sitting facilities (Cerin et al. Citation2014) were positively associated with walking among ≥75 year olds and street lights with cycling among younger women (<75 years old). In contrast, we found no difference in age groups concerning seating/benches, trees/planting were more important for the younger age group and good street lighting for the oldest. However, we just asked about the importance of the features, while the other studies examined its relationship with walking. Our study supports the widespread recognition that the implications of age on health and mobility are very diverse and can often not explain differences or similarities alone (WHO Citation2015). They might be due to physical abilities (see mobility impairments) or the use of the environment (see mobility types). However, age is a helpful indicator if no other data is available and should be considered in public health studies and urban planning.
From the trends in area of residence in our results, it can be seen that the size of the city or municipality can play a role in terms how people value different urban design features. The importance of certain items, such as road crossings and separate cycle and footpaths, increased with the number of inhabitants in this study. This may be explained by the greater amount of car traffic in urban settings which increases the demand for safe infrastructure. Former studies on the role of the built environment for older adults have mainly focused on urban areas (Cerin et al. Citation2017).
Finally, the present study stratified results by mobility type. In line with mobility studies from Germany, our study showed that the share of transport modes changes from driving to active mobility in old age (Nobis Citation2019). Furthermore, we showed higher demands on road safety, crossings, space to walk, speed reduction and little car traffic as safety features, but also the importance of trees and planting and parking space for bicycles for actively mobile compared to car-oriented people. This accords with earlier results from qualitative studies highlighting the importance of road safety features and aesthetics such as presence of greenery for older adults in terms of physical activity (Moran et al. Citation2014). However, quantitative studies on the influence of road and pedestrian safety on the physical activity and active travel behaviour of older adults have not shown any relationship (Cerin et al. Citation2017, Barnett et al. Citation2017). This inconsistency may be due to the fact that perceived safety was often measured as an aggregated variable compiled of different features or by objective measures. Our results provide further support for the argument that future studies investigate single items of safety, so that more precise statements can be made for practice. This will help us to better understand the impact of safety issues on the active mobility behaviour of older adults. Greenery and aesthetically pleasing environments, however, have been shown to be positively related to walking and overall physical activity (Barnett et al. Citation2017). This combination of findings provides some support for the importance of trees and greenery in the community.
Strengths and limitations
This study involves a large number of older adults living in less densely populated areas, which contributes to the knowledge of age-friendly aspects of urban design in settings that have otherwise not been widely researched. A second strength of this study is the assessment of a comprehensive set of urban design features including aspects of safety in public spaces, design quality, and amenities. Thirdly, we present differences in the preferences of subgroups that are often underrepresented in participatory processes and are most affected by the built environment. Investigating results by mobility impairments as well as types of mobility are both subgroups that are not currently represented in official statistics and are not represented much in other research in this space. This detailed information is necessary to inform urban and transport planners in designing age-friendly environments for healthy ageing and ageing in place.
However, this study is not without limitations. The generalisability is somewhat limited as men were overrepresented in our study compared to the general population of the age group 65 years and older in the state of Lower Saxony (53% vs. 43%) (Statistische Ämter des Bundes und der Länder Citation2014b) as well as in other regions of the European Union (EU) (EU Citation2019). Yet, in terms of education and household income the characteristics of our study population are comparable with the population of Lower Saxony (Statistische Ämter des Bundes und der Länder Citation2014a, Citation2018) but in terms of income not with the EU population, where there is a higher share of people at risk of poverty (low income in our study) (Eurostat Citation2020).Yet, the proportion of people with at least one mobility impairment may be comparable to the EU (EU Citation2019).Further, although we asked about a great number of urban design features, there might be other features which were not included.
Implications
Important policy implications are indicated by the prominence of safety features in all subgroups. Cooperation with diverse sectors and stakeholders, e.g. the administrative law authority and the police, is recommended to assess concerns and fears of the local residents that can be taken into account in planning processes to help increase perceived safety amongst residents. In this case, other methods such as future workshops or focus groups, might be a better choice to inform urban planning or public health authorities about the needs of older adults (Gray et al. Citation2003).
Furthermore, municipalities should prepare themselves for more older pedestrians in the future (Nobis and Kuhnimhof Citation2018). Features such as the quality of sidewalks or traffic safety were rated as very important. The maintenance of good paths, repairing uneven surfaces and implementing speed limits are measures that can also be implemented in the short term with a smaller budget in smaller communities. Urban and transport planning has to consider the need of all road users as an environment favouring only automobile use excludes some groups of people (Khayesi Citation2020).
Regarding especially the differences for female participants, people with low education, the oldest old and active mobile people, municipalities should make more of an effort in integrating these groups into participating processes. They should work together with outreaching social services and their events (i.e. coffee or tea get-together, card games, choir) or (sports) clubs where active members are still in contact to passive members. They probably know best how to reach the age group or less active residents. Our study illustrates the importance of considering the opinion of people who tend to participate in urban planning processes less often and have special requirements for the amenities of their environment. An example are places for all generations which were rated as important more often by people with low education. Although these features in total were not among the top ten features, they should be taken into account in urban planning in light of environmental inequalities – because it is precisely those people who do not have good access to private open space who are dependent on such attributes of shared public space to enable social contacts.
It is precisely, that in order to prevent such environmental inequalities, the public health authorities have to bring in their knowledge in community development concepts or transport plans. An intersectoral approach is required for effective cooperation with urban and transport planners, whose tools are the keys to an age-friendly environment. This study contributes to the knowledge of age-friendly aspects of urban design in settings that have otherwise not been widely researched. The presentation as radar charts may furthermore support the communication with politicians and the public. The way we analysed and presented the survey data may also be an easy adaptable example for municipalities with limited resources. When collecting own data, socioeconomic and health indicators should be collected for the analysis by subgroup, but if not available, age groups up to 80+ years can be used as proxy.
Implications for research emerge in case of including wayfinding as an important factor for older adults and to explore its impact on mobility, healthy ageing and ageing in place in future studies. We recommend interdisciplinary research between public health, gerontology, neuroscience, architecture and others to benefit from existing knowledge and resources. Furthermore, area of residence or degree of urbanization should be taken into account in the interpretation of study results to inform decision makers for setting priorities, especially in smaller municipalities where resources often are limited.
Conclusion
The data we collected and analysed offer a portrait of urban design features important for diverse groups of older adults living in less densely populated areas. Especially in smaller towns and rural communities with limited financial and personal resources, the findings may serve as a valuable source of information to characterize age-friendly environments and start a discourse about features to be prioritized. On the other hand, the findings may enable public health authorities to pronounce the health perspective in statements on urban planning procedures for an age-friendly design. Strategies to promote healthy ageing in one’s own community must take into account determinants of health-related behaviour, especially fear of crime and road safety. Lastly, the variation of urban design features shown to be important amongst the different groups of participants reveals the need to incorporate these perceptions in urban planning in order to prevent environmental health inequalities.
Ranking of urban design features rated as ‘important’ by household income (n = 1790)
Download MS Excel (11.6 KB)Ranking of urban design features rated as ‘important’ by educational level (n = 1818)
Download MS Excel (11.5 KB)Ranking of urban design features rated as ‘important’ by mobility impairments (n = 1814)
Download MS Excel (11.2 KB)Ranking of urban design features rated as ‘important’ by age groups (n = 1773)
Download MS Excel (12.3 KB)Ranking of urban design features rated as ‘important’ by gender (n = 1774)
Download MS Excel (12.3 KB)Differences in rating of the urban design features as ‘important’ by all mobility impairment
Download TIFF Image (174.1 KB)Rating of urban design features as ‘important’ by all participants
Download TIFF Image (168.5 KB)Disclosure statement
The authors declare that they have no competing interests.
Supplemental data
Supplemental data for this article can be accessed here.
Correction Statement
This article has been corrected with minor changes. These changes do not impact the academic content of the article.
Additional information
Funding
Notes on contributors
Tanja Brüchert
The authors collaborate in the project AFOOT, which pursues an inter- and transdisciplinary approach to identify entry points for health and equity assessment in urban planning procedures, with a particular focus on small and medium-sized towns. Therefore, the research team is also interdisciplinary: Tanja Brüchert is a public health scientist and PhD candidate and works as research associate in AFOOT. Gabriele Bolte is Professor of Social Epidemiology at the University of Bremen and executive director of the Institute of Public Health and Nursing Research. She leads the project in close coordination with Sabine Baumgart, who is a retired Professor of Urban and Regional Planning from TU Dortmund University. Currently, she is an associate member of Gabriele Bolte’s department and president of the ARL - Academy for Spatial Development in the Leibniz Association.
References
- Abdi, H., 2007. The Bonferonni and Šidák corrections for multiple comparisons. In: N.J. Salkind, ed. Encyclopedia of measurement and statistics. Sage: Thousand Oaks, 103–107.
- Barnett, D.W., et al., 2017. Built environmental correlates of older adults’ total physical activity and walking: a systematic review and meta-analysis. International journal of behavioral nutrition and physical activity, 14 (1), 103. doi:10.1186/s12966-017-0558-z
- BBSR. 2017. Laufende Stadtbeobachtung - Raumabgrenzungen. Stadt- und Gemeindetypen in Deutschland [Ongoing city observation - spatial delimitations. Types of cities and municipalities in Germany}. Bundesinstitut für Bau-, Stadt- und Raumforschung (BBSR). Available from: https://www.bbsr.bund.de/BBSR/DE/forschung/raumbeobachtung/Raumabgrenzungen/deutschland/gemeinden/StadtGemeindetyp/StadtGemeindetyp.html [Accessed 11 November 2020].
- Beyer, F.R. and Ker, K., 2009. Street lighting for preventing road traffic injuries. Cochrane database of systematic reviews. doi:10.1002/14651858.CD004728.pub2
- Bolte, G., et al., 2018. Environmental justice as an approach to tackle environmental health inequalities. Bundesgesundheitsblatt Gesundheitsforschung Gesundheitsschutz, 61 (6), 674–683. doi:10.1007/s00103-018-2739-6
- Brüchert, T., et al., 2016. Securing active aging in place. Access by Design, 146, 32–33.
- Brüchert, T., et al., 2017. Intersectoral collaboration of public health and urban planning for promotion of mobility and healthy ageing: protocol of the AFOOT project. Cities & health, 1 (1), 83–88. doi:10.1080/23748834.2017.1312086
- Brüchert, T., et al., 2021a. Barriers, facilitators, and intersectoral collaboration for promoting active mobility for healthy aging – a qualitative study within local government in Germany. International journal of environmental research and public health (under review).
- Brüchert, T., Quentin, P., and Bolte, G., 2021b. The relationship between perceived built environment and cycling or e-biking for transport among older adults – a cross-sectional study. BMC public health (under review).
- Bundeskriminalamt, 2019. Der Deutsche Viktimisierungssurvey 2017 [The German Victimisation Survey 2017]. Wiesbaden: Bundeskriminalamt.
- Burton, E.J., Mitchell, L., and Stride, C.B., 2011. Good places for ageing in place: development of objective built environment measures for investigating links with older people’s wellbeing. BMC public health, 11 (1), 839. doi:10.1186/1471-2458-11-839
- Cairns, J., et al., 2014. Go slow: an umbrella review of the effects of 20 mph zones and limits on health and health inequalities. Journal of public health, 37 (3), 515–520. doi:10.1093/pubmed/fdu067
- Cerin, E., et al., 2013. Sharing good NEWS across the world: developing comparable scores across 12 countries for the neighborhood environment walkability scale (NEWS). BMC public health, 13 (1), 309. doi:10.1186/1471-2458-13-309
- Cerin, E., et al., 2014. Ageing in an ultra-dense metropolis: perceived neighbourhood characteristics and utilitarian walking in Hong Kong elders. Public health nutrition, 17 (1), 225–232. doi:10.1017/S1368980012003862
- Cerin, E., et al., 2017. The neighbourhood physical environment and active travel in older adults: a systematic review and meta-analysis. International journal of behavioral nutrition and physical activity, 14 (1), 15. doi:10.1186/s12966-017-0471-5
- Clarke, P., et al., 2008. Mobility disability and the urban built environment. American journal of epidemiology, 168 (5), 506–513. doi:10.1093/aje/kwn185
- Ding, D., et al., 2014. Neighborhood environment and physical activity among older adults: do the relationships differ by driving status? Journal of aging and physical activity, 22 (3), 421–431. doi:10.1123/JAPA.2012-0332
- DWD, 2018. Klimareport Niedersachsen [Climate report lower saxony]. Offenbach am Main: Deutscher Wetterdienst.
- Eggs, J., et al., 2018. Mobilität in Deutschland – miD Methodenbericht. Anhang. Studie von infas, DLR, IVT und infas 360 im Auftrag des Bundesministeriums für Verkehr und digitale Infrastruktur [Mobility in Germany - MiD method report. Appendix. Study by infas, DLR, IVT and infas 360 on behalf of the Federal Ministry of Transport and Digital Infrastructure]. Bonn: Berlin.
- EU, 2019. Ageing Europe — looking at the lives of older people in the EU. Luxembourg: Publications Office of the European Union.
- Eurostat. 2020. People at risk of poverty or social exclusion by age and sex (online data code: ILC_PEPS01). Available from: https://ec.europa.eu/eurostat/databrowser/view/ilc_peps01/settings_1/table?lang=en.
- Ewing, R. and Cervero, R., 2001. Travel and the built environment: a synthesis. Transportation research record, 1780 (1), 87–114. doi:10.3141/1780-10
- Ewing, R. and Cervero, R., 2010. Travel and the built environment. Journal of the american planning association, 76 (3), 265–294. doi:10.1080/01944361003766766
- Farias, I. and Widmer, S., 2017. Ordinary smart cities. How calculated users, professional citizens, technology companies and city administrations engage in a more-than-digital politics. TECNOSCIENZA: Italian journal of science & technology studies, 8 (2), 43–60.
- Fecht, D., et al., 2015. Associations between air pollution and socioeconomic characteristics, ethnicity and age profile of neighbourhoods in England and the Netherlands. Environmental pollution, 198, 201–210. doi:10.1016/j.envpol.2014.12.014
- Flacke, J., et al., 2016. Mapping environmental inequalities relevant for health for informing urban planning interventions-a case study in the City of Dortmund, Germany. International journal of environmental research and public health, 13 (7), 711. doi:10.3390/ijerph13070711
- Gardener, M.A. and de Oliveira, F.L., 2020. Urban environment cues for health and well-being in the elderly 2019. Cities & health, 4 (1), 117–134. doi:10.1080/23748834.2019.1636506
- Golant, S.M., 2011. Chapter 15 - the changing residential environments of older people. In: R.H. Binstock and L.K. George, eds. Handbook of aging and the social sciences (7th). Academic Press: San Diego, 207–220.
- Gray, D.B., Gould, M., and Bickenbach, J.E., 2003. Environmental barriers and disability. Journal of architectural and planning research, 20, 29–37.
- Innes, J.E. and Booher, D.E., 2004. Reframing public participation: strategies for the 21st century. Planning theory & practice, 5 (4), 419–436. doi:10.1080/1464935042000293170
- Kelly, P., et al., 2014. Systematic review and meta-analysis of reduction in all-cause mortality from walking and cycling and shape of dose response relationship. International journal of behavioral nutrition and physical activity, 11 (1), 132. doi:10.1186/s12966-014-0132-x
- Kemperman, A., et al., 2019. Loneliness of older adults: social network and the living environment. International journal of environmental research and public health, 16 (3), 406. doi:10.3390/ijerph16030406
- Kerr, J., Rosenberg, D., and Frank, L., 2012. The role of the built environment in healthy aging. Journal of planning literature, 27 (1), 43–60. doi:10.1177/0885412211415283
- Khayesi, M., 2020. Vulnerable road users or vulnerable transport planning? Frontiers in sustainable cities, 2.
- Köckler, H., 2014. Nur die Einladung reicht nicht. Teilhabe als Schlüssel umweltbezogener Gerechtigkeit [Just the invitation’s not enough. Participation as the key to environmental justice]. politische ökologie, 32, 43–48.
- Löfqvist, C., et al., 2013. Voices on relocation and aging in place in very old age—a complex and ambivalent matter. The gerontologist, 53 (6), 919–927. doi:10.1093/geront/gnt034
- Marquardt, G., 2011. Wayfinding for people with dementia: a review of the role of architectural design. Herd, 4 (2), 75–90. doi:10.1177/193758671100400207
- Marquez, D.X., et al., 2015. Older adult strategies for community wayfinding. Journal of applied gerontology, 36 (2), 213–233. doi:10.1177/0733464815581481
- Mathers, J., Parry, J., and Jones, S., 2008. Exploring resident (non-)participation in the UK new deal for communities regeneration programme. Urban Studies, 45 (3), 591–606. doi:10.1177/0042098007087336
- Meunier, C., 2006. Öffentlichkeitsbeteiligung in der Bauleitplanung. Bedeutung der Aarhus-Konvention und der ihrer Umsetzung dienenden EU-Richtlinien – Öffentlichkeitsbeteiligung in Berlin-Brandenburg im Praxistest – arbeitshilfe für die Praxis (UVP spezial, Bd. 20) [Public participation in urban land use planning. Significance of the Aarhus Convention and the EU Directives serving its implementation - public participation in Berlin-Brandenburg in practical test - Guidelines for practice (UVP spezial, Vol. 20)]. Dortmund: Dortmunder Vertrieb – Verl. für Architektur, Bau- und Planungsliteratur.
- MiD 2017a. Mobilität in Tabellen (MiT 2017): PKW Verfügbarkeit nach Bildungsabschluss und Alter (Eigene Berechnungen). [Mobility in tables (MiT 2017): car availability by educational level and age (own calculations)]. Mobilität in Deutschland. Available from: https://mobilitaet-in-tabellen.dlr.de/mit/login.html?brd [Accessed 11 November 2020].
- MiD. 2017b. Mobilität in Tabellen (MiT 2017): wege ausschließlich zu Fuß nach Geschlecht und Alter (Eigene Berechnungen). [Mobility in tables (MiT 2017): travelling exclusively on foot by sex and age (own calculations)]. Available from: https://mobilitaet-in-tabellen.dlr.de/mit/login.html?brd.
- Min, L.I., et al., 2012. Effect of physical inactivity on major non-communicable diseases worldwide: an analysis of burden of disease and life expectancy. The Lancet, 380 (9838), 219–229. doi:10.1016/S0140-6736(12)61031-9
- Mishler, A.D. and Neider, M.B., 2017. Improving wayfinding for older users with selective attention deficits. Ergonomics in design: the magazine of human factors applications, 25 (1), 11–16. doi:10.1177/1064804616659992
- Moran, M., et al., 2014. Understanding the relationships between the physical environment and physical activity in older adults: a systematic review of qualitative studies. International journal of behavioral nutrition and physical activity, 11 (1), 79. doi:10.1186/1479-5868-11-79
- Musselwhite, C., 2015. Environment–person interactions enabling walking in later life. Transportation Planning and Technology, 38 (1), 44–61. doi:10.1080/03081060.2014.976983
- Musselwhite, C., Holland, C., and Walker, I., 2015. The role of transport and mobility in the health of older people. Journal of Transport & Health, 2 (1), 1–4. doi:10.1016/j.jth.2015.02.001
- Nobis, C., 2019. Mobilität in Deutschland - MiD Analysen zum Radverkehr und Fußverkehr. Studie von infas, DLR, IVT und infas 360 im Auftrag des Bundesministeriums für Verkehr und digitale Infrastruktur [Mobility in Germany - MiD analyses of bicycle traffic and foot traffic. Study by infas, DLR, IVT and infas 360 on behalf of the Federal Ministry of Transport and Digital Infrastructure]. Bonn: Berlin.
- Nobis, C. and Kuhnimhof, T., 2018. Mobilität in Deutschland - MiD Ergebnisbericht Studie von infas, DLR, IVT und infas 360 im Auftrag des Bundesministeriums für Verkehr- und digitale Infrastruktur [Mobility in Germany - MiG Results Report. Study by infas, DLR, IVT and infas 360 on behalf of the federal ministry of transport and digital infrastructure]. Bonn: Berlin.
- OECD, 2013. OECD guidelines for micro statistics on household wealth. OECD Publishing: Paris.
- OECD, 2019. Health at a glance 2019: OECD indicators. Paris: OECD Publishing.
- Rachele, J.N., et al., 2019. Neighbourhood built environment and physical function among mid-to-older aged adults: A systematic review. Health place, 58, 102137. doi:10.1016/j.healthplace.2019.05.015
- Schuilenburg, M. and Peeters, R., 2018. Smart cities and the architecture of security: pastoral power and the scripted design of public space. City, Territory and Architecture, 5 (1), 13. doi:10.1186/s40410-018-0090-8
- Shergold, I., Parkhurst, G., and Musselwhite, C., 2012. Rural car dependence: an emerging barrier to community activity for older people. Transportation Planning and Technology, 35 (1), 69–85. doi:10.1080/03081060.2012.635417
- Shigematsu, R., et al., 2009. Age differences in the relation of perceived neighborhood environment to walking. Medicine & science in sports & exercise, 41.
- Stapelkamp, T., 2012. Informationsvisualisierung. Web - Print - Signaletik. Erfolgreiches Informationsdesign: leitsysteme, Wissensvermittlung und Informationsarchitektur [Information visualization. Web - Print - Signaling. Successful information design: guidance systems, knowledge transfer and information architecture]. Springer: Heidelberg.
- Statistische Ämter des Bundes und der Länder. 2014a. Bevölkerung nach Alter (5er-Jahresgruppen) und höchstem Schulabschluss. Ergebnis des Zensus 2011 zum Berichtszeitpunkt 9. Mai 2011 [Population by age (5-year groups) and highest school-leaving qualification. Result of the 2011 census as of the reporting date 9 May 2011]. Available from: https://ergebnisse.zensus2011.de/#StaticContent:03,BEG_1_6_6,m,table [Accessed 11 November 2020].
- Statistische Ämter des Bundes und der Länder. 2014b. Bevölkerung nach Geschlecht und Alter (5er-Jahresgruppen). Ergebnis des Zensus 2011 zum Berichtszeitpunkt 9. Mai 2011. [Population by gender and age (5-year groups). Result of the 2011 census as of the reporting date 9 May 2011]. Available from: https://ergebnisse.zensus2011.de/#StaticContent:03,BEG_1_1_1,GESCHLECHT-1,table [Accessed 11 November 2020].
- Statistische Ämter des Bundes und der Länder. 2018. Armutsgefährdungsschwelle nach Bundesländern für einen Einpersonenhaushalt im Zeitvergleich [At-risk-of-poverty threshold by german Länder for a single-person household in time comparison]. Available from: https://www.destatis.de/DE/Themen/Gesellschaft-Umwelt/Soziales/Sozialberichterstattung/Tabellen/liste-armutsgefaehrungs-schwelle.html [Accessed 11 November 2020].
- UN, 2019. World population prospects 2019: volume i: comprehensive tables. United Nations: Department of Economic and Social Affairs, Population Division.
- UNESCO-UIS, 2006. International standard classification of education. Unesco 1997. Montreal: UIS.
- Van Cauwenberg, J., et al., 2012. Physical environmental factors related to walking and cycling in older adults: the Belgian aging studies. BMC public health, 12 (1), 142. doi:10.1186/1471-2458-12-142
- Van Cauwenberg, J., et al., 2016. Street characteristics preferred for transportation walking among older adults: a choice-based conjoint analysis with manipulated photographs. International journal of behavioral nutrition and physical activity, 13 (1), 6. doi:10.1186/s12966-016-0331-8
- Wang, X. and Rodiek, S., 2019. Older adults’ preference for landscape features along urban park walkways in Nanjing, China. International journal of environmental research and public health, 16 (20), 3808. doi:10.3390/ijerph16203808
- WHO, 2007a. Global age-friendly cities: a guide. Geneva: World Health Organization.
- WHO, 2007b. WHO global report on falls prevention in older age. Geneva: World Health Organization.
- WHO, 2015. World report on ageing and health. Geneva: World Health Organization.
- York, T.W. and Don, M., 2015. Chapter 17 - security design considerations for healthcare. In: T.W. York and D. MacAlister, eds. Hospital and healthcare security (sixth edition). Butterworth-Heinemann: Boston, 409–436.
- Zamora, F.M., et al., 2020. Use of community support and health services in an age-friendly city: the lived experiences of the oldest-old. Cities & health, 4 (1), 1–10.