
ABSTRACT
Learning gain is considered to be the distance travelled by students in terms of skills, competencies, content knowledge and personal development. This article discusses the administration experience and tests results from a first year cohort of 675 students at the University of Lincoln who undertook a self-assessment and standardised psychometric test as part of a project to develop measures of learning gain in UK higher education. The tests themselves are shown to be potentially suitable for this purpose however the biggest challenge was student participation and engagement. Various approaches to improve engagement were trialled. Whilst some of these approaches are shown to increase the number of responses, there is no evidence that they increase meaningful task engagement, leading to the conclusion that until this challenge is addressed the validity of learning gain data from bespoke tests is potentially questionable and the value of participation to students as individuals is limited.
Introduction
The role of higher education in the development of human capital, including the skills, knowledge and attributes seen as necessary for a sustainable skilled workforce, and continued social and economic progress, has increasingly become a focus of societal and political agendas (Benjamin, Citation2012a; Tremblay, Lalancette, & Roseveare, Citation2012). This is against a backdrop of changes to fee structures, a call for transparency between higher education institutions and commodification and increased marketisation of higher education (Robinson & Hilli, Citation2016). Much of the existing literature on understanding and measuring student outcomes and learning gain comes from the USA but the recent UK Government’s proposals for higher education (Department for Business, Innovation & Skills [BIS], Citation2016) have made it a sector priority in the UK, arguably underpinned by demands that higher education better equips students with the skills and knowledge demanded by the employment market (Sharar, Citation2016).
Whilst there are ongoing discussions about the meaning of the concept of learning gain (Kandiko Howson, Citation2017), this article uses the definition for the recent RAND report and considers learning gain as ‘the “distance travelled”, or the difference between the skills, competencies, content knowledge and personal development demonstrated by students at two points in time’ (McGrath, Guerin, Harte, Frearson, & Manville, Citation2015, p. xi). Importantly, measuring learning gain is seen as one way to assess teaching quality, potentially providing a diagnostic tool for institutional self-improvement (Thomson & Douglass, Citation2009). In England, the Government White Paper ‘Success as a Knowledge Economy: Teaching Excellence, Social Mobility and Student Choice’ (Business, Innovation & Skills [BIS], Citation2016) sets out the introduction of a Teaching Excellence Framework (TEF) that undertakes national assessments of teaching quality initially at institutional level; the TEF draws on learning gain as a key criterion of quality teaching.
It has long been accepted that students gain much more from their university education than just a degree (Bass, Citation2012; Kuh, Pace, & Vesper, Citation1997), with ‘engaged student learning [being] positively linked with learning gain and achievement’ (Healey, Flint, & Harrington, Citation2014, p. 7). In today’s knowledge economy, the ability to draw on higher order skills to assess and use information effectively is argued by Benjamin (Citation2012b) to be equally, if not more, important than course content itself. Through engagement with their academic course, extra curricula activities and the diverse campus community, students gain a key set of transferable skills and competencies that prepare them for the next stages of their career upon graduation, be it employment or further study. However, there are challenges, not only in identifying accurate measures of the complex and multidimensional process of learning, but also in ensuring meaningful student engagement in the measurement processes.
In partnership with the University of Huddersfield, the University of Lincoln is undertaking a pilot longitudinal, mixed methods learning gain project as part of the Higher Education Funding Council for England (HEFCE) Learning Gain Programme (HEFCE, Citation2016). The project assesses possible means by which to measure the ‘distance travelled’ by students over the three-year period of their undergraduate studies; specifically, it combines outputs from standardised psychometric tests and reflective student self-assessments with data on academic achievement, attendance and involvement in extra-curricular activities. The objectives of the project are to a) establish the feasibility of measuring undergraduate learning gain through standardised psychometric tests combined with reflective student self-assessments, b) through the integration of additional university data sets with psychometric test results, to determine the impact on learning gain of student participation in academic and extra-curricular activities, and, c) to gauge the potential and suitability of this methodological approach for the measurement of learning gain at UK universities. Drawing lessons from the first year of the project at the University of Lincoln (2015–2016), this article explores three key areas:
The test administration and approaches to the challenge of student participation and engagement;
The impact of limited engagement on learning gain data;
Initial thoughts on the potential for this type of methodological approach to provide insight into the measurement of learning gain at UK universities.
The main focus of this article is to give insight into the administrative challenges of measuring learning gain in UK higher education. While some data and statistics are presented to provide context to the discussion, the data collection phase of this longitudinal project is ongoing and a robust statistical review will take place on completion. Given the pilot nature of the project, any data presented in this article cannot be taken as an indication of learning gain at the University of Lincoln. The article concludes with the assertion that whilst the shape of a possible universal measure of learning gain in the UK is currently under development, the major challenge to the success of any proposed new assessment technique is ensuring students are meaningfully engaged in the process. The authors present this work prior to the completion of the study to highlight that early consideration of this engagement challenge is essential to the success of future learning gain metrics.
Defining ‘engagement’
At this point, it is useful to define what is meant by engagement. Student engagement is widely discussed in the academic literature. Kahu (Citation2013) argues that to attempt to understand student engagement it should be viewed as a ‘psycho-social process, influenced by institutional and personal factors, and embedded within a wider social context’ (p. 768). A more practical distinction is used by Trowler (Citation2010) and considers engagement in terms of behavioural engagement, for example attendance at lecturers or workshops, emotional engagement where students display interest, enjoyment or a sense of belonging and cognitive engagement where students actively invest in their learning and go beyond requirements.
For the purpose of this article, student engagement in the learning gain tests refers to students working through the tests in an active and meaningful way and understanding the value that they can gain from doing so. Additionally, engaged students will be proactive in their efforts to partake in additional opportunities offered as part of the project such as attending career and employability sessions or seeking feedback from personal tutors. In this way, it follows the opinion of Trowler (Citation2010) that ‘engagement is more than involvement or participation – it requires feeling and sense-making as well as activity’ (p. 5). This level of engagement in this article is termed ‘meaningful engagement’. It encompasses behavioural, emotional and cognitive engagement. In contrast ‘limited engagement’ refers to students who complete some or all of the tests but do not give them their full attention and therefore do not identify, value or act upon the personal benefits of involvement in the project. There are also additional third party activities mentioned in this article such as student societies. For the purposes of this article, engagement in these activities is referred to as involvement or participation. That is not to say students do not engage in these activities as per the definition above, in most cases the opposite is true, but it is not necessary here to differentiate different levels of engagement.
Theoretical and local context
The discussion and analysis in this article is underpinned by theoretical influences from critical pedagogies and the institutional context of ‘Student as Producer’ at the University of Lincoln. The key concepts of critical pedagogy were established by Freire (Citation1970) within a philosophy of education as social transformation, actively consciousness raising, liberating and humanising. Building on critical theories, Student as Producer at Lincoln has established a progressive conceptual framework for collaborative, democratic undergraduate teaching and learning throughout the institution (Neary, Saunders, Hagyard, & Derricott, Citation2014). This framework has also driven a now embedded institutional culture of student engagement and partnership, encouraging ‘the development of collaborative relations … for the production of knowledge’ (Neary & Winn, Citation2009, p. 137). Alongside this, the strategic plan for 2016–2021 (University of Lincoln, Citation2016, p. 5) sets out a vision to ‘help students develop into highly engaged, employable and creative-thinking graduates who contribute to the development of society and the economy’. Student engagement means more than attendance or completion, engagement at Lincoln means active involvement in University life in and beyond the curriculum. One way this is encouraged is through the Lincoln Award (University of Lincoln Students’ Union, Citation2017), an employability framework designed to support, enhance and recognise extra-curricular activity. Many of the constructs within the Lincoln Award are intentionally paralleled within the Learning Gain project.
Critical pedagogies challenge established institutional and practice norms (Serrano, O’Brien, Roberts, & Whyte, Citation2015) and the marketized, consumerist, hierarchical context of higher education; Student as Producer similarly redefines how academic knowledge is produced (Neary & Winn, Citation2009). As such, it could be argued that the drive to measure learning gain as a quantifiable outcome of higher education, directly represents the very culture that Student as Producer set out to challenge. For this reason, exploring measures of learning gain within this theoretical and local context is of particular interest. As the project progresses it aims to gain further understanding of ways in which tests and measures of this type can be made meaningful, relevant, enabling and empowering for students, as well as providing useful data at an institutional and national level. Under Student at Producer ‘students are supported by student services and professional staff so they can take greater responsibility not only for their own teaching and learning, but for the way in which they manage the experience of being a student at the University of Lincoln’ (www.studentasproducer.lincoln.ac.uk). In order to facilitate this students need to be given the opportunity to reflect on their learning and skills development, and staff need access to robust data to understand more about how students learn and to develop efficient tools and techniques to support this further. Under this pedagogy, the Lincoln pilot project maintains that regardless of the national context, and potential high level uses of the data, the greatest value of learning gain data is for individual students, and for Schools, Colleges and Institutions to be able to better support these students. In this context, the challenge of ensuring meaningful engagement from students with the learning gain assessment process is especially important. Only if students are going beyond behavioural engagement to cognitive and emotional engagement does the process become valuable to individual students.
Measurement context
Whilst the development of learning gain teleology in the UK is relatively new, the international context is more established (McGrath et al., Citation2015). Standardised tests use consistent questions, scoring procedures and interpretation methods to allow comparisons to be made across individuals and groups (Benjamin, Citation2012a). To widespread consternation, when using standardised tests a major study in the USA (Blaich, Citation2012) found apparent ‘limited learning’ in college students (Arum & Roksa, Citation2011) with the claim that ‘45 per cent of US students demonstrated no significant improvement in a range of skills – including critical thinking, complex reasoning and writing – during their first two years of college’ (McGrath et al., Citation2015, p. 3). Pascarella, Blaich, Martin, and Hanson (Citation2011), in an article reporting some of the findings of a study that replicated the work of Arum and Roksa (Citation2011) but with different student and institution samples in the USA, argue that caution needs to be taken when interpreting the test data. In particular, they raise concern about the lack of control groups and the risk of unsubstantiated judgements being made about levels of change measured. It does seem unlikely that talented students are not learning anything during their college education so consideration needs to be given as to whether the standardised tests can appropriately capture the skills being learnt, and, whether students were fully engaged with the process.
One explanation of why the standardised tests showed limited learning is that if a test is not a formal part of the curriculum students may not give it their full effort. Hence there is no guarantee that the test results are an accurate reflection of student ability (Arum & Roksa, Citation2011). Herein lies the challenge: in order to make such a test a formal part of the curricula it is first necessary to establish the test’s validity, whether it measures the right things, produces robust and comparable results, and ideally forms a positive and beneficial component of students’ education.
One alternative to standardised tests is to use self-reflection to capture a student’s perception of their skills and development in key areas. There has been some success in the USA using self-assessment at multiple points in time to track learning gain and contribute to improving teaching practice (Randles & Cotgrave, Citation2017). There are a number of UK-wide surveys already in place that incorporate some aspects of learning gain in their question sets, for example the National Student Survey (NSS) and UK Engagement Survey (UKES). However, these surveys are only undertaken once and do not currently provide the opportunity to monitor longitudinal learning gain over the course of a student’s academic education (McGrath et al., Citation2015). Modifications of these surveys with repeat administrations could offer insight into learning gain, however these too present a number of challenges: the results are subjective and require careful interpretation, students could intentionally misrepresent themselves or not have the ability to accurately self-assess their skills (Bowman, Citation2014; Kruger & Dunning, Citation1999; Porter, Citation2013) and the issue of meaningful engagement remains.
In addition to bespoke ‘tests’, universities already capture a large amount of data on their students. There is potential for this data to be used much more effectively to explore learning gain. For example, the pilot UKES survey showed that students who were strongly engaged with university activities were more likely to have a positive learning experience (Buckley, Citation2013).
Methodology
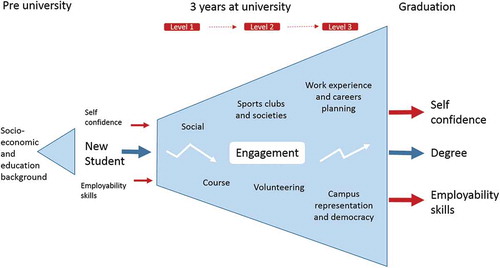
For the purpose of this project, is used to conceptualise learning gain during a student’s educational journey. It depicts the assumption that the central focus of a new student arriving at university is to graduate with a degree. During their time at university students may also gain a wider range of skills, values, attributes and knowledge, and grow in self-confidence. Traditionally, these additional skills are not captured in degree classifications and this broader process of development in higher education is not fully understood. Many universities include the development of these skills within their curricula under the banner of ‘employability skills’. The use of this terminology is contested and it is recognised that employability skills are interpreted and valued differently by different stakeholders (Tymon, Citation2013; Yorke, Citation2006). Despite this, the idea that there is a core set of skills that are clearly valued by employers and form the core of most employment-related psychometric tests and other non-industry specific assessment criteria, offers a useful means to measure the value added to a student’s personal attributes by their university education. There are multiple opportunities for students to develop these skills by participating in activities within and beyond the curriculum.
Figure 1. Learning gain throughout the student journey.
The Lincoln/Huddersfield project is a longitudinal study following a statistically significant number of students over the duration of their undergraduate studies in a number of distinct disciplinary areas. Students were asked to complete two exercises each academic year (the final year data collection is still to be completed). The exercises included a Student Self-Assessment (SSA) developed in-house which captures each student’s perception of their own capability against seven key employment competencies, and a commercially available Situational Judgement Test (SJT) which measures competencies in relation to both critical reflection and problem solving.
The results of these two tests are combined with additional data about students, already collated by the university, including socio-economic characteristics, academic marks and academic participation (number of visits to the library, times logged into Blackboard and attendance). Recognising that the concept of learning gain goes beyond discipline knowledge to encompass wider personal, psychological and social development (McGrath et al., Citation2015), the project is also collecting data relating to student activities beyond students’ programmes of study including participation in sports, societies, representation and democracy, engagement and volunteering activities. By combining the above data in Individual Student Profiles, it is hoped to not only track student development in terms of competence and self-perception, but also to identify potential correlations between extra-curricular activity and growth in confidence and ability. When completing the SSA and SJT for the first time, students were asked to provide consent for this additional data to be collated and used in this project. The data collection timeline is shown in .
A key feature of this project is close integration with the Careers and Employability Service. It is known that students starting university often have ‘high ambitions but no clear life plans for reaching them’ and ‘limited knowledge about their chosen occupations’ (Arum & Roksa, Citation2011, p. 3). Student interaction with the Careers and Employability Service is known to be sporadic and very limited through their early years at university (AGCAS, Citation2015). In response to this, the additional activities around the project have been designed to promote early interaction with the careers service. Students are offered genuine benefits from participating in the project through opportunities to build on their learning gain test results and encouragement to be proactive about their future career planning throughout their time at university.
The situational judgement test
SJTs are a form of psychological aptitude test widely used in employment assessment centres which not only provides a measure of how students approach situations they might encounter in the workplace, but can also deliver developmental, formative feedback. SJTs have been shown to be a good predictor of job performance (McDaniel, Morgeson, Finnegan, Campion, & Braverman, Citation2001; Weekley & Ployhard, Citation2006) and are already used extensively within academia in medicine-based subjects (Husbands, Rodgerson, Dowell, & Patterson, Citation2015; Patterson et al., Citation2016; Taylor, Mehra, Elley, Patterson, & Cousans, Citation2016). Despite their widespread successful use, it is important to be aware of the potential for SJTs to be affected by bias towards particular groups of students, and for repeat administrations and/or coaching to improve results (Lievens, Peeters, & Schollaert, Citation2008).
When selecting a situational judgement test for use in the project the CLA+ test used in the Wabash study in the USA (Blaich, Citation2012) was discounted due to costs of procurement, the administrative burden, and the long duration of the test. Following an exhaustive procurement exercise, the project selected the ‘Graduate Dilemmas’ SJT, developed by Assessment and Development Consultants (A&DC), hereafter referred to as the SJT. This is an off-the-shelf, automated package currently used by a large number of high profile UK employers to assess employability-based competencies in graduates. The SJT was developed based on the concept summarised by McDaniel, Whetzel, Hartman, Nguyen, and Grubb (Citation2006) that the ‘ability to make judgements is not down to one single attribute, but is determined by a combination of cognitive ability, personality, experience and knowledge’ (A&DC, Citation2015, p. 5). During the SJT students are asked to rate the effectiveness of a number of responses to different scenarios. They are scored based on how similar their responses are to answers from job experts from a panel of UK-based small and medium-sized enterprises (SMEs). The output from the SJT is an overall score, and individual scores for key competencies: relationship building, critical thinking, planning and organising, communicating and influencing and analytical thinking. The SJT generates two output reports, the Participant Report, for students, and the Assessment Report, for use by Personal Tutors and the Careers and Employability Service. These reports highlight participants’ strengths and areas for further development. The reports also include recommendations for how areas of weakness can be addressed most effectively. The scores in these reports are presented as percentiles showing the percentage of A&DC’s SJT reference group that each student outperformed. This reference group consists of over 3000 UK students and graduates recruited by A&DC to take the test during its development (A&DC, Citation2015). Interested readers can find further details of the test on A&DC’s website (A&DC, Citation2017).
The student self-assessment
Working with the University of Huddersfield and the University of Lincoln’s Careers and Employability Service, a Student Self-Assessment (SSA) was developed including nine questions focusing on seven core employment competencies: agility, resilience, self-motivation, commercial awareness, influencing, leadership and emotional intelligence. The competencies were linked to those previously valued in the Lincoln Award (University of Lincoln Students’ Union, Citation2017). This test is administered via Blackboard, the virtual learning environment at Lincoln. The questions in the student self-assessment are shown in . Students were asked to rate their abilities in each area on a scale of 1–10. Following each question there was also the opportunity for free text reflection with students asked to provide examples to support their assessment. The wide range of the rating scale was originally proposed to enable growth to be tracked across longitudinal administrations of the SSA. In practice, as discussed later in this article, the 10-point scale did not provide enough structure for students to consistently rate their abilities and a narrower range would have been preferable. It is also recognised that the questions used in the SSA do not conform to the principles of good question structure. The SSA was developed quickly and collaboratively to facilitate administration as close to the start of the academic year as possible. It serves its purpose as a proof of concept tool but it is recognised that further development of the SSA would be required if it was to be used on a large scale to capture learning gain.
Box 1. Student self-assessment question set.
Test administration and student participation
This mixed methods project collected data from eight disciplinary areas: architecture and design, business, computer science, engineering, fine and performing arts, history and heritage, pharmacy and psychology. This was a purposive sample representing contrasting academic traditions. Students from selected courses starting in the 2015/2016 academic year were invited by email to take part in the study (this group of students is refered to as Cohort 1). The number of students invited to participate from each school was not consistent, for example, a large first year intake, and higher levels of support for the project from academic staff in Psychology led to high numbers of psychology participants compared to other schools. Therefore, the sample is not necessarily representative of the campus-wide intake. Completion rates by school are shown in .
Table 1. First year completion rates.
Despite both the Students’ Union, relevant academics from each school and the Deputy Vice Chancellor championing the project, the initial response was relatively poor. In order to increase participation, an incentive worth £10 was introduced as well as a prize draw for £100 of gift vouchers. Students were repeatedly encouraged to complete via email and the Students’ Union undertook to telephone students who had begun but not completed the tests. Recognising that uptake might be higher following communications from subject academics rather than from the project administrators, reminder emails were sent to students in the names of their Personal Tutors. Following these incentives, a completion rate of 47% was achieved for Cohort 1. As expected, completion statistics for the 10-minute Student Self-Assessment exceeded those for the more time-consuming and labour-intensive 30-minute SJT (45% compared with 39%).
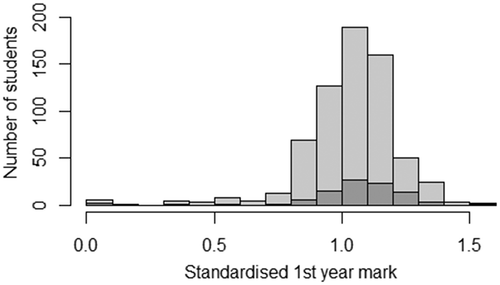
This approach was labour intensive and costly. While achievable for a small pilot study it would not be appropriate for a larger study. To both increase the student numbers in the study and test the lessons learnt from the first administration, a second cohort of students from the 2016/2017 intake was identified in the Schools of Pharmacy, Psychology and Architecture & Design (Cohort 2). The first cohort completion rates were generally highest where the tests were undertaken in formalised co-curricula timetabled workshops. Completion rates were usually lowest where students were introduced to the project by Personal Tutors, but then left to undertake the tests in their own time. Based on these findings, Cohort 2 were asked to compete the assessments during scheduled workshops in Welcome Week (September 2016). Students in Cohort 2 were not offered any monetary incentives for their involvement. The student numbers reported in indicate that this approach was successful in increasing the completion rate by 13% while reducing staff time in administering the tests. The total number of Level 1 students completing either one or both of the SSA and SJT tests across both cohorts was 675. Additional cohorts of students are also being followed at the University of Huddersfield which will enable comparison of trends across different academic disciplines and a separate academic environment. As the collection of data at Huddersfield is being carried out on a different timeframe to the Lincoln data, it is not reported in this article. One concern with pseudo-voluntary student participation such as this is ensuring a representative sample. The male/female split across the whole cohort was 26%/74% (175 males and 500 females), the reason for this skew was the large number of students from Psychology (55% of the total cohort) which is a female-dominated programme. Apart from the gender ratio, the demographic was representative of the student population at the University of Lincoln as a whole so in this aspect the self-selecting sampling process worked well. There was no evidence of an attainment bias in the sample. The standardised marks for participants shown in (mean 1.04, sd 0.19) were not significantly different from 1 (t = 0.186, df = 662, p = 0.426).Footnote1 A student with a standardised mark of 1 achieved the average mark for all students on their course in their academic year. Standardised marks were used rather than student grades as there are known inconsistencies in university marking (Bloxham, den-Outer, Hudson, & Price, Citation2015; Milson, Stewart, Yorke, & Zaitseva, Citation2015). This method removes any potential difference in marking between schools (and across years as the study developed).
Figure 2. Data collection timeline.
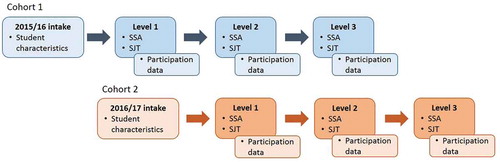
Figure 3. Histogram of level 1 standardised marks for students partaking in the learning gain project.
Note: The darker grey section of the histogram identifies students who provided free text answers to the SSA
Efficacy of initial SJT and SSA results for exploring learning gain
The SJT results are presented in as the percentage of A&DC’s comparison group that the participant outperformed. Given that the comparison group used by A&DC includes both undergraduate and postgraduate students as well as recent employed and unemployed graduates with an average age of 26 (A&DC, Citation2015), it is unsurprising that new undergraduate students performed poorly on the SJT. In all, 61% of all participants in the study scored below or well below average. The distribution of results was similar for cohorts 1 and 2. The low initial SJT scores indicate that this test offers good potential for tracking upward progression of students during the course of their studies; however, from the new student’s perspective, it was disconcerting, and possibly detrimental to their confidence, to receive feedback reports showing below average performance. Further qualitative research at the University of Lincoln is ongoing to establish the impact of this on students’ confidence and willingness to continue to engage in the project.
Table 2. Overall SJT scores (both cohorts).
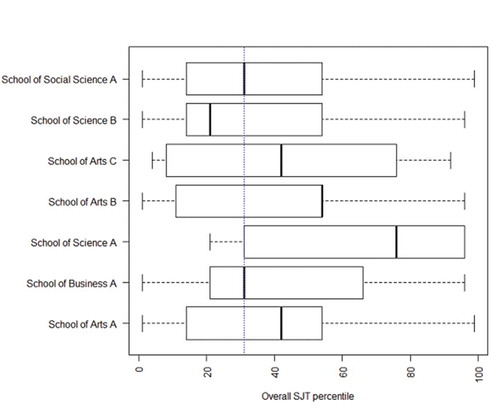
The SJT percentile scores for individual schools (reported here based on their parent college to preserve identities during this pilot project) show interesting variations compared to the overall cohort. The median results across all schools were 21% (shown in blue in ). Students in the School of Science A performed better than other schools (it should be noted that as there were only nine students from this school in the study so these results will be sensitive to individual student performance, none the less the difference in mean overall percentile score of 32.82 is significant t = 2.97, df = 621, p < 0.005). To help further understand the variation between schools shown in it is necessary to go beyond the overall SJT results to look at performance in individual areas. ,) compare performance in the areas of ‘relationship building’ and ‘analytical thinking’. The School of Science A students’ strong overall performance was driven by their high scores in the analytical thinking sections of the test. In contrast students from the School of Arts C and School of Social Science A show stronger skills in relationship building. This discussion serves to indicate the limitations of using the overall SJT score to represent the skill set of all students when students from different disciplines begin their academic journeys with different natural strengths and weaknesses.
Figure 6. Cohort 1 SJT performance compared to first year academic marks.
Note: The vertical red lines on this plot represents the average first year course mark. The horizontal red line represents the SJT percentile lowest score rated as an ‘above average performance’ by A&DC. The shaded area therefore identifies students who performed above average academically and on the SJT.
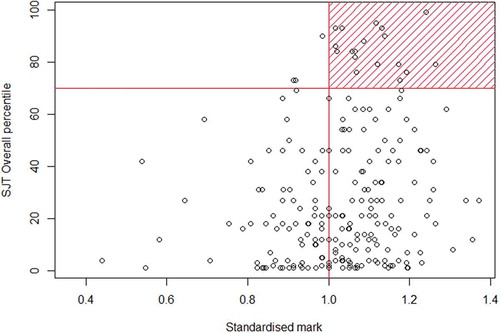
Figure 7a. Overall percentile SJT scores by school.
Notes: School results are reported based on their parent college. The bold line is the median score, the box contains the interquartile range between 25% and 75% (i.e. the middle 50% of ratings), the whiskers indicate the data range, and any remaining data points are outliers. The blue dotted line on each plot shows the median score across all schools. One school is not shown in these plots due to too few students completing the SJT for reliable data.
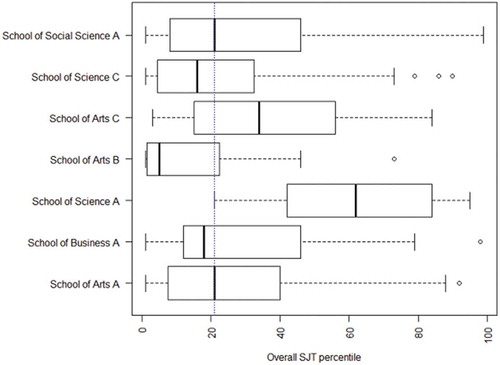
Figure 7b. SJT scores for Relationship Building by school.
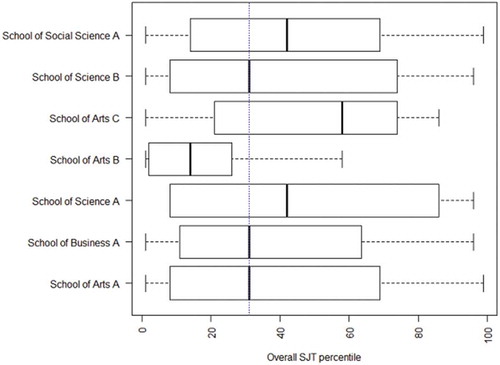
Figure 7c. SJT scores for Analytical Thinking by school
One consistent result across all schools was poor performance in the area of ‘Communicating and Influencing’ with a median percentile score of 16%. This had a significant effect on the overall SJT results, bringing the overall average results down to 21% whereas other individual areas have a median value of over 30% (shown as blue dotted lines in ). The importance of communication skills is reflected in other surveys both at the University of Lincoln and nationally, for example, only 25% of students included in UKES reported that their overall student experience had helped them develop their speaking skills (Higher Education Academy, Citation2015). This similarity between the SJT results and other established surveys helps support the potential of the A&DC SJT as a suitable instrument to identify relevant skills and weaknesses in undergraduates.
The SSA asked students to rate themselves from one to ten on nine questions covering their skills and understanding of the labour market. In contrast to the low scores on the SJT, in general most students rated themselves highly on the SSA and there was little variation between results for each question or between schools. The mean rating was higher in Cohort 1 (mean = 65, sd = 9.09) than Cohort 2 (mean = 61, sd = 9.25). This difference of 4 rating points was statistically significant (t = 5.17, df. = 650, p < 0.0001), possibly suggesting an increase in confidence when the SSA was completed later in the first year. The results for one question in the SSA stood out as being significantly different to the others. Across the board, students indicated low confidence in understanding of the labour market and commercial environment in which they hoped to work. The difference of two rating points between the mean rating for this question and all other questions in the SSA was significant (t = − 23.32, df. = 1322, p < 0.0001) and reflects the known lack of career focus in most first year students.
One criticism of student self-assessment is that students are often unable to rate themselves accurately either against themselves or against their performance over time due to not knowing the reference frame (Bowman, Citation2010; Porter, Citation2013). The data collected from the SSA echoes these findings with evidence of student rating that seem to contradict their free text answers and different students applying different ratings to very similar text answers. An example is shown in where four students from Cohort 2 gave very similar answers, but their self-assessment ratings ranged from 5 to 8. This makes it difficult to use the SSA in a quantitative analysis, but it retains value as a tool for self-reflection and to facilitate discussion with Personal Tutors and Careers Advisors. In addition, the free text answers help provide insight into the type of situations/experiences that students have found beneficial in the development of employability skills.
Box 2. Example responses to the SSA.
Student engagement and the value of participation for individual students
Despite these general trends indicating the potential for the SSA and SJT to identify indicative features of first years’ skill sets and therefore be potentially useful for tracking learning gain, the experience of administrating the tests raised concerns about the efficacy of the data due to limited student engagement.
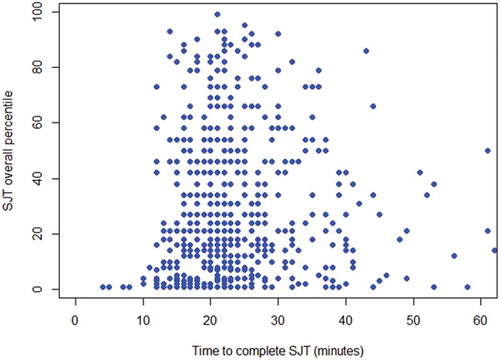
It was not possible to guarantee that students in either cohort were fully focused on the tests either independently or in the workshops leading to concerns about levels of emotional engagement from students with the assessment. Members of staff supervising the workshops reported differing levels of attention from students during the session. Using time taken to complete the SJT as an objective proxy for effort levels () was found to be of limited value as there was a wide spread of results for each completion time. Times varied from four minutes to several days (the latter are assumed to have opened the SJT and then returned to complete at another time). Completion times of less than 12 minutes did not appear to result in representative results and after around 30–40 min there was no further improvement in result. This supports A&DC’s assessment that their SJT should take around 30 min to complete, but does not help identify individual students who were not meaningfully engaged and hence makes it difficult to draw conclusive trends from the results.
Figure 4. Completion time of SJT compared to results (both cohorts).
Note: completion times of > 60 min are not shown
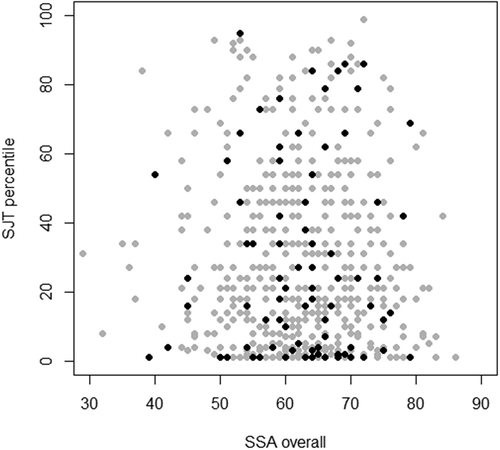
There is no completion time data for the SSA; however, it seems fair to assume that students who provided optional free text answers to support their ratings were more engaged with the assessment than others. In Cohort 1, 15% of students (42) provided free text answers to one or more questions. In Cohort 2 this fell slightly to 13% (53 students). The darker grey section of the histogram in identifies students who provided free text answers to the SSA, as shown these students replicate the distribution of academic marks across all students completing the tests so there is no further bias in academic ability from students assumed to have fully engaged with the test compared to all students in the cohort (mean standardised mark for students providing free text answers = 1.05, sd = 0.22, and for students not providing free text answers mean = 1.03, sd = 0.18, this difference is not significant t = − 0.848, df = 661, p = 0.397). The SJT percentiles and overall SSA ratings for these students () show that they represent a broad spectrum of students’ performance across both tests; none the less, overall, only a very low percentage of students can be assumed to have fully engaged with the tests. This also raises an additional question of why the number of free text answers fell slightly in Cohort 2. This could be a function of the workshop setting; for example, perhaps the instructions at the time made students feel less inclined to fill-in free text; perhaps students wanted to finish and leave quickly; or possibly students were self-conscious about others seeing their responses. Although the workshops increased the number of completions in Cohort 2, overall there is no evidence that they increased focus or meaningful engagement.
Figure 5. Sample space coverage of students providing free text answers to the SSA compared to their overall SSA and SJT scores.
Note: Solid black dots show students who provided free text answers to one or more questions in the SSA, the grey dots show all other students
A core objective of the study was to ensure value for the students who volunteered to take part. Personal Tutors, the Careers and Employability team and project staff have repeatedly emphasised these benefits to students throughout the year. The SJT is commonly used by mainstream employers in their selection and recruitment processes meaning students can gain familiarity with this type of test before they are faced with it when applying for jobs. After completing the SJT students received a feedback report. They were actively encouraged to take this report to personal tutor sessions and/or the Careers and Employability Service as a starting point to create targeted development plans to make the most of the opportunities available to them while studying at the University of Lincoln. If, and when, this engagement occurs was recorded in the project database.
Typically, student interaction with the Careers and Employability Service is minimal during the first year of study, gradually increasing during years two and three (this reflects the national trend as found by AGCAS, Citation2015). It was hoped that encouraging students to use the SJT report as a focus for discussion during the first year would increase early interaction. To date this has not been the case. There has been no reported increase in students requesting one-to-one sessions with careers advisors and there were no attendees at bespoke events put on by the Careers and Employability Team for learning gain students. Whilst this lack of interaction is not unsurprising in first year students, the fact that students are not motivated or inspired enough to make the most of opportunities offered to them further adds to the argument that students are not fully engaged with the tests.
Assessment of suitability of the methodology for measuring learning gain within institutions
The core aim of the HEFCE learning gain pilot projects is to explore the potential to develop methodologies for assessing learning gain within and across UK higher education institutions. The pilot projects are currently testing a number of approaches (Kandiko Howson, Citation2017). When those projects complete, there will be a much larger and more robust evidence base. Through the experiences reported in this article of initiating, administering and evaluating the first year of a longitudinal, mixed methods study, this project has found that HEFCE’s challenge is twofold, there is a requirement to develop appropriate methodologies to assess learning gain, and, simultaneously to ensure that students are meaningfully engaged with the process. The two challenges cannot be considered independently as the efficacy of the data from any standalone measure of learning gain is dependent upon how seriously students have taken the assessments. It is for this reason that the authors consider the starting point of ‘Student as Producer’ as essential for the success of measures of learning gain, as only when the student takes ownership of the production of learning gain data and actively uses the process to support the development of their own knowledge, skills and experiences will confidence in the efficacy of learning gain data increase.
Returning to the definition of meaningful engagement as incorporating aspects of behavioural, emotional and cognitive engagement, it is recommended that to support behaviour engagement any measure of learning gain should be:
Easy to administer;
Scalable in terms of staff time and resources to large numbers of students;
Timetabled and embedded in the curriculum so that it is clear to students and staff that it forms a valued part of their education.
To maximise students’ emotional engagement measures should be:
Suitable for all students and all disciplines – the test should not disadvantage students with additional language barriers or learning difficulties and should be granular enough to address differences in specific aspects of learning gain across disciplines;
Interesting and relevant to students; and
Take a realistic amount of time.
To support cognitive engagement it should be:
Beneficial to students for self-reflection and development planning;
Provide robust data in a useable format that can be easily integrated with other existing data sets and used to support student learning.
Reviewing the two tests administered as part of this project against these criteria the SJT was easy to administer and to track completions. It can be completed by students using a computer (or mobile device) without the need for staff instruction (although it was found that that having staff available to resolve technical issues was beneficial) and is automatically marked by the Apollo software. The SSA was developed inexpensively in house and was easily administered using Blackboard. In this respect the administration of both the SJT and SSA is scalable to any number of students.
The combined time to complete both assessments was designed to be 40–45 min. This is a realistic amount of time to ask students to spend on an additional activity but is long enough to suggest a worthwhile activity and to encourage students to emotionally engage with the process.
The SSA was a simple assessment which was applicable to all students drawing on their own experiences. A&DC’s development of their SJT has ensured that the scenarios presented have high face and content validity and are relevant to workplace scenarios (A&DC, Citation2015). The facility to break down results into individual competencies offers granular analysis of different aspects of learning gain.
When testing the fairness of their SJT to different groups, A&DC found there were statistically significant differences between participants from white and ethnic minority groups. These differences were significant enough for A&DC to recommend caution when using the SJT in a screening mode for job selection to prevent a disproportionate impact against ethnic minorities (A&DC, Citation2015). This issue would be mitigated against by using the difference between scores at two points in time as a measure of learning gain rather than the absolute scores. Similar testing based on gender and age did not identify any significant differences. The test is only available in English. While this does potentially disadvantage students for whom English is not a first language, the test is untimed in an attempt to minimise such negative impacts. The same applies to students with learning disabilities.
Results from the SJT were automatically formatted into individual reports for students’ personal use, for personal tutors and collated for export by the project data analyst for integration with the wider dataset. The students’ reports made customised suggestions about how students could improve their performance in each of the five assessed areas thereby providing the starting point for students to take ownership of their own skills development and use the reports in focused discussion with the careers service or their personal tutors. A disadvantage of the SSA was that it did not provide robust quantitative data. This was due to inconsistencies in how students rated themselves in each area, and the limited spread of results which offered little opportunity to explore trends in the data compared to student profiles or to monitor an increase in learning gain over time. However, the free text answers did offer useful insight into the type of experiences students felt contributed towards the development of learning gain skills. Despite its limitations in terms of quantitative data, further enhancement of the SSA to develop a more prescriptive question set that is optimised to both the needs of students and those supporting learning, and encouraging students to develop one or more text answers to add depth to their self-assessment, would contribute towards a valuable tool for supporting learning gain at university. The authors therefore conclude that the SJT and a modified version of the SSA are both potentially suitable to support the measurement of some aspects of learning gain within institutions however there are remaining concerns about levels of emotional and cognitive engagement which would need to be addressed through innovative administrative procedures.
Using incentives to increase engagement
The study sought to investigate the use of incentives to increase both number of completions and meaningful engagement. Students in Cohort 1 were incentivised to complete the test and students in Cohort 2 were instructed to complete the test as a core part of their Welcome Week activities. There is no evidence that either group of students gave the test their best effort. Some students completed the SJT test in very short (or long) timeframes indicating low emotional engagement and no students have demonstrated cognitive engagement by taking ownership of their results and discussing them further with personal tutors or the careers service. This leads to questions about both the robustness of the data collected from both the SJT and the SSA and the value to students of completing the assessments. SJTs are designed for use in high stress situations where ‘test taking is embedded in a larger context, and performance has important consequences for the individual’ (Gessner & Klimoski, Citation2006, p. 25). A&DC are clear that the reliability of any assessment is a function of its accuracy and consistency and that candidates’ score on the SJT include an error component including factors such as ambiguity in administration instructions, the test environment or the candidates’ level of motivation. To quote their user guide, ‘reliability is critical to the effective use of a test. If a test is not reliable, then there will be a large margin of error around an individual’s performance on the test. This means that any interpretation of the individual’s performance will lack accuracy’ (A&DC Citation2015, p. 15).
Financial incentivises do not offer a solution to this engagement challenge. Practically it is not scalable to large numbers of students and, even if it were, as demonstrated in this project, it does not ensure students meaningfully engage with the tests. The same logic could be applied to making the tests compulsory but non-credit earning. Again students would complete the tests to gain credits, but there is no guarantee they would take them seriously. It was hoped that offering students the opportunity to use their results as the starting point for careers planning or skills development would improve meaningful engagement but this does not appear to be the case. Further work is needed to assess the value of embedding tests in formalised co-curricula activities, for example using the tests as an integral part of a tutoring session where students are expected to discuss their results directly with tutors in the session.
Transferability of SJTs and SSAs to measuring learning gain in a national context
Momentarily ignoring the challenge of engaging students in any type of non-credit-bearing test or assessment, this article did not set out to suggest that the A&DC Graduate Dilemmas SJT is the most suitable SJT for measuring Learning Gain universally. Nor does it claim that the SSA questions used here would be appropriate in all contexts. However, the article has demonstrated that the SJT produces results that reflect known traits in first year students. Since SJTs offer a means to measure ‘practical intelligence – the ability to adapt to, shape, and select real world environments’ (Stemler & Sternberg, Citation2006, p. 109), this is unsurprising and SJTs similar to the one used in this study are in widespread use for assessing graduates and have been shown to be able to predict job performance (Chan & Schmitt, Citation2002). For a large scale UK application it would arguably be more suitable to develop a custom SJT for the bespoke application of measuring learning gain and using reference groups that have completed the assessment under similar conditions, rather than using a generic test designed for job application settings. However, accepting that there is a universal set of skills needed to succeed in the world remains controversial, and since not all environments will be the same, the balance of skills required by graduates in different careers will be different. In preparing students for different careers, it is likely that the skills first year students arrive at university with and the career readiness skills taught by different courses and at different institutions will differ. A larger, longitudinal data set is needed to assess how suitable the SJT would be to compare students across different courses and higher education institutions.
The SSA does not appear to offer a solution to a universal, comparable measure of learning gain as the self-assessment scores are subjective and inconsistent and as first year students scored themselves so highly there is limited opportunity for tracking improvement. More directed questions and more structure to the rating scheme would help improve this aspect. The free text answers are useful for understanding individuals’ learning journeys but the development of a methodology to review the free text scores on a national scale would be costly and time consuming. There is value to individual institutions in collecting this type of data to inform teaching practice, and, if it can be demonstrated that data is being used for this purpose then the SSA could become an integral tool to improve student engagement.
Conclusion and recommendations
This article set out to illustrate how the insight gained from the implementation and administration of a learning gain pilot study at the University of Lincoln could help shape the measurement of learning gain at UK universities. While the form of any universal learning gain measure in the UK is still under development, this article has argued that the immediate priority is to address the challenge of limited student engagement. Until students can be motivated to take ownership for their learning and to actively use opportunities provided for self-reflection, the authors would echo the concerns of Pascarella et al. (Citation2011) that the interpretation of learning gain data from specific tests should be handled with a healthy amount of caution. It is for this reason that situating Learning Gain within the Student as Producer pedagogy is valuable. Under Student as Producer at Lincoln the role of the student as collaborators in the production of knowledge is valued. If, as the Learning Gain discourse argues, students are gaining much more than just academic knowledge from their degrees, and it is this additional learning that is of benefit to them in their future careers, then students should be equally involved in the production of skills and experience as they are with academic knowledge. Therefore it is recommended that any future learning gain measure should be developed alongside the advancement of a fully integrated administration methodology and the development of strategies to encourage meaningful engagement from students. The next steps in the Lincoln project will be to explore some of the issues around student engagement further through one-to-one interviews and focus groups with students.
Despite the challenge of student engagement, the formal measurement of learning gain at university offers useful opportunities for students to make time to reflect on their skills and be supported in developing bespoke development plans. Simultaneously it can provide improved data for academic and professional staff to use to customise academic course delivery and develop careers and skills modules that better meet the needs of their students. The SJT results reported in this article indicate the variety of competencies in first year students across disciplines, highlighting the challenge with developing a universal measurement of learning gain that would be equally valid across all disciplines and all higher education institutions.
The true value of collecting learning gain data has to be more than just a national comparison between universities, but should be directly useable to influence and improve teaching practice and benefit students’ personal development. Effectively communicating the value of data collection for this purpose may also go some way towards addressing the student engagement challenge.
Additional information
Funding
Notes
1. Significance of trends was assessed using standard two tail t tests to compare sample means between different groups of students assuming equal variance. Data is reported throughout this article giving mean, standard deviation (sd), t statistic (t), degrees of freedom (df) and p value (p). T tests were selected for this purpose as they provide an accessible means of summarising the data at this initial exploratory analysis stage.
References
- A&DC. (2015). Graduate Dilemmas user manual. Guilford, UK: The A&DC Group.
- A&DC (2017). Graduate Dilemmas: Cost effective online candidate sifting. Retrieved from https://www.adc.uk.com/wp-content/uploads/2016/06/Graduate-Dilemmas-Overview.pdf
- AGCAS (2015). First-year student careers and employability survey report. Retrieved from http://www.agcas.org.uk/agcas_resources/823-First-Year-Student-Careers-and-Employability-Survey-Report
- Arum, R., & Roksa, J. (2011). Academically adrift: Limited learning on college campuses. Chicago, IL: University of Chicago Press.
- Bass, R. (2012). Disrupting ourselves: The problem of learning in higher education. Educause Review. Retrieved from http://er.educause.edu/articles/2012/3/disrupting-ourselves-the-problem-of-learning-in-higher-education
- Benjamin, R. (2012a). The new limits of education policy: Avoiding a tragedy of the commons. Cheltenham: Edward Elgar.
- Benjamin, R. (2012b). The seven red herrings about standardized assessments in higher education. Occasional Paper 15. National Institute for Learning Outcomes Assessment, 7–14.
- Blaich, C.F. (2012). Wabash national study 2006–2012. Retrieved from http://www.liberalarts.wabash.edu/study-overview/
- Bloxham, S., den-Outer, B., Hudson, J., & Price, M. (2015). Let’s stop the pretense of consistent marking: Exploring the multiple limitations of assessment criteria. Assessment & Evaluation in Higher Education, 41(3), 466–481.
- Bowman, N.A. (2010). Can 1st-year college students accurately report their learning and development? American Educational Research Journal, 47(2), 466–496.
- Bowman, N.A. (2014). The meaning and interpretation of college student self-reported gains. New Directions for Institutional Research, 2014, 59–68.
- Buckley, A. (2013). Engagement for enhancement: Report of a UK survey pilot. UK: The Higher Education Academy.
- Business, Innovation & Skills [BIS]. (2016). Success as a knowledge economy: Teaching excellence, social mobility & student choice. (Cm 9258). London: BIS.
- Chan, D., & Schmitt, N. (2002). Situational judgement and job performance. Human Performance, 15(3), 233–254.
- Friere, P. (1970). Pedagogy of the oppressed. London: Penguin.
- Gessner, T.L., & Klimoski, R.J. (2006). Making sense of situations. In J.A. Weekley & R.E. Ployhart (Eds.), Situational judgement tests: Theory, measurements and application (pp (pp. 13–28). London: Lawrence Erlbaum Associate Publishers.
- Healey, M., Flint, A., & Harrington, K. (2014). Engagement through partnership: Students as partners in learning and teaching in higher education. York: Higher Education Academy.
- HEFCE (2016) Policy guide: Learning gain. Retrieved from http://www.hefce.ac.uk/lt/lg/
- Higher Education Academy (2015). UKES: Students’ perceptions of skills development. Retrieved from https://www.heacademy.ac.uk/system/files/ukes_2015.pdf
- Husbands, A., Rodgerson, M.J., Dowell, J., & Patterson, F. (2015). Evaluating the validity of an integrity-based situational judgement tests for medical school admissions. BMC Medical Education, 15(144), 1–9.
- Kahu, E.R. (2013). Framing student engagement in higher education. Studies in Higher Education, 38(5), 758–773.
- Kandiko Howson, C.B. (2017). Evaluation of HEFCE’s learning gain pilot projects. London, UK: King’s College London. Retrieved from http://www.hefce.ac.uk/media/HEFCE,2014/Content/Pubs/Independentresearch/2017/Evaluation,of,HEFCEs,Learning,Gain,Pilot,Projects,Year,1,Report/2017_lgeval.pdf.
- Kruger, J., & Dunning, D. (1999). Unskilled and unaware of it: How difficulties in recognizing one’s own incompetence lead to inflated self-assessments. Journal of Personality and Social Psychology, 77(6), 1121–1134.
- Kuh, G.D., Pace, C.R., & Vesper, N. (1997). The development of process indicators to estimate student gains associated with good practices in undergraduate education. Research in Higher Education, 18(4), 435–453.
- Lievens, F., Peeters, H., & Schollaert, W. (2008). Situational judgment tests: A review of recent research. Personnel Review, 37(4), 426–441.
- McDaniel, M.A., Morgeson, F.P., Finnegan, E.B., Campion, M.A., & Braverman, E.P. (2001). Use of situational judgement tests to predict job performance: A clarification of the literature. Journal of Applied Psychology, 86(4), 730–740.
- McDaniel, M.A., Whetzel, D.L., Hartman, N.S., Nguyen, N.T., & Grubb, W.L. (2006). Situation judgement tests: Validity and an integrative model. In J.A. Weekley & R.E. Ployhard (Eds.), Situational judgement tests: Theory, measurements and application (pp (pp. 183–203). London: Lawrence Erlbaum Associate Publishers.
- McGrath, C.H., Guerin, B., Harte, E., Frearson, M., & Manville, C. (2015). Learning gain in higher education. Cambridge, UK: RAND Corporation.
- Milson, C., Stewart, M., Yorke, M., & Zaitseva, E. (2015). Stepping up to the second year at university. Abingdon: Routledge.
- Neary, M., Saunders, G., Hagyard, A., & Derricott, D. (2014). Student as producer: Research-engaged teaching, an institutional strategy. York: Higher Education Academy. Retrieved from www.heacademy.ac.uk/project/student-producer-research-engaged-teaching-and-learning-institutional-strategy
- Neary, M., & Winn, J. (2009). The Student as Producer: Reinventing the student experience in higher education. In L. Bell, H. Stevenson, & M. Neary (Eds.), The future of higher education: Policy, pedagogy and the student experience. London: Continuum.
- Pascarella, E.T., Blaich, C., Martin, G.L., & Hanson, J.M. (2011). How robust are the findings of academically adrift? Change. May/June 20- 24.
- Patterson, F., Knight, A., Dowell, J., Nicholson, S., Cousans, F., & Cleland, J. (2016). How effective are selection methods in medical education? A systematic review. Medical Education, 50, 36–60.
- Porter, S. (2013). Self-reported learning gains: A theory and test of college student survey response. Research in Higher Education, 54, 201–226.
- Randles, R., & Cotgrave, A. (2017). Measuring student learning gain: A review of transatlantic measurement of assessments in higher education. Innovations in Practice, 11(1), 50–59.
- Robinson, W., & Hilli, A. (2016). The english teaching excellence framework and professionalising teaching and learning in research-intensive universities; an exploration of opportunities, challenges, rewards and values from a recent empirical study. Foro De Educación, 21(14), 151–165.
- Serrano, M.M., O’Brien, M., Roberts, K., & Whyte, D. (2015). Assessing critical pedagogy: ‘non-traditional learning’ and module assessment. Liverpool, UK: University of Liverpool and Higher Education Academy. Retrieved from https://www.liverpool.ac.uk/media/livacuk/cll/reports/assessing_critical_pedagogy_non-traditional_,learning_and_module_assessment.pdf
- Sharar, B. (2016). Emergent pedagogy in england: A critical realist study of structure-agency interactions in higher education. Abingdon: Routledge.
- Stemler, S., & Sternberg, R. (2006). using situational judgement tests to measure practical intelligence. In J.A. Weekley & R.E. Ployhard (Eds.), Situational judgement tests: Theory, measurements and application (pp. 107–131). London: Lawrence Erlbaum Associate Publishers.
- Taylor, N., Mehra, S., Elley, K., Patterson, F., & Cousans, F. (2016). The value of situational judgement tests for assessing non-academic attributes in dental selection. British Dental Journal, 222(11), 565–566.
- Thomson, G., & Douglass, J.A. (2009). Decoding learning gains: Measuring outcomes and the pivotal role of the major and student backgrounds. Center for Studies in Higher Education Research and Occasional Paper Series, CSHE.5.09.
- Tremblay, K., Lalancette, D., & Roseveare, D. (2012). Assessment of higher education learning outcomes: Feasibility study report, AHELO Volume 1 Design and Implementation. Paris: OECD.
- Trowler, V. (2010). Student engagement literature review. York, UK: The Higher Education Academy. Retrieved from https://www.heacademy.ac.uk/system/files/studentengagementliteraturereview_1.pdf
- Tymon, A. (2013). The student perspective on employability. Studies in Higher Education, 38(6), 841–856.
- University of Lincoln (2016). Thinking ahead 2016-2021 strategic plan. University of Lincoln. Retrieved from http://lincoln.ac.uk/home/media/universityoflincoln/globalmedia/documents/UOL,Strategic,Plan,(MAR,2016),V5Final.pdf
- University of Lincoln Students’ Union (2017). The lincoln award. Retrieved from https://lincolnsu.com/lincolnaward/about.
- Weekley, J.A., & Ployhard, R.E. (Eds.). (2006). Situational judgement tests: Theory, measurements and application. London: Lawrence Erlbaum Associate Publishers.
- Yorke, M. (2006). Employability in higher education: What it is - what it is not. York, UK: The Higher Education Academy.